| Param | Original file | Final file |
|---|---|---|
| Filename | modeM0/AS1A10_102T06_9000004078_28293cztM0_level2.evt | modeM0/AS1A10_102T06_9000004078_28293cztM0_level2_quad_clean.evt |
| Size (bytes) | 550,802,880 | 79,793,280 |
| Size | 525.3 MB | 76.1 MB |
| Events in quadrant A | 3,851,076 | 482,425 |
| Events in quadrant B | 3,315,259 | 508,453 |
| Events in quadrant C | 3,307,012 | 485,627 |
| Events in quadrant D | 5,750,674 | 469,680 |
| Mode M9 | |||
|---|---|---|---|
| Quadrant | BADHDUFLAG | Total packets | Discarded packets |
| A | 0 | 11 | 0 |
| B | 0 | 12 | 0 |
| C | 0 | 12 | 0 |
| D | 0 | 12 | 0 |
| Mode M0 | |||
|---|---|---|---|
| Quadrant | BADHDUFLAG | Total packets | Discarded packets |
| A | 0 | 15921 | 0 |
| B | 0 | 14231 | 0 |
| C | 0 | 14083 | 0 |
| D | 0 | 21910 | 0 |
| Quadrant | Total seconds | Saturated seconds | Saturation percentage |
|---|---|---|---|
| A | 6736 | 282 | 4.186461% |
| B | 6736 | 51 | 0.757126% |
| C | 6736 | 100 | 1.484561% |
| D | 6736 | 638 | 9.471496% |
Noise dominated data is calculated using 1-second bins in cleaned event files. If a bin has >2000 counts, and if more than 50% of those come from <1% of pixels, then it is considered to be noise-dominated and hence unusable.
| Quadrant | # 1 sec bins | Bins with >0 counts | Bins with >2000 counts | High rate bins dominated by noise | Noise dominated (total time) | Noise dominated (detector-on time) | Marked lightcurve |
|---|---|---|---|---|---|---|---|
| A | 7706 | 6736 | 223 | 223 | 2.89% | 3.31% | 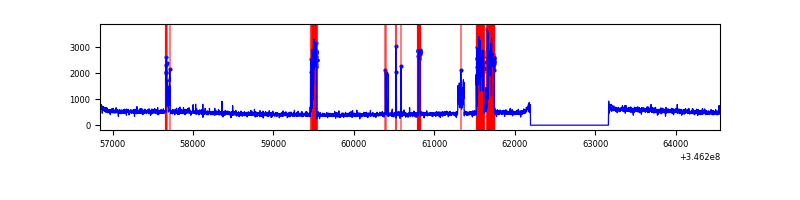 |
| B | 7706 | 6736 | 4 | 4 | 0.05% | 0.06% | 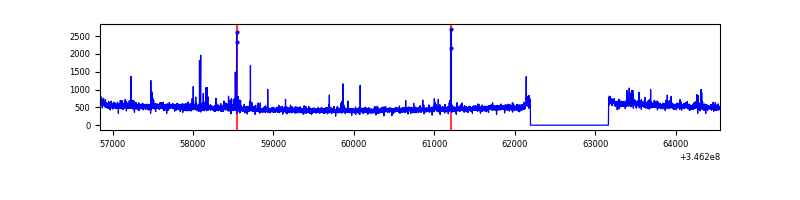 |
| C | 7706 | 6736 | 7 | 7 | 0.09% | 0.10% | 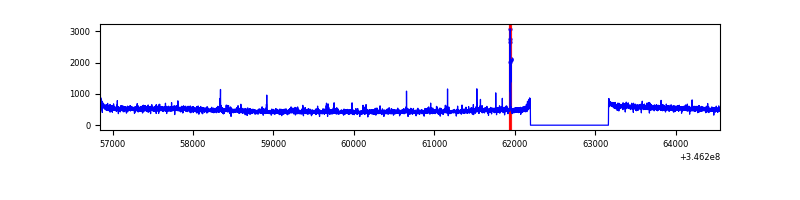 |
| D | 7706 | 6737 | 445 | 445 | 5.77% | 6.61% | 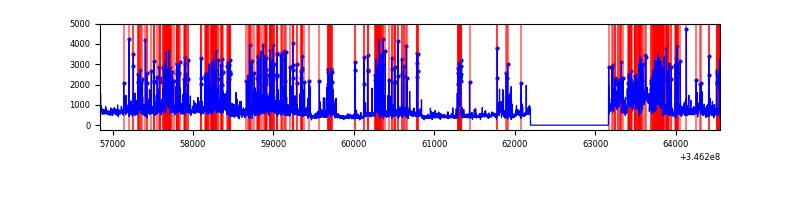 |
Top three noisy pixels from each quadrant. If the there are fewer than three noisy pixels in the level2.evt file, extra rows are filled as -1
| Pixel properties | Quadrant properties | ||||||
|---|---|---|---|---|---|---|---|
| Quadrant | DetID | PixID | Counts | Sigma | Mean | Median | Sigma |
| A | 15 | 174 | 721064 | 4420.78 | 810 | 793 | 162.9 |
| A | 13 | 254 | 11081 | 63.14 | 810 | 793 | 162.9 |
| A | 3 | 137 | 7750 | 42.7 | 810 | 793 | 162.9 |
| B | 10 | 245 | 32158 | 199.9 | 820 | 798 | 156.9 |
| B | 4 | 200 | 29500 | 182.96 | 820 | 798 | 156.9 |
| B | 0 | 244 | 19572 | 119.67 | 820 | 798 | 156.9 |
| C | 14 | 238 | 126662 | 678.35 | 793 | 797 | 185.5 |
| C | 3 | 233 | 91464 | 488.65 | 793 | 797 | 185.5 |
| C | 13 | 61 | 5639 | 26.1 | 793 | 797 | 185.5 |
| D | 1 | 52 | 1376336 | 7412.1 | 773 | 752 | 185.6 |
| D | 8 | 195 | 827180 | 4453.07 | 773 | 752 | 185.6 |
| D | 12 | 250 | 376517 | 2024.75 | 773 | 752 | 185.6 |
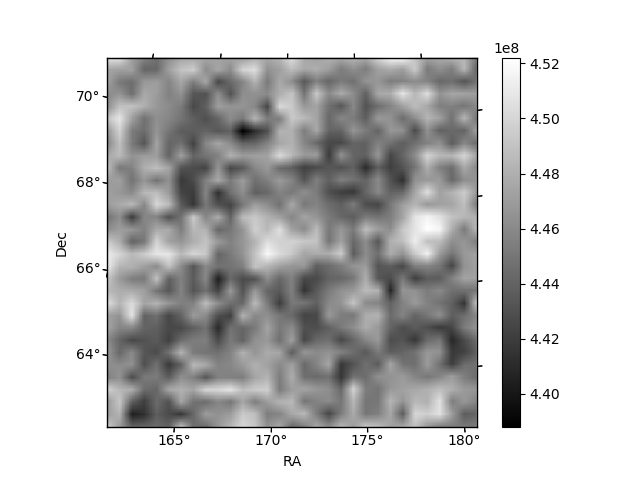
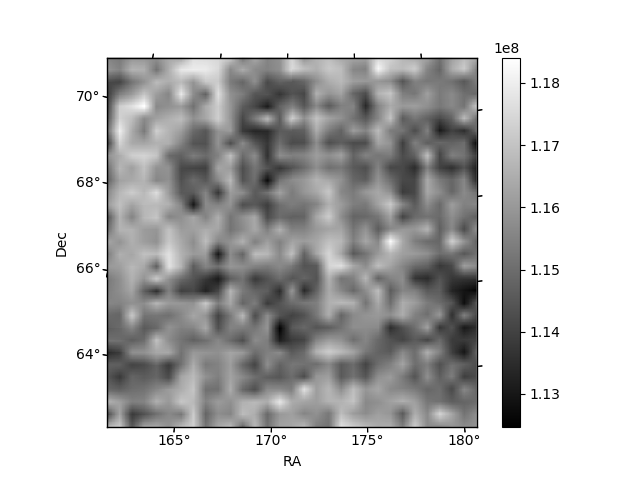
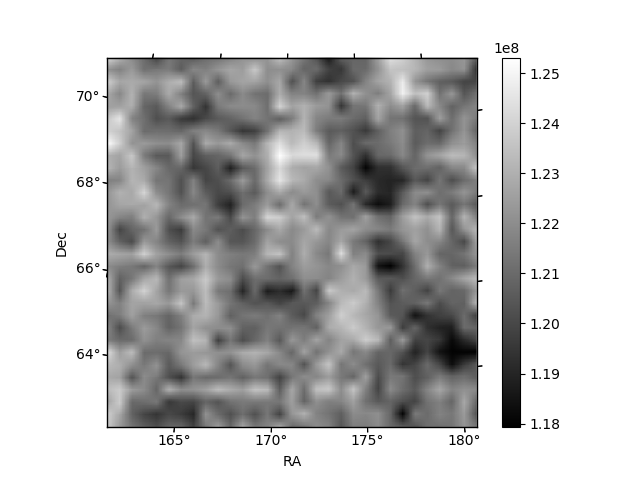
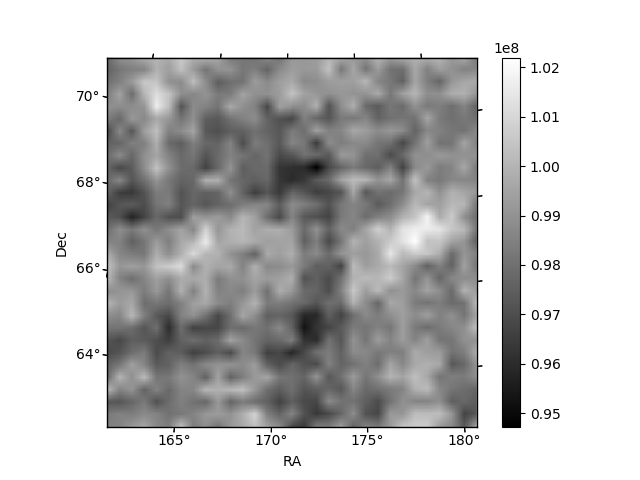
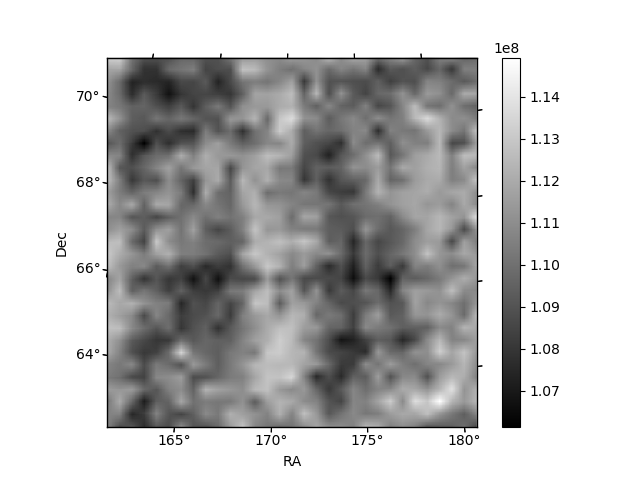
Histogram calculated using DETX and DETY for each event in the final _common_clean file
| Quadrant A | 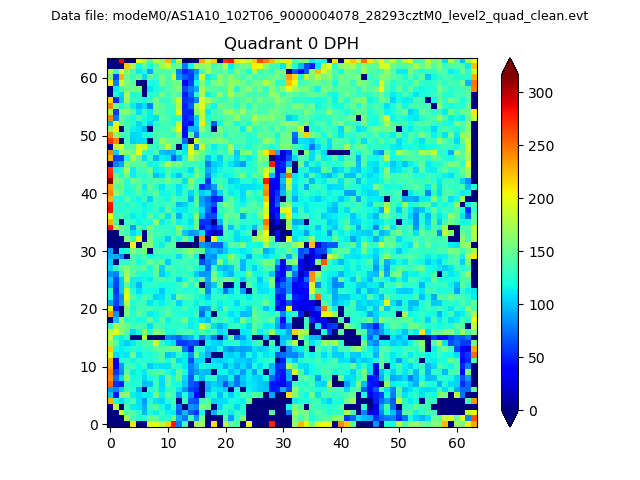 |
 |
Quadrant B |
|---|---|---|---|
| Quadrant D | 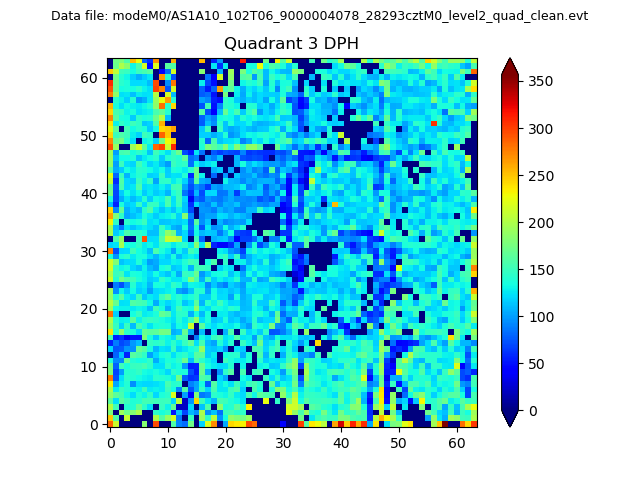 |
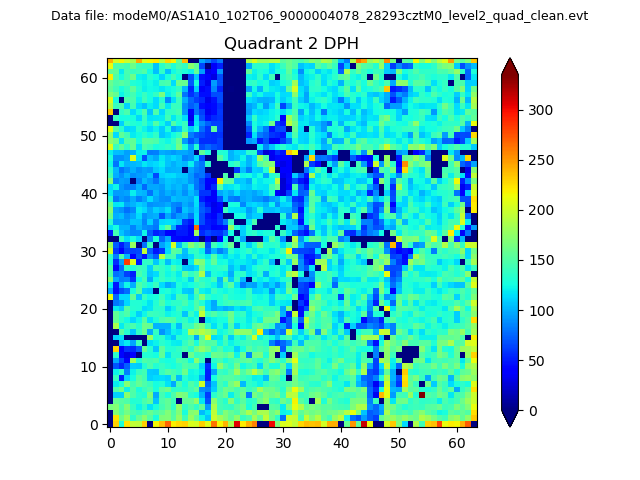 |
Quadrant C |
| Plot type | Count rate plots | Images |
|---|---|---|
| Comparison with Poisson distribution Blue bars denote a histogram of data divided into 1 sec bins. Red curve is a Poisson curve with rate = median count rate of data. |
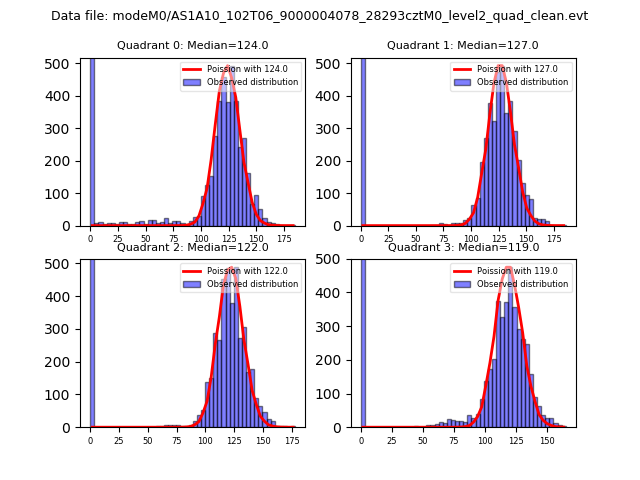 |
 |
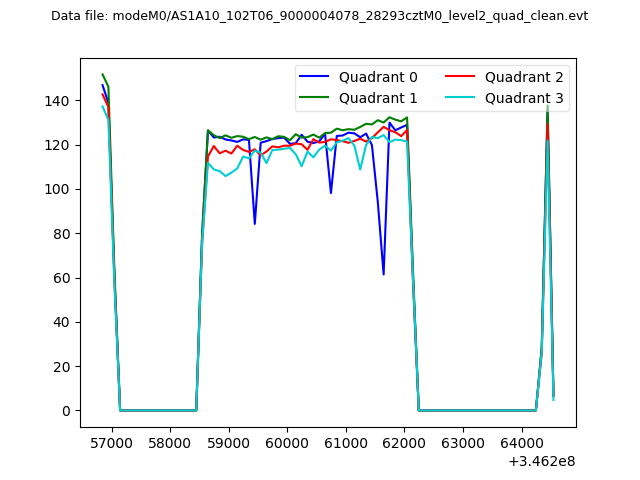
| Quadrant-wise count rates Data is divided into 100 sec bins |
 |
|
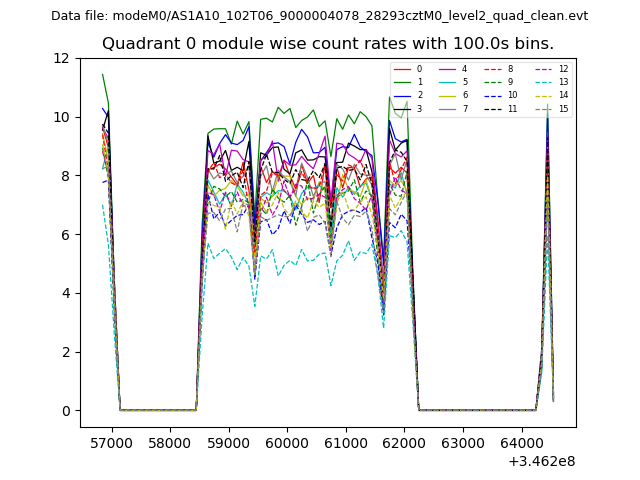
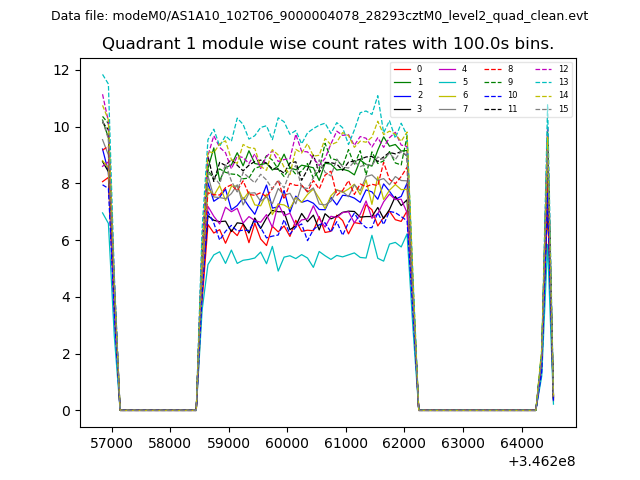
| Module-wise count rates for Quadrant A Data is divided into 100 sec bins |
 |
 |
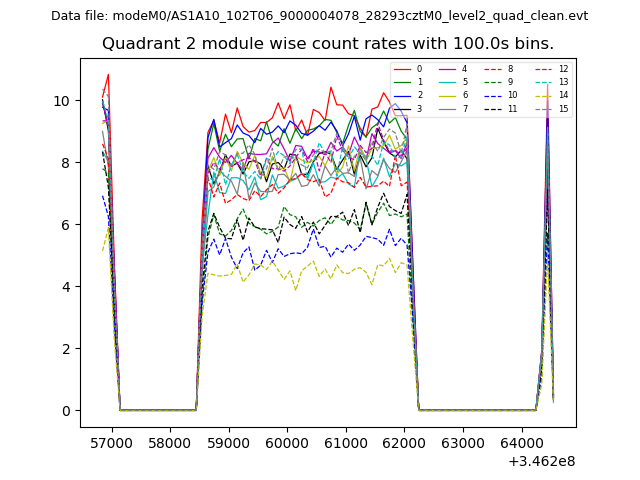
| Module-wise count rates for Quadrant B Data is divided into 100 sec bins |
 |
 |
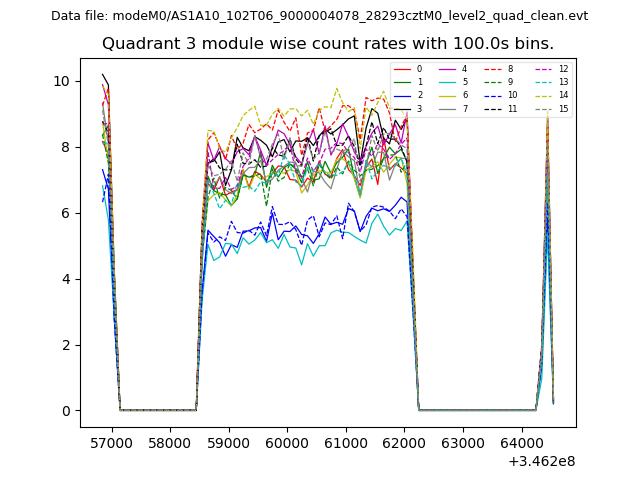
| Module-wise count rates for Quadrant C Data is divided into 100 sec bins |
 |
 |
| Module-wise count rates for Quadrant D Data is divided into 100 sec bins |
 |
 |
| Parameter | Plot |
|---|---|
| CZT HV Monitor | 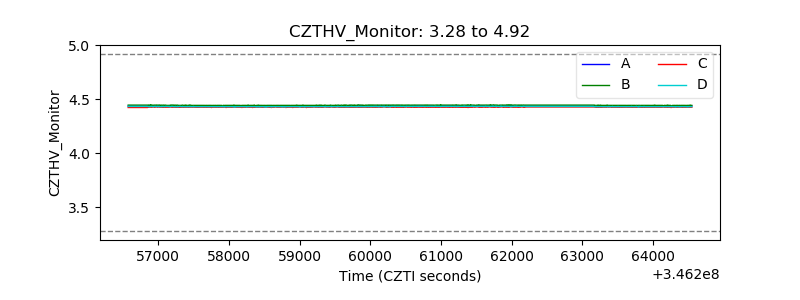 |
| D_VDD | 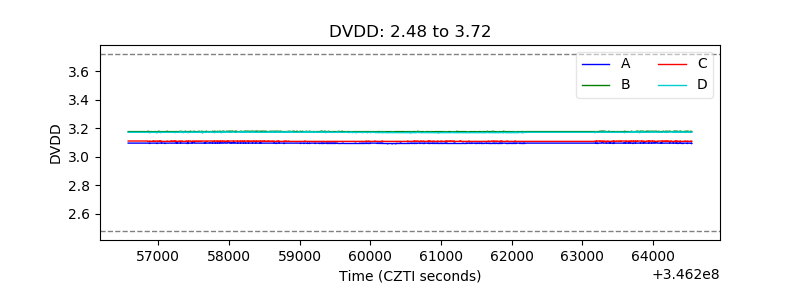 |
| Temperature 1 |  |
| Veto HV Monitor | 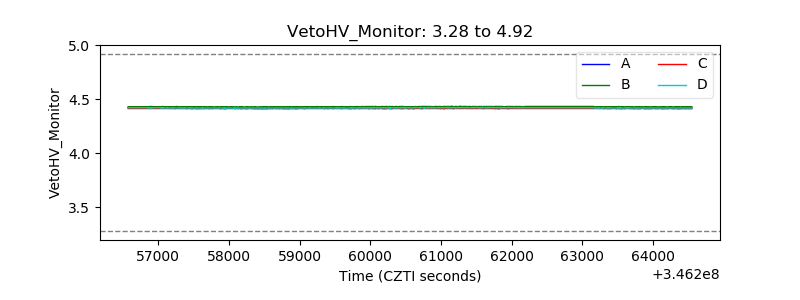 |
| Veto LLD | 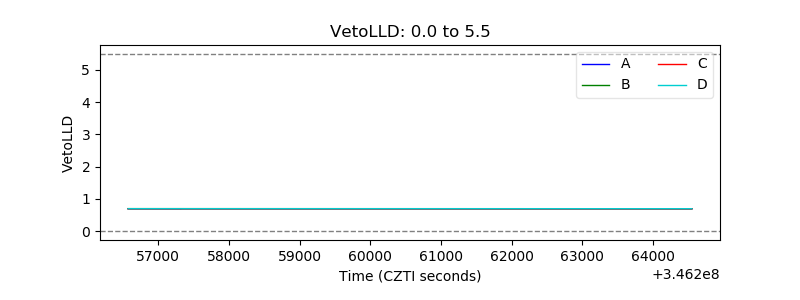 |
| Alpha Counter | 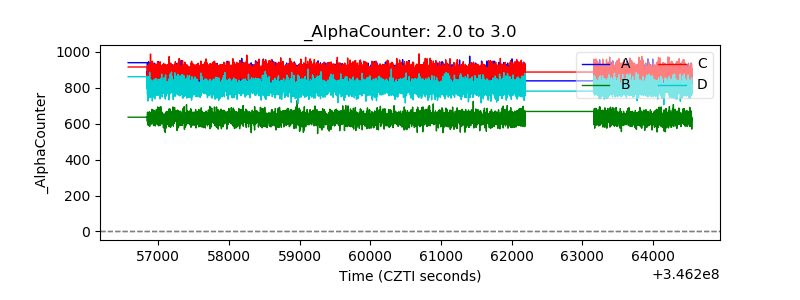 |
| _CPM_Rate | 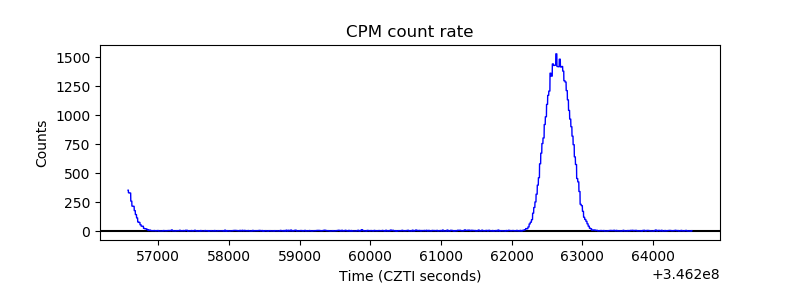 |
| CZT Counter | 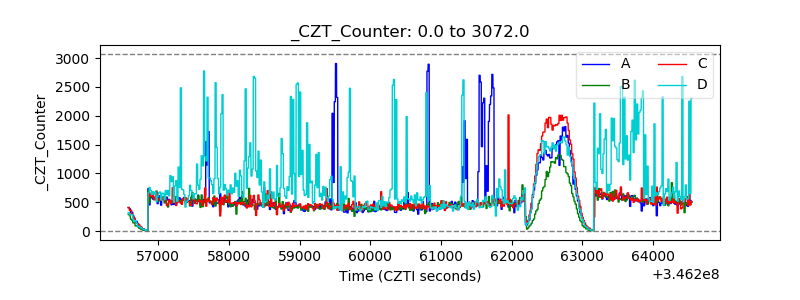 |
| +2.5 Volts monitor | 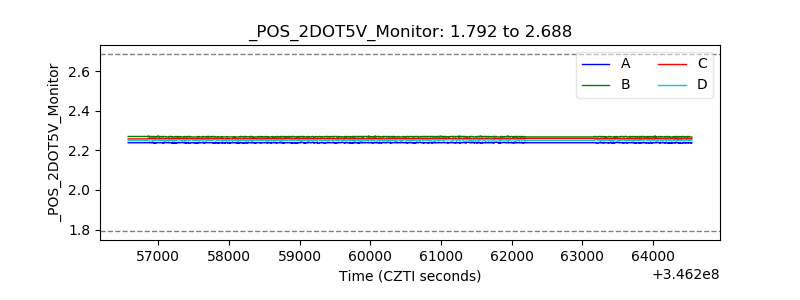 |
| +5 Volts monitor | 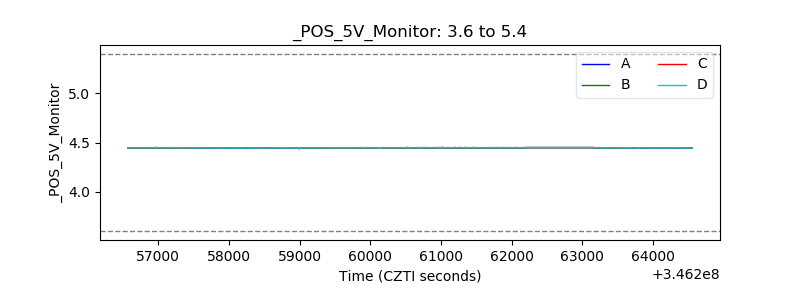 |
| _ROLL_ROT | 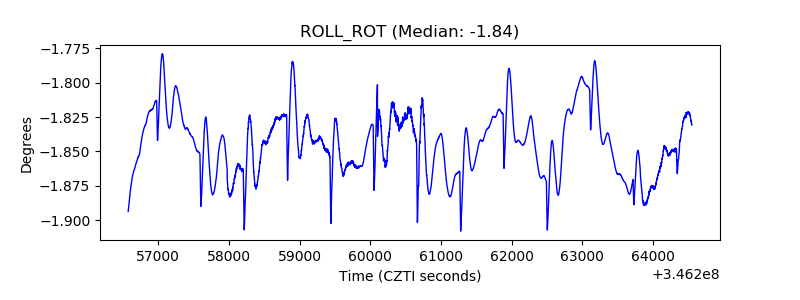 |
| _Roll_DEC | 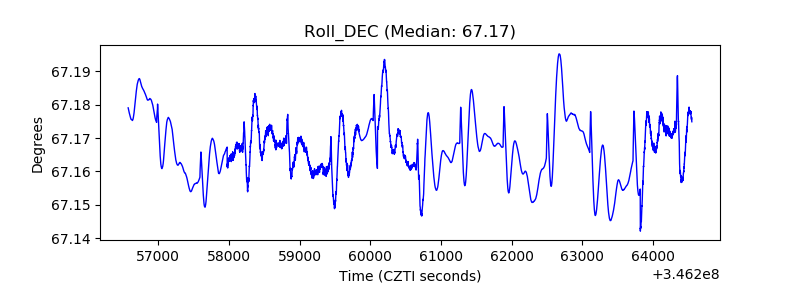 |
| _Roll_RA | 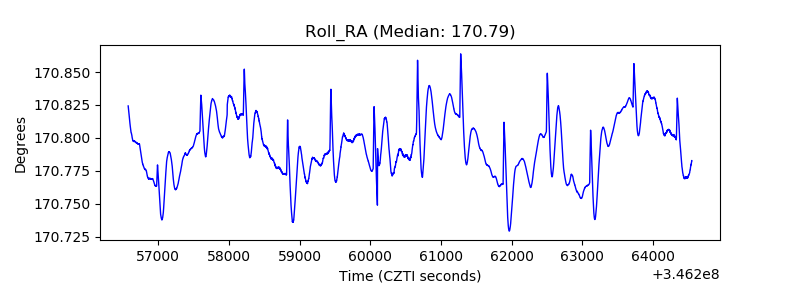 |
| Veto Counter | 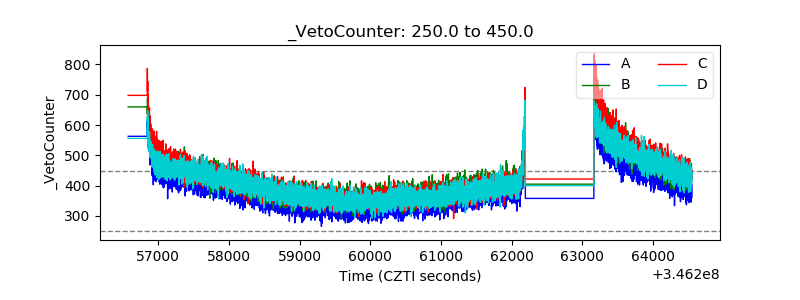 |