| Param | Original file | Final file |
|---|---|---|
| Filename | modeM0/AS1A10_102T06_9000004078_28294cztM0_level2.evt | modeM0/AS1A10_102T06_9000004078_28294cztM0_level2_quad_clean.evt |
| Size (bytes) | 525,257,280 | 90,106,560 |
| Size | 500.9 MB | 85.9 MB |
| Events in quadrant A | 3,212,835 | 578,998 |
| Events in quadrant B | 3,391,926 | 586,148 |
| Events in quadrant C | 3,369,515 | 566,211 |
| Events in quadrant D | 5,489,402 | 541,063 |
| Mode M9 | |||
|---|---|---|---|
| Quadrant | BADHDUFLAG | Total packets | Discarded packets |
| A | 0 | 15 | 0 |
| B | 0 | 16 | 0 |
| C | 0 | 16 | 0 |
| D | 0 | 16 | 0 |
| Mode M0 | |||
|---|---|---|---|
| Quadrant | BADHDUFLAG | Total packets | Discarded packets |
| A | 0 | 13988 | 0 |
| B | 0 | 14507 | 0 |
| C | 0 | 14446 | 0 |
| D | 0 | 20870 | 0 |
| Quadrant | Total seconds | Saturated seconds | Saturation percentage |
|---|---|---|---|
| A | 6538 | 46 | 0.703579% |
| B | 6538 | 86 | 1.315387% |
| C | 6538 | 112 | 1.713062% |
| D | 6538 | 546 | 8.351178% |
Noise dominated data is calculated using 1-second bins in cleaned event files. If a bin has >2000 counts, and if more than 50% of those come from <1% of pixels, then it is considered to be noise-dominated and hence unusable.
| Quadrant | # 1 sec bins | Bins with >0 counts | Bins with >2000 counts | High rate bins dominated by noise | Noise dominated (total time) | Noise dominated (detector-on time) | Marked lightcurve |
|---|---|---|---|---|---|---|---|
| A | 7643 | 6539 | 2 | 2 | 0.03% | 0.03% | 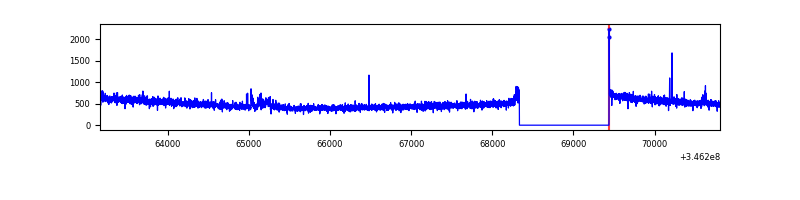 |
| B | 7643 | 6538 | 32 | 32 | 0.42% | 0.49% | 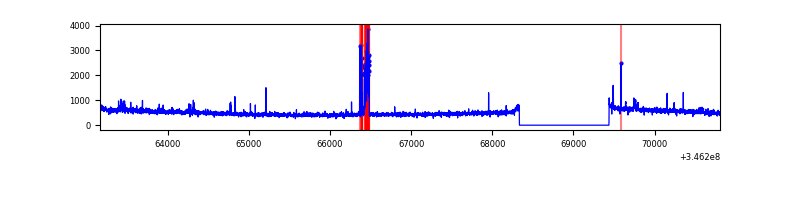 |
| C | 7643 | 6538 | 11 | 11 | 0.14% | 0.17% | 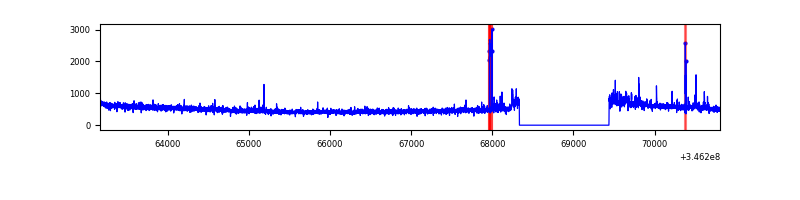 |
| D | 7643 | 6538 | 367 | 367 | 4.80% | 5.61% | 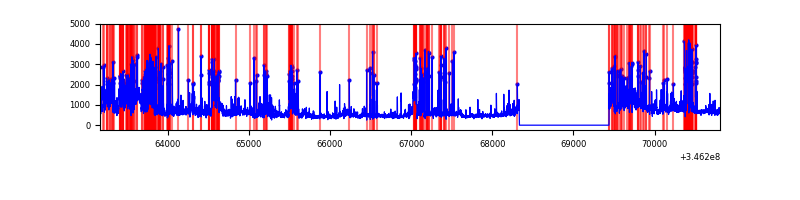 |
Top three noisy pixels from each quadrant. If the there are fewer than three noisy pixels in the level2.evt file, extra rows are filled as -1
| Pixel properties | Quadrant properties | ||||||
|---|---|---|---|---|---|---|---|
| Quadrant | DetID | PixID | Counts | Sigma | Mean | Median | Sigma |
| A | 4 | 2 | 31890 | 189.18 | 819 | 802 | 164.3 |
| A | 15 | 174 | 12770 | 72.83 | 819 | 802 | 164.3 |
| A | 13 | 254 | 11757 | 66.66 | 819 | 802 | 164.3 |
| B | 10 | 245 | 139266 | 896.45 | 818 | 799 | 154.5 |
| B | 12 | 111 | 18106 | 112.05 | 818 | 799 | 154.5 |
| B | 0 | 230 | 16711 | 103.02 | 818 | 799 | 154.5 |
| C | 3 | 233 | 131974 | 698.89 | 798 | 802 | 187.7 |
| C | 14 | 238 | 129426 | 685.32 | 798 | 802 | 187.7 |
| C | 13 | 61 | 5621 | 25.68 | 798 | 802 | 187.7 |
| D | 1 | 52 | 1626954 | 8809.44 | 774 | 753 | 184.6 |
| D | 8 | 195 | 351543 | 1900.3 | 774 | 753 | 184.6 |
| D | 12 | 250 | 317097 | 1713.7 | 774 | 753 | 184.6 |
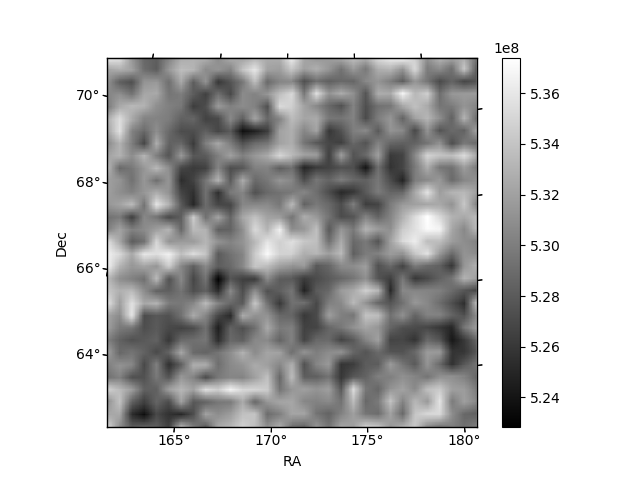
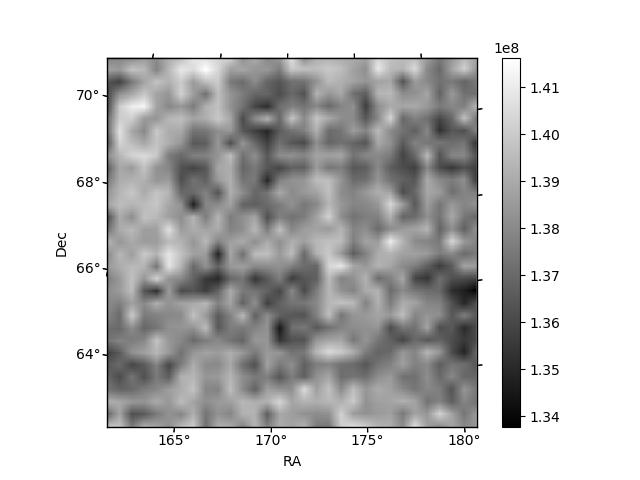
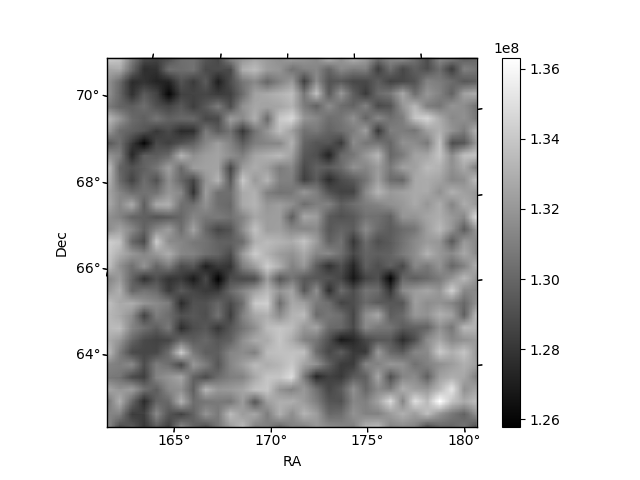
Histogram calculated using DETX and DETY for each event in the final _common_clean file
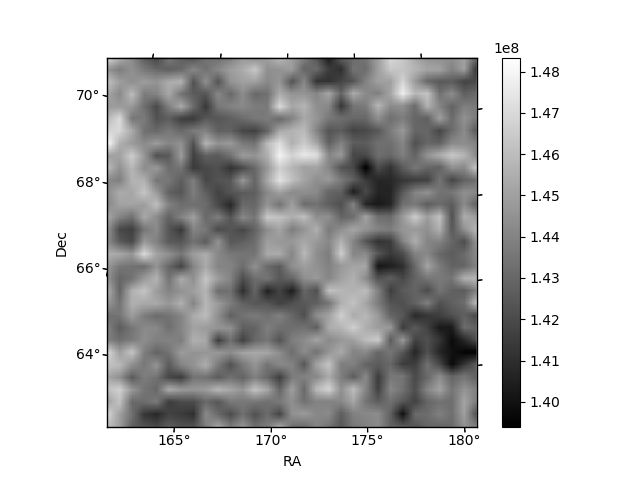
| Quadrant A | 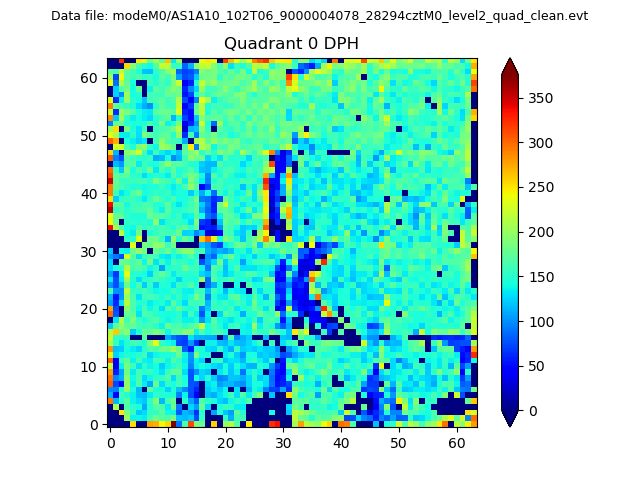 |
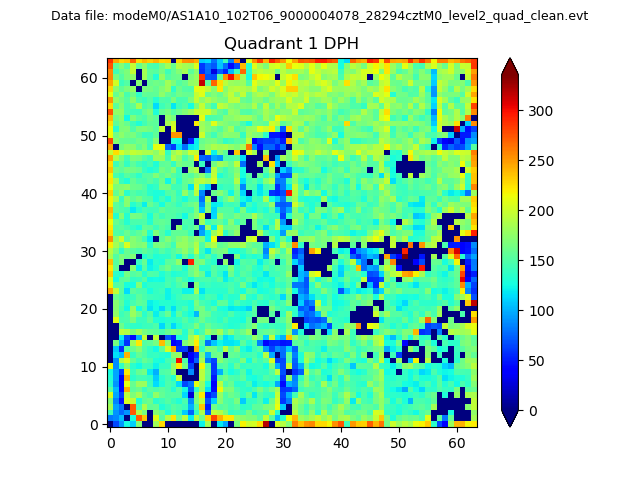 |
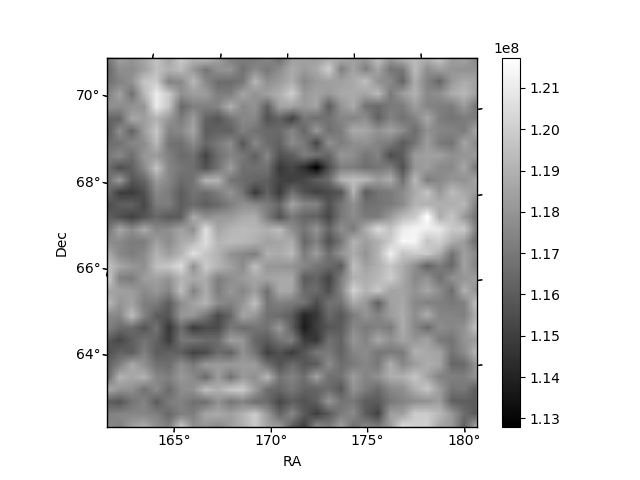
Quadrant B |
|---|---|---|---|
| Quadrant D |  |
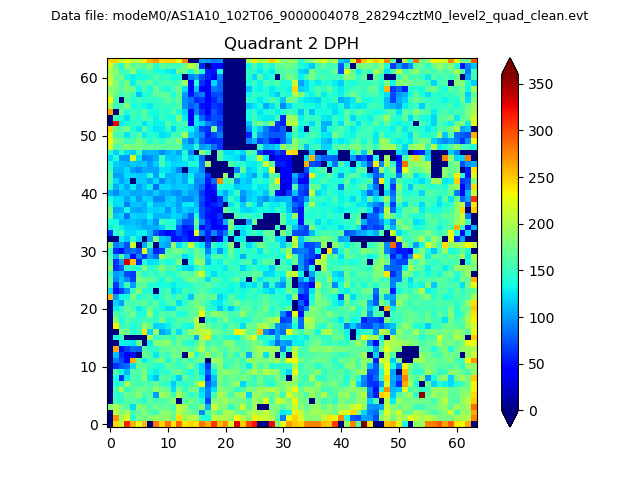 |
Quadrant C |
| Plot type | Count rate plots | Images |
|---|---|---|
| Comparison with Poisson distribution Blue bars denote a histogram of data divided into 1 sec bins. Red curve is a Poisson curve with rate = median count rate of data. |
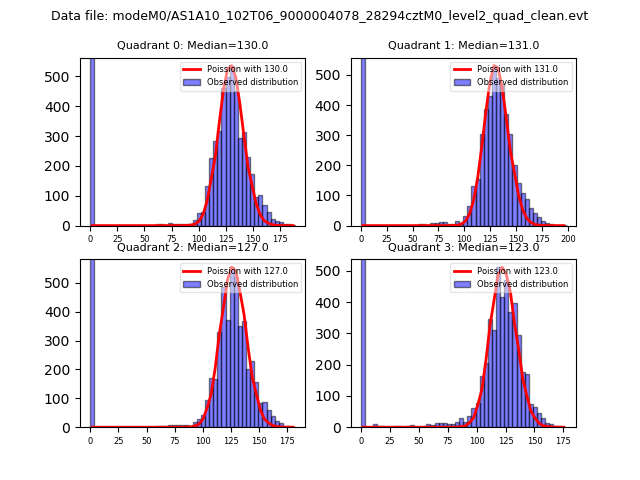 |
 |
| Quadrant-wise count rates Data is divided into 100 sec bins |
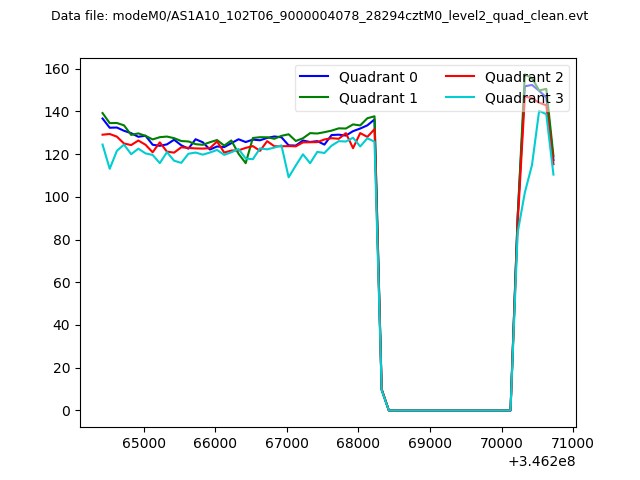 |
|
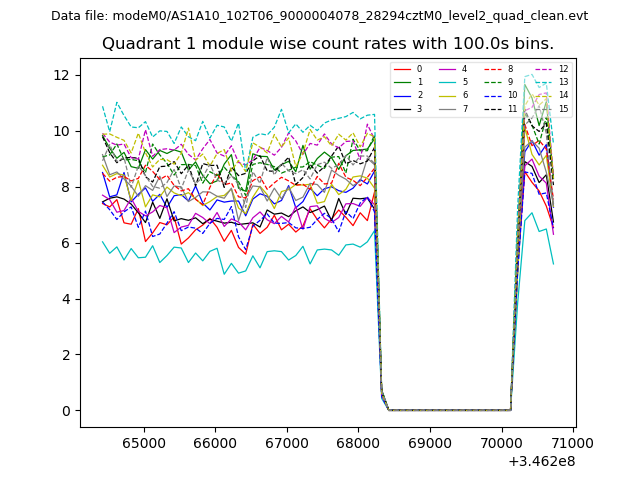
| Module-wise count rates for Quadrant A Data is divided into 100 sec bins |
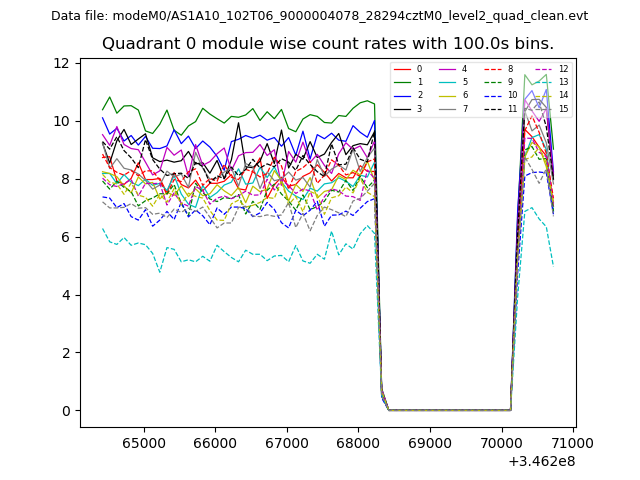 |
 |
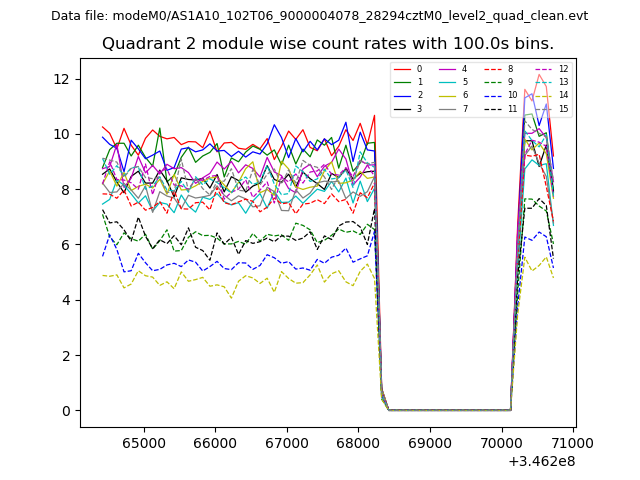
| Module-wise count rates for Quadrant B Data is divided into 100 sec bins |
 |
 |
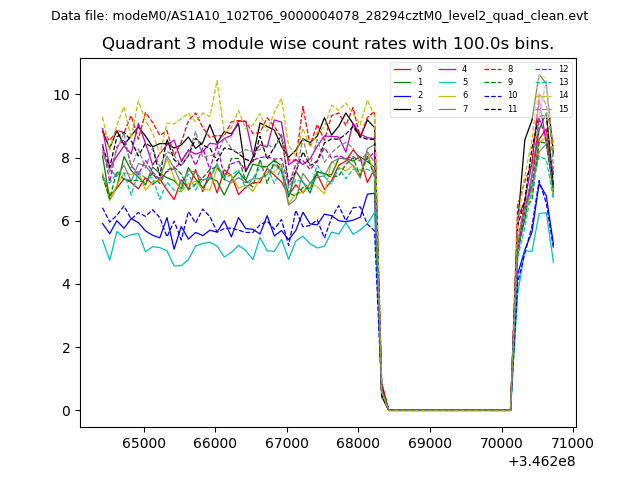
| Module-wise count rates for Quadrant C Data is divided into 100 sec bins |
 |
 |
| Module-wise count rates for Quadrant D Data is divided into 100 sec bins |
 |
 |
| Parameter | Plot |
|---|---|
| CZT HV Monitor | 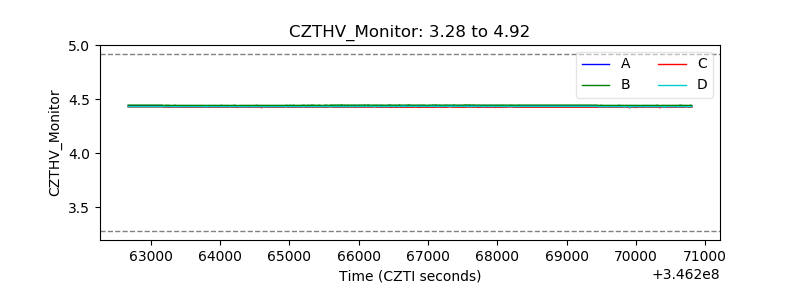 |
| D_VDD | 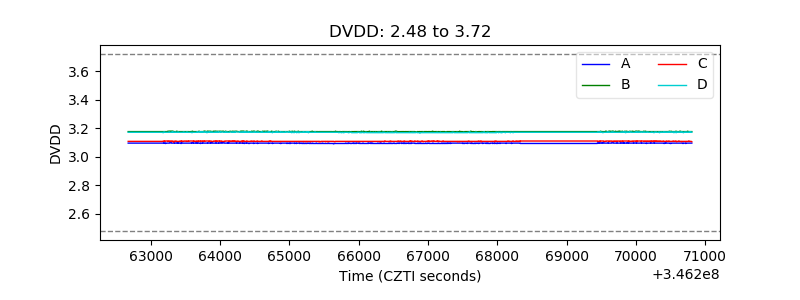 |
| Temperature 1 | 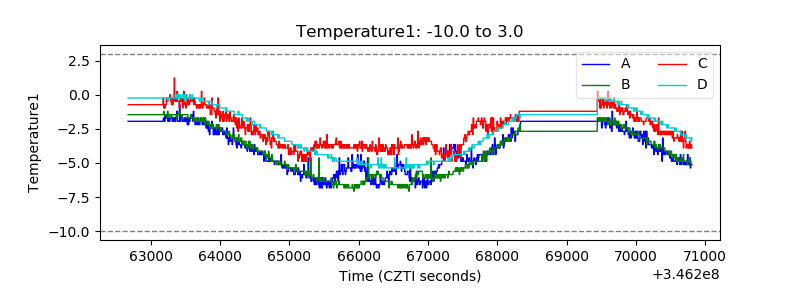 |
| Veto HV Monitor | 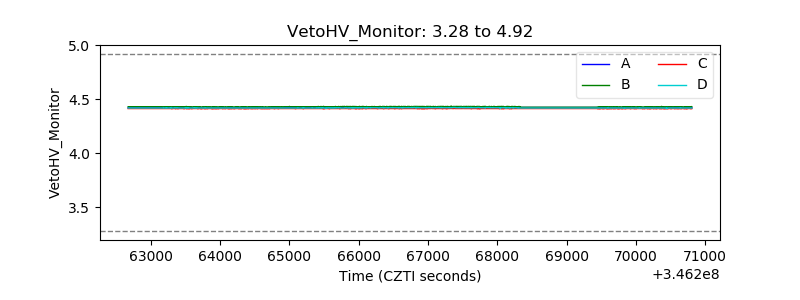 |
| Veto LLD | 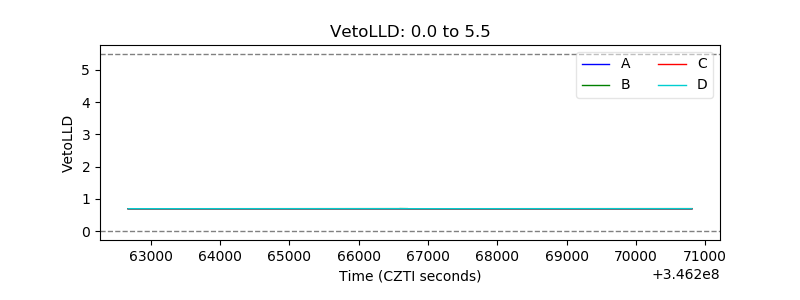 |
| Alpha Counter | 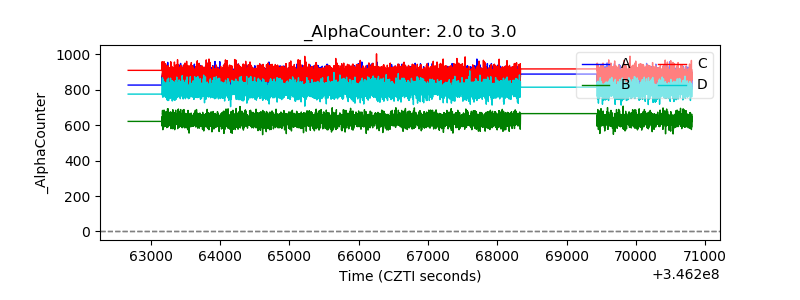 |
| _CPM_Rate | 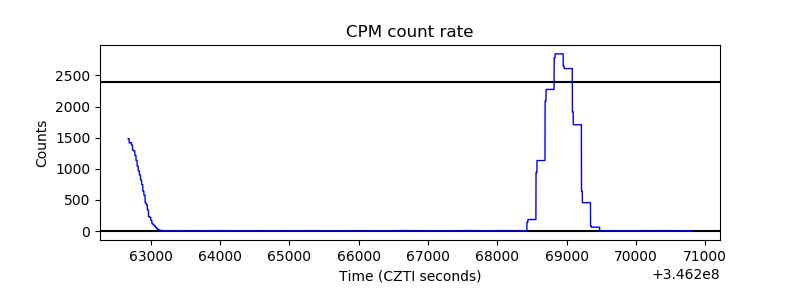 |
| CZT Counter |  |
| +2.5 Volts monitor |  |
| +5 Volts monitor |  |
| _ROLL_ROT | 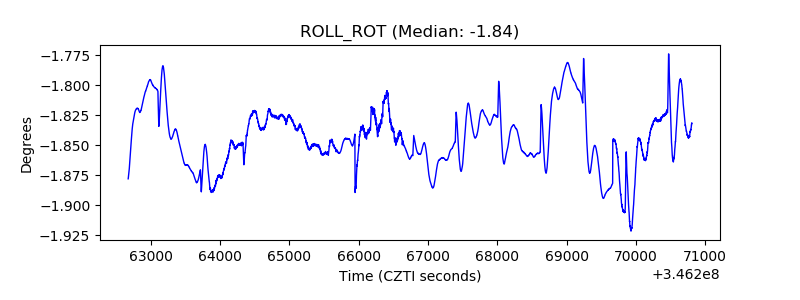 |
| _Roll_DEC | 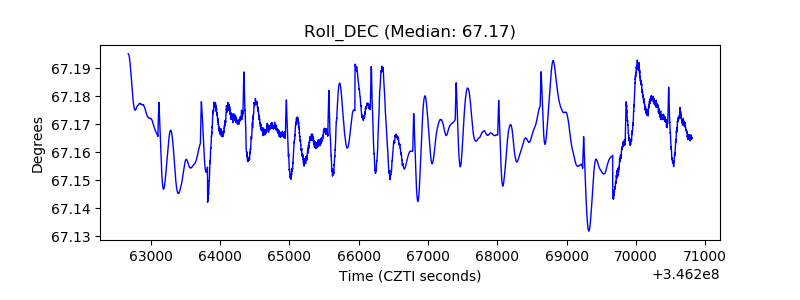 |
| _Roll_RA |  |
| Veto Counter | 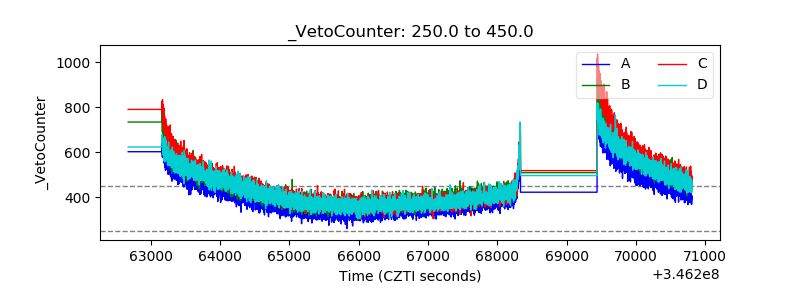 |