| Param | Original file | Final file |
|---|---|---|
| Filename | modeM0/AS1A10_102T06_9000004078_28296cztM0_level2.evt | modeM0/AS1A10_102T06_9000004078_28296cztM0_level2_quad_clean.evt |
| Size (bytes) | 151,191,360 | 18,645,120 |
| Size | 144.2 MB | 17.8 MB |
| Events in quadrant A | 902,030 | 114,698 |
| Events in quadrant B | 954,187 | 117,002 |
| Events in quadrant C | 1,025,975 | 111,618 |
| Events in quadrant D | 1,584,874 | 101,888 |
| Mode M9 | |||
|---|---|---|---|
| Quadrant | BADHDUFLAG | Total packets | Discarded packets |
| A | 0 | 5 | 0 |
| B | 0 | 6 | 0 |
| C | 0 | 6 | 0 |
| D | 0 | 6 | 0 |
| Mode M0 | |||
|---|---|---|---|
| Quadrant | BADHDUFLAG | Total packets | Discarded packets |
| A | 0 | 3714 | 0 |
| B | 0 | 3910 | 0 |
| C | 0 | 4158 | 0 |
| D | 0 | 5942 | 0 |
| Quadrant | Total seconds | Saturated seconds | Saturation percentage |
|---|---|---|---|
| A | 1612 | 8 | 0.496278% |
| B | 1612 | 15 | 0.930521% |
| C | 1612 | 47 | 2.915633% |
| D | 1612 | 153 | 9.491315% |
Noise dominated data is calculated using 1-second bins in cleaned event files. If a bin has >2000 counts, and if more than 50% of those come from <1% of pixels, then it is considered to be noise-dominated and hence unusable.
| Quadrant | # 1 sec bins | Bins with >0 counts | Bins with >2000 counts | High rate bins dominated by noise | Noise dominated (total time) | Noise dominated (detector-on time) | Marked lightcurve |
|---|---|---|---|---|---|---|---|
| A | 1612 | 1612 | 2 | 2 | 0.12% | 0.12% | 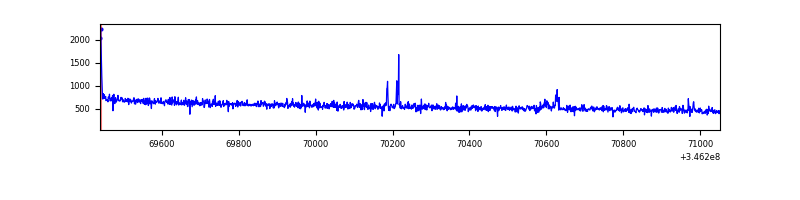 |
| B | 1612 | 1612 | 5 | 5 | 0.31% | 0.31% | 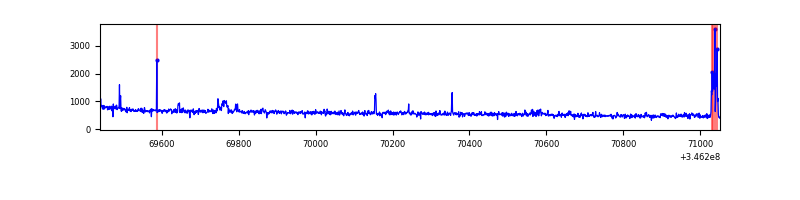 |
| C | 1612 | 1612 | 2 | 2 | 0.12% | 0.12% | 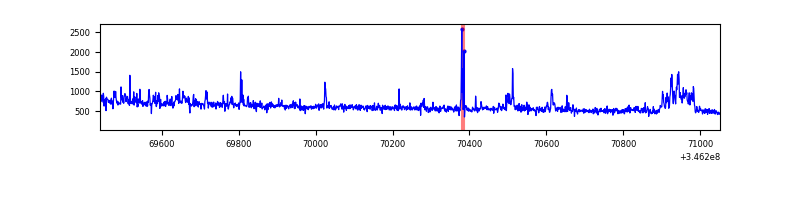 |
| D | 1612 | 1612 | 108 | 108 | 6.70% | 6.70% | 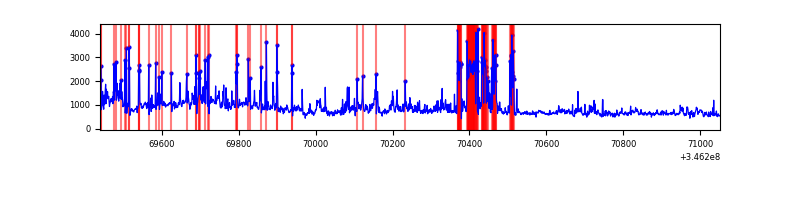 |
Top three noisy pixels from each quadrant. If the there are fewer than three noisy pixels in the level2.evt file, extra rows are filled as -1
| Pixel properties | Quadrant properties | ||||||
|---|---|---|---|---|---|---|---|
| Quadrant | DetID | PixID | Counts | Sigma | Mean | Median | Sigma |
| A | 15 | 174 | 13734 | 283.16 | 228 | 223 | 47.7 |
| A | 8 | 192 | 6863 | 139.16 | 228 | 223 | 47.7 |
| A | 13 | 254 | 3393 | 66.44 | 228 | 223 | 47.7 |
| B | 10 | 245 | 28262 | 623.61 | 229 | 223 | 45.0 |
| B | 15 | 32 | 10124 | 220.21 | 229 | 223 | 45.0 |
| B | 5 | 172 | 9004 | 195.3 | 229 | 223 | 45.0 |
| C | 3 | 233 | 101746 | 1848.11 | 227 | 229 | 54.9 |
| C | 14 | 238 | 37343 | 675.66 | 227 | 229 | 54.9 |
| C | 13 | 61 | 1616 | 25.25 | 227 | 229 | 54.9 |
| D | 1 | 52 | 461672 | 8628.95 | 218 | 211 | 53.5 |
| D | 8 | 195 | 147762 | 2759.09 | 218 | 211 | 53.5 |
| D | 12 | 250 | 80580 | 1502.84 | 218 | 211 | 53.5 |
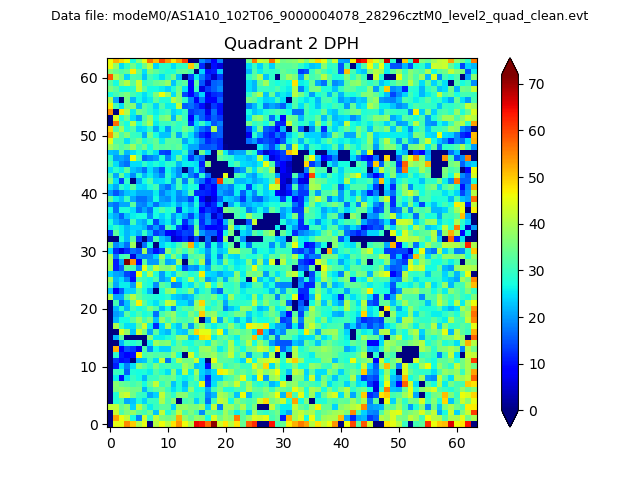
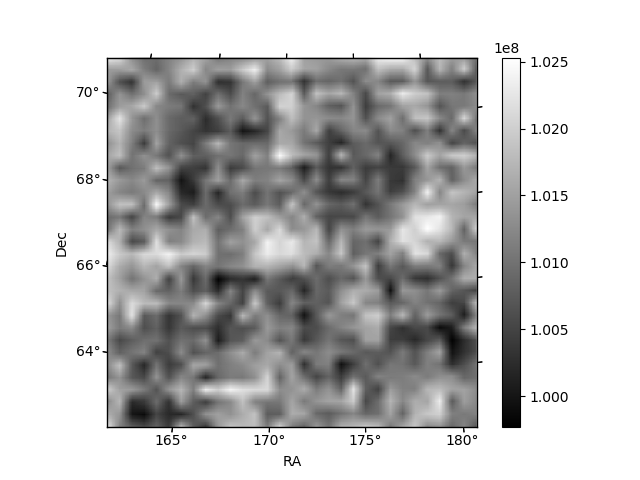
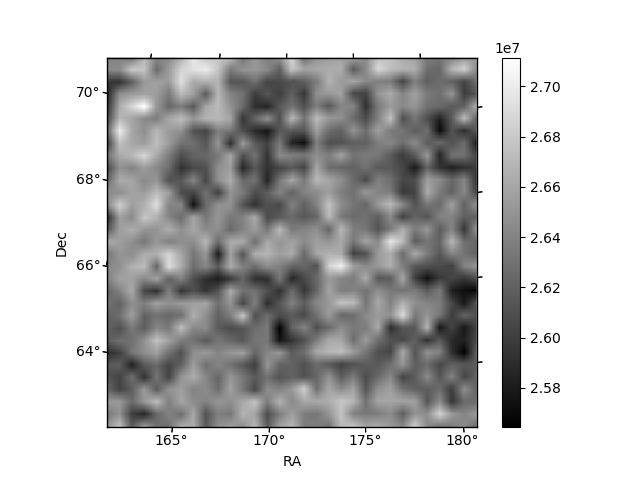
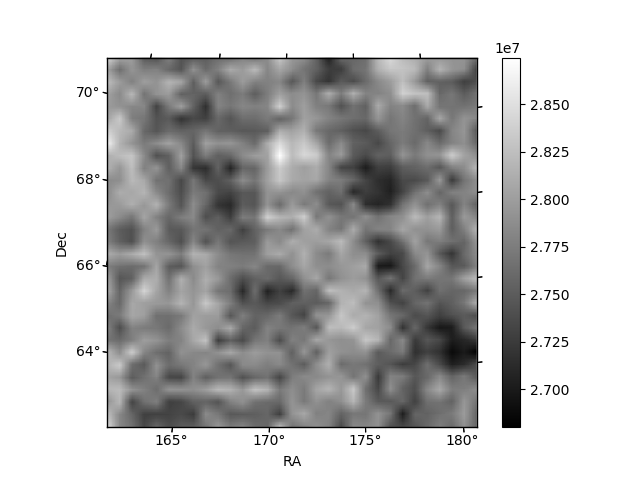
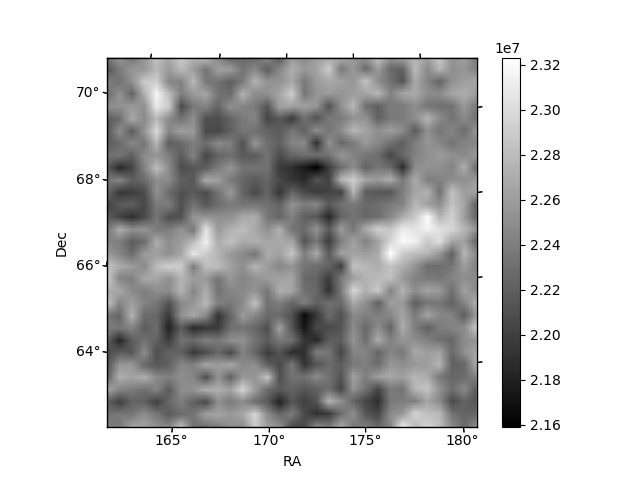
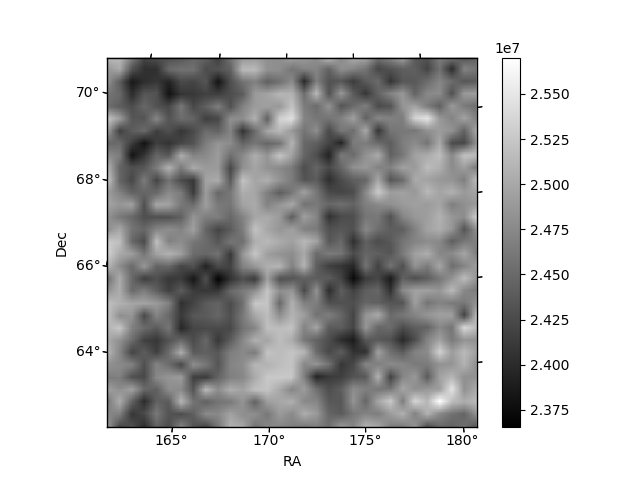
Histogram calculated using DETX and DETY for each event in the final _common_clean file
| Quadrant A | 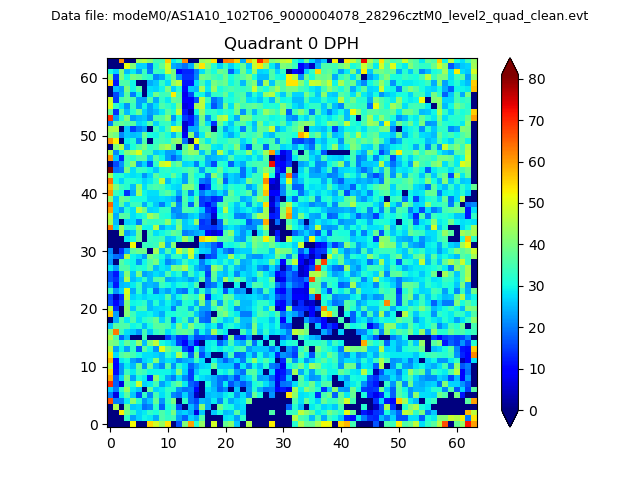 |
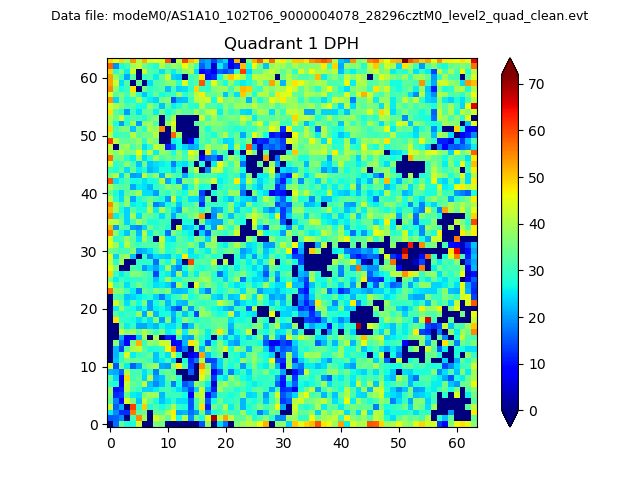 |
Quadrant B |
|---|---|---|---|
| Quadrant D | 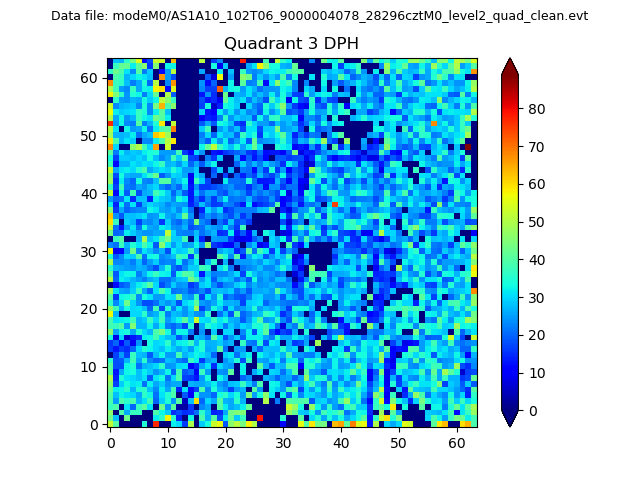 |
 |
Quadrant C |
| Plot type | Count rate plots | Images |
|---|---|---|
| Comparison with Poisson distribution Blue bars denote a histogram of data divided into 1 sec bins. Red curve is a Poisson curve with rate = median count rate of data. |
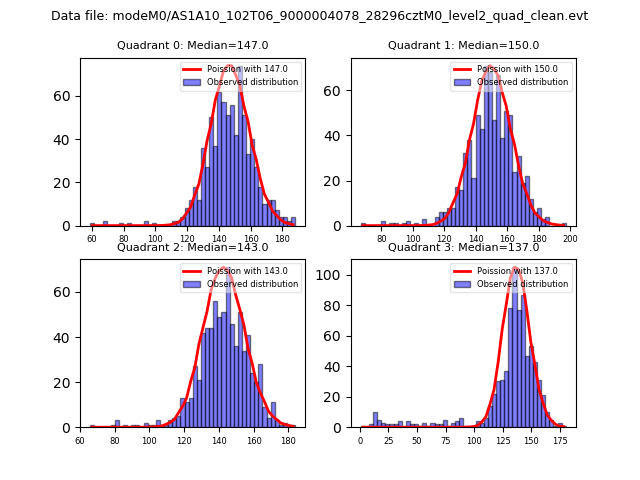 |
 |
| Quadrant-wise count rates Data is divided into 100 sec bins |
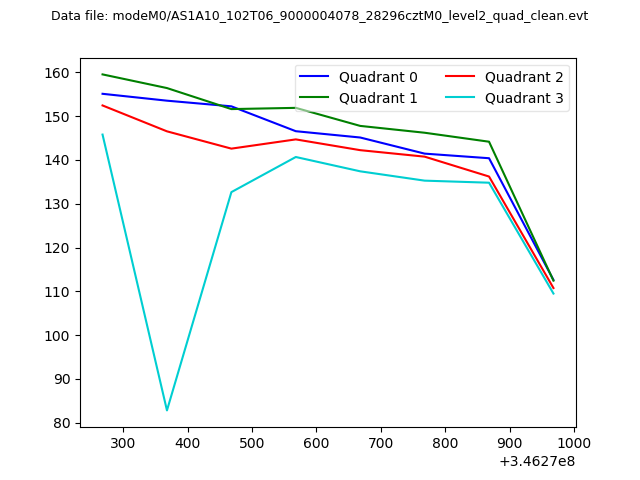 |
|
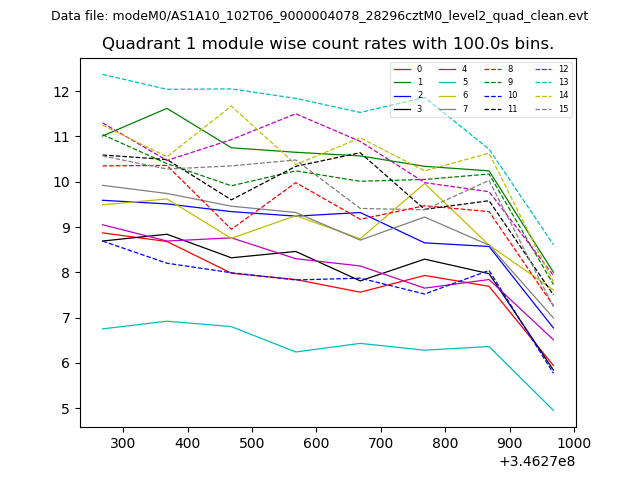
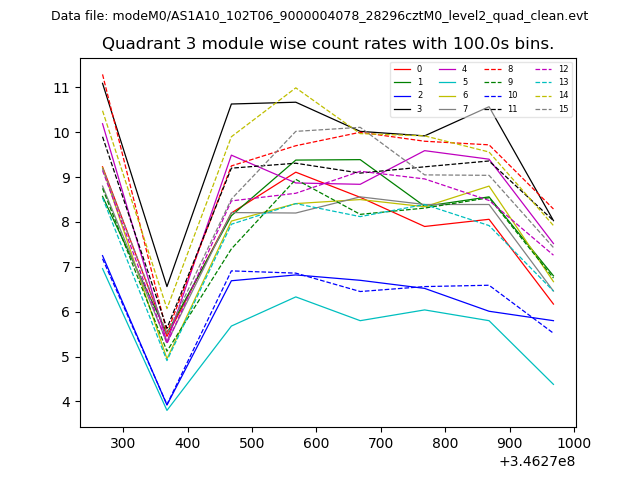
| Module-wise count rates for Quadrant A Data is divided into 100 sec bins |
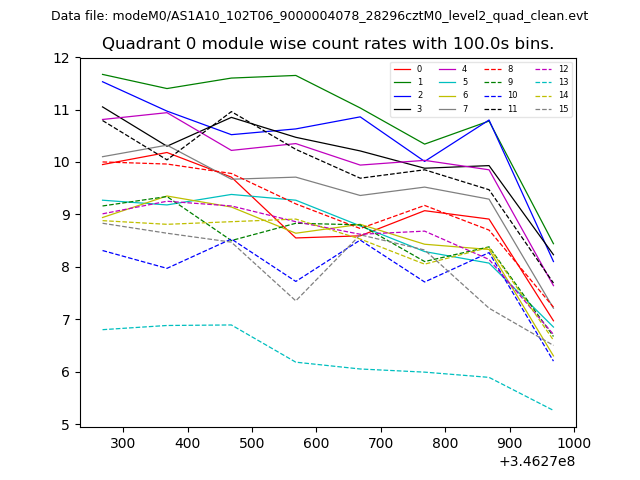 |
 |
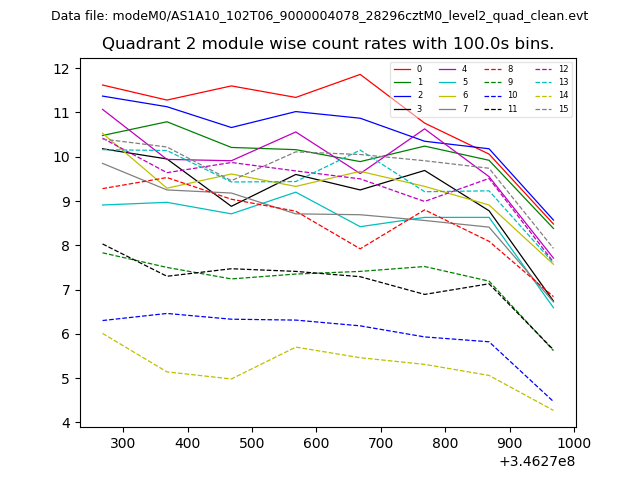
| Module-wise count rates for Quadrant B Data is divided into 100 sec bins |
 |
 |
| Module-wise count rates for Quadrant C Data is divided into 100 sec bins |
 |
 |
| Module-wise count rates for Quadrant D Data is divided into 100 sec bins |
 |
 |
| Parameter | Plot |
|---|---|
| CZT HV Monitor | 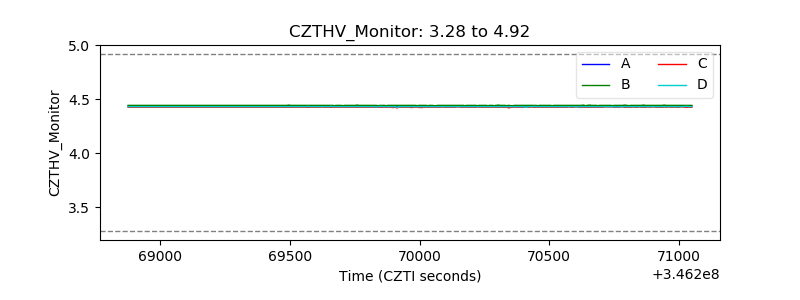 |
| D_VDD | 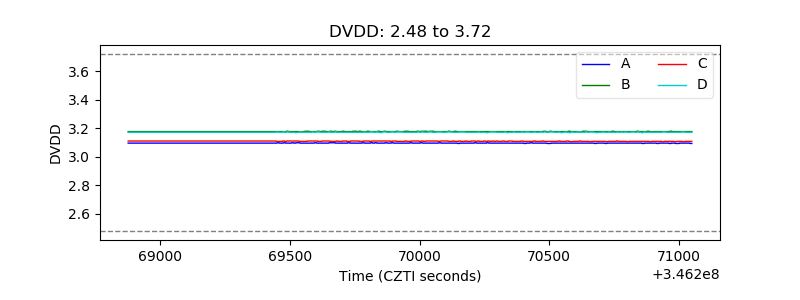 |
| Temperature 1 | 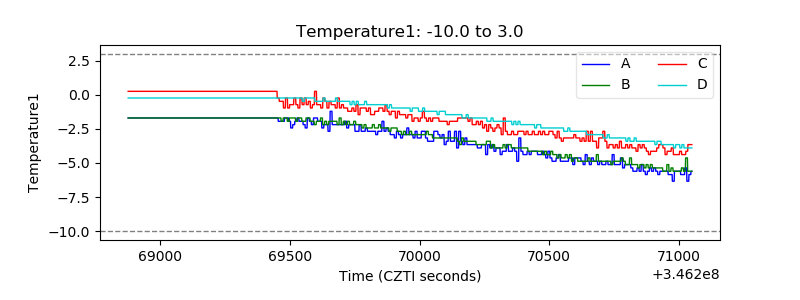 |
| Veto HV Monitor | 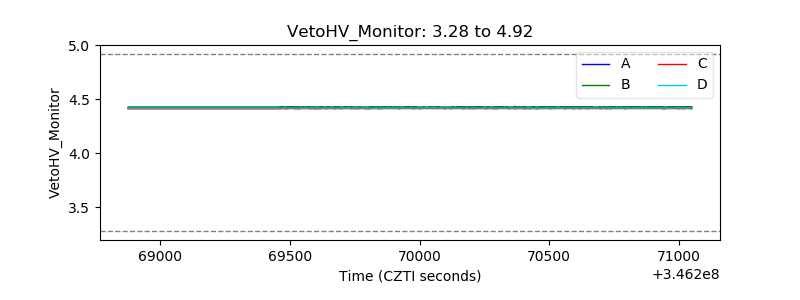 |
| Veto LLD | 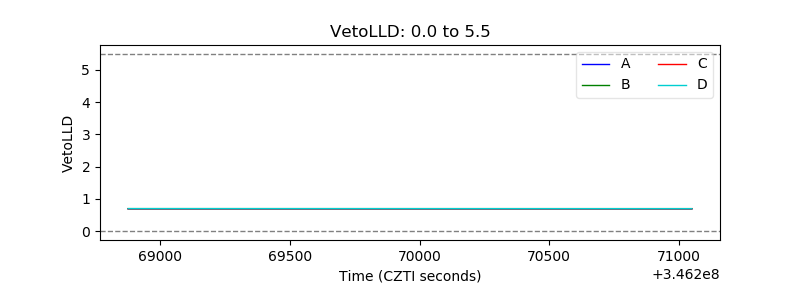 |
| Alpha Counter | 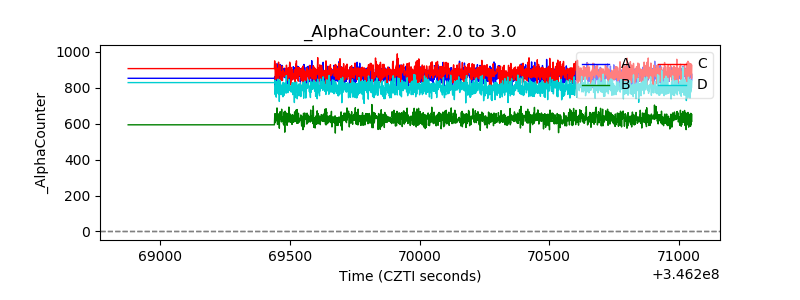 |
| _CPM_Rate | 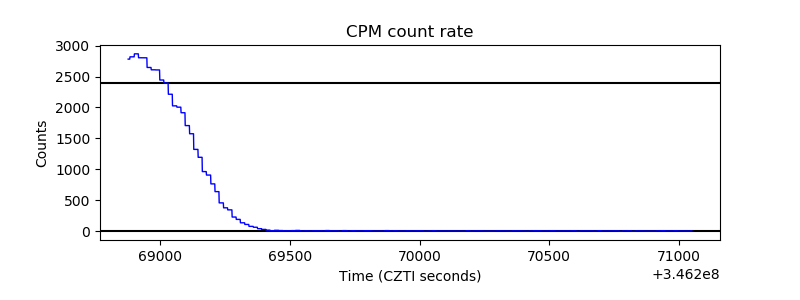 |
| CZT Counter | 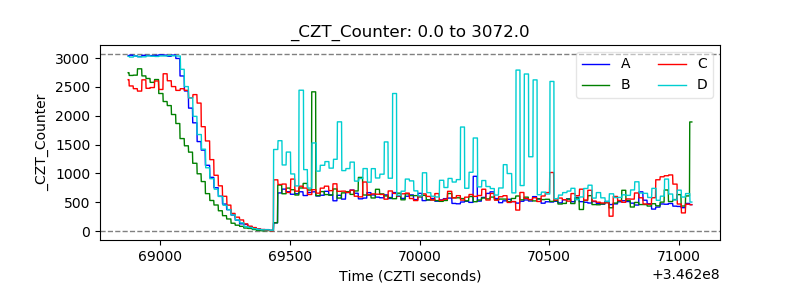 |
| +2.5 Volts monitor |  |
| +5 Volts monitor |  |
| _ROLL_ROT |  |
| _Roll_DEC | 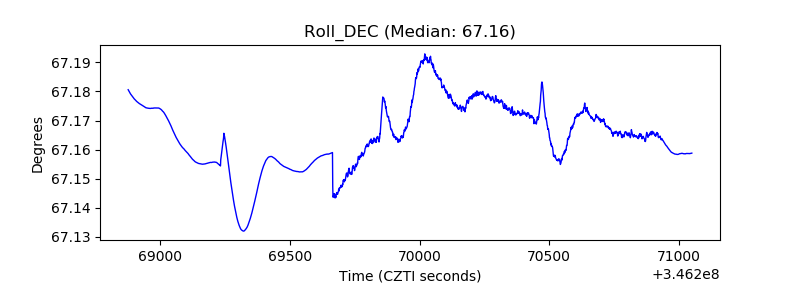 |
| _Roll_RA | 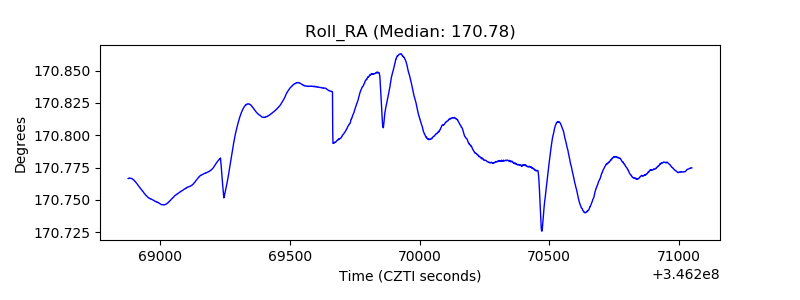 |
| Veto Counter | 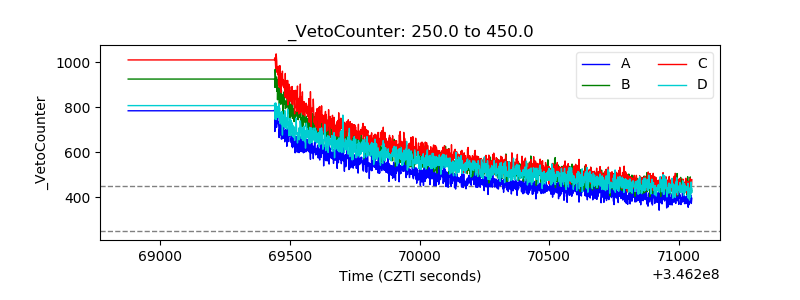 |