| Param | Original file | Final file |
|---|---|---|
| Filename | modeM0/AS1A10_102T10_9000004080cztM0_level2.fits | modeM0/AS1A10_102T10_9000004080cztM0_level2_quad_clean.evt |
| Size (bytes) | 1,300,694,400 | 1,235,592,000 |
| Size | 1.2 GB | 1.2 GB |
| Events in quadrant A | 8,048,996 | 7,431,450 |
| Events in quadrant B | 7,738,682 | 7,446,612 |
| Events in quadrant C | 7,935,298 | 7,189,301 |
| Events in quadrant D | 6,617,394 | 6,305,848 |
| Mode M0 | |||
|---|---|---|---|
| Quadrant | BADHDUFLAG | Total packets | Discarded packets |
| A | 0 | 279549 | 0 |
| B | 0 | 296464 | 0 |
| C | 0 | 276287 | 0 |
| D | 0 | 420928 | 0 |
| Mode M9 | |||
|---|---|---|---|
| Quadrant | BADHDUFLAG | Total packets | Discarded packets |
| A | 0 | 200 | 0 |
| B | 0 | 200 | 0 |
| C | 0 | 200 | 0 |
| D | 0 | 200 | 0 |
| Mode SS | |||
|---|---|---|---|
| Quadrant | BADHDUFLAG | Total packets | Discarded packets |
| A | 0 | 2682 | 0 |
| B | 0 | 2682 | 0 |
| C | 0 | 2682 | 0 |
| D | 0 | 2682 | 0 |
| Quadrant | Total seconds | Saturated seconds | Saturation percentage |
|---|---|---|---|
| A | 132051 | 1804 | 1.366139% |
| B | 132051 | 3080 | 2.332432% |
| C | 132051 | 2183 | 1.653149% |
| D | 132051 | 11152 | 8.445222% |
Noise dominated data is calculated using 1-second bins in cleaned event files. If a bin has >2000 counts, and if more than 50% of those come from <1% of pixels, then it is considered to be noise-dominated and hence unusable.
| Quadrant | # 1 sec bins | Bins with >0 counts | Bins with >2000 counts | High rate bins dominated by noise | Noise dominated (total time) | Noise dominated (detector-on time) | Marked lightcurve |
|---|---|---|---|---|---|---|---|
| A | 151791 | 132044 | 0 | 0 | 0.00% | 0.00% | 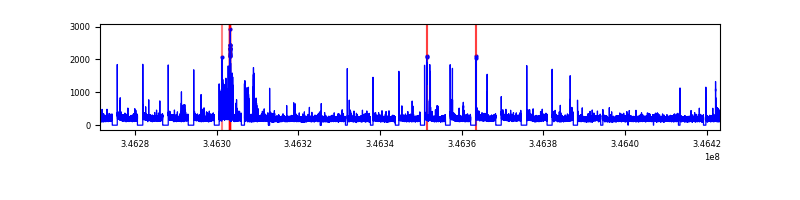 |
| B | 151791 | 132032 | 0 | 0 | 0.00% | 0.00% | 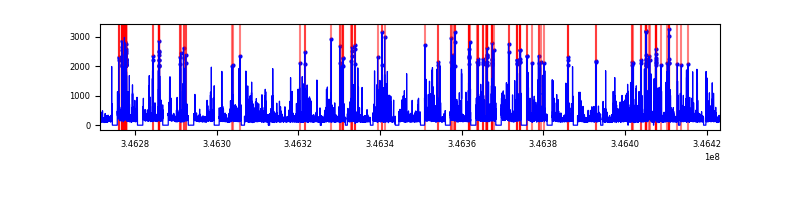 |
| C | 151791 | 132044 | 0 | 0 | 0.00% | 0.00% |  |
| D | 151791 | 131826 | 0 | 0 | 0.00% | 0.00% |  |
Top three noisy pixels from each quadrant. If the there are fewer than three noisy pixels in the level2.evt file, extra rows are filled as -1
| Pixel properties | Quadrant properties | ||||||
|---|---|---|---|---|---|---|---|
| Quadrant | DetID | PixID | Counts | Sigma | Mean | Median | Sigma |
| A | 0 | 29 | 7542 | 10.97 | 2094 | 1975 | 507.3 |
| A | 7 | 110 | 6592 | 9.1 | 2094 | 1975 | 507.3 |
| A | 0 | 30 | 5990 | 7.91 | 2094 | 1975 | 507.3 |
| B | 2 | 9 | 6234 | 10.56 | 2049 | 1956 | 405.3 |
| B | 2 | 8 | 5212 | 8.03 | 2049 | 1956 | 405.3 |
| B | 5 | 128 | 5169 | 7.93 | 2049 | 1956 | 405.3 |
| C | 1 | 80 | 6203 | 8.09 | 2095 | 1971 | 523.2 |
| C | 1 | 81 | 6182 | 8.05 | 2095 | 1971 | 523.2 |
| C | 12 | 241 | 5695 | 7.12 | 2095 | 1971 | 523.2 |
| D | 7 | 3 | 4881 | 6.34 | 1886 | 1717 | 499.3 |
| D | 6 | 231 | 4739 | 6.05 | 1886 | 1717 | 499.3 |
| D | 3 | 14 | 4665 | 5.9 | 1886 | 1717 | 499.3 |
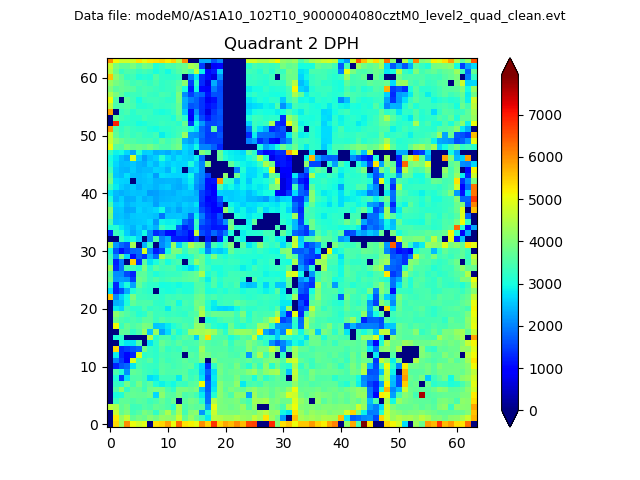
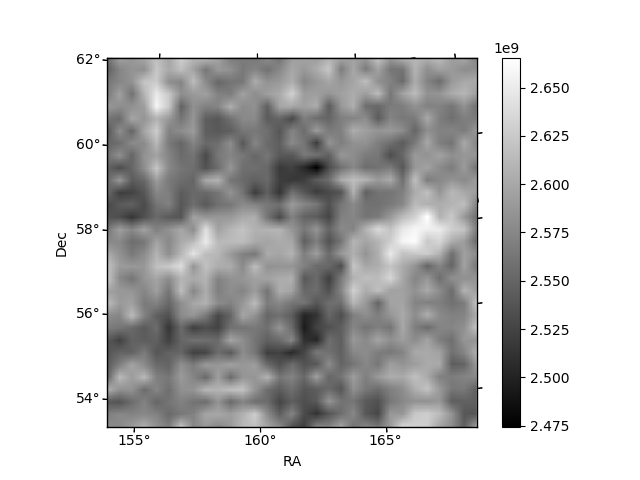
Histogram calculated using DETX and DETY for each event in the final _common_clean file
| Quadrant A | 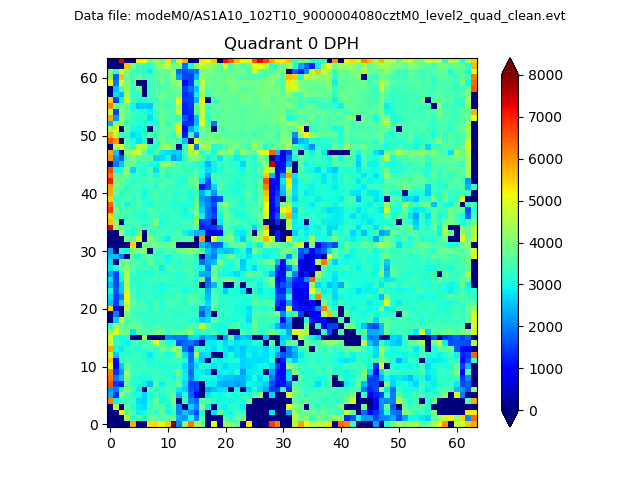 |
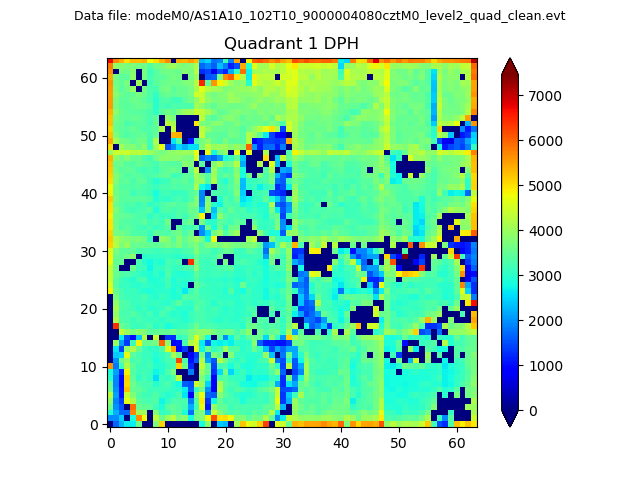 |
Quadrant B |
|---|---|---|---|
| Quadrant D | 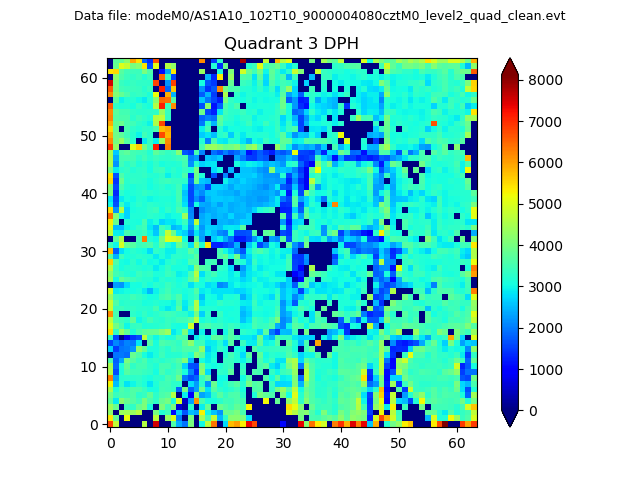 |
 |
Quadrant C |
| Plot type | Count rate plots | Images |
|---|---|---|
| Comparison with Poisson distribution Blue bars denote a histogram of data divided into 1 sec bins. Red curve is a Poisson curve with rate = median count rate of data. |
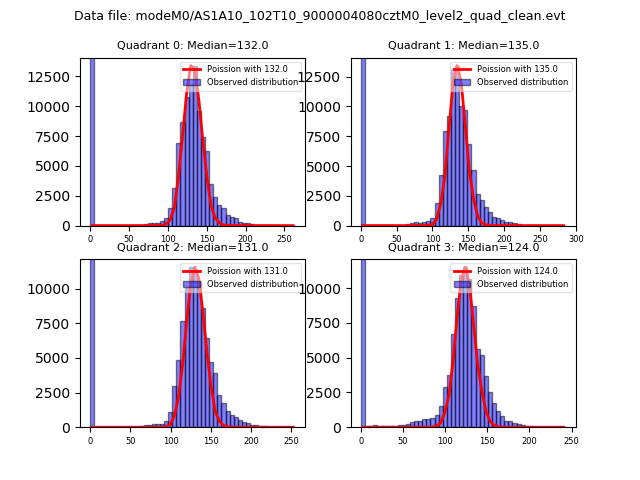 |
 |
| Quadrant-wise count rates Data is divided into 100 sec bins |
 |
|
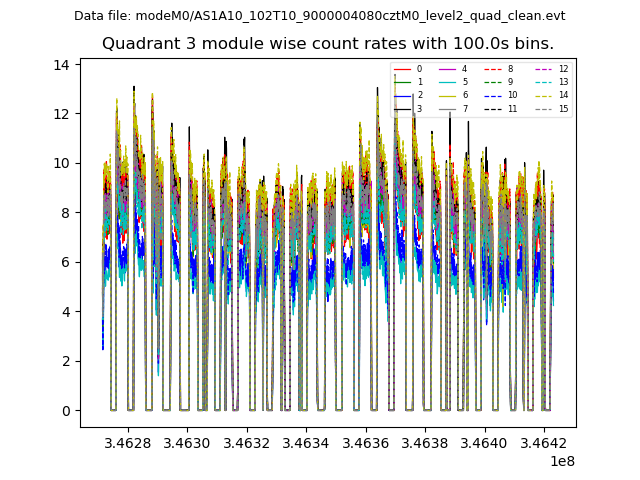
| Module-wise count rates for Quadrant A Data is divided into 100 sec bins |
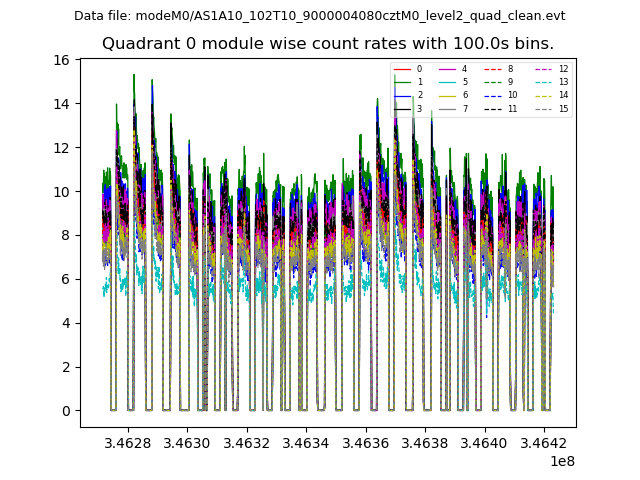 |
 |
| Module-wise count rates for Quadrant B Data is divided into 100 sec bins |
 |
 |
| Module-wise count rates for Quadrant C Data is divided into 100 sec bins |
 |
 |
| Module-wise count rates for Quadrant D Data is divided into 100 sec bins |
 |
 |
| Parameter | Plot |
|---|---|
| CZT HV Monitor |  |
| D_VDD | 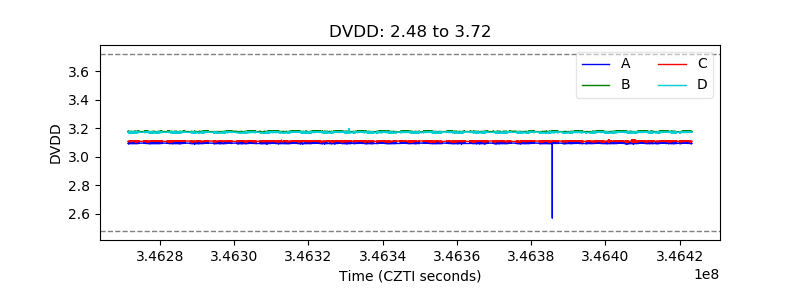 |
| Temperature 1 |  |
| Veto HV Monitor |  |
| Veto LLD |  |
| Alpha Counter |  |
| _CPM_Rate |  |
| CZT Counter |  |
| +2.5 Volts monitor | 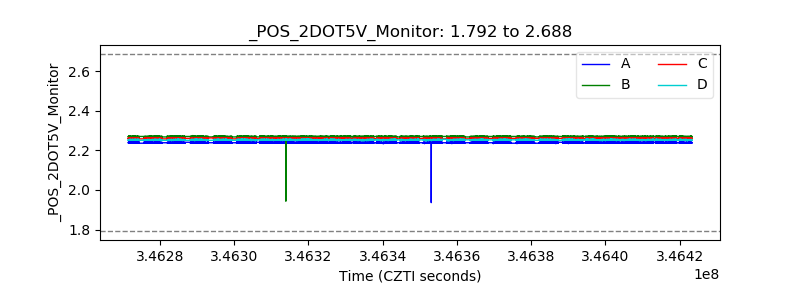 |
| +5 Volts monitor |  |
| _ROLL_ROT | 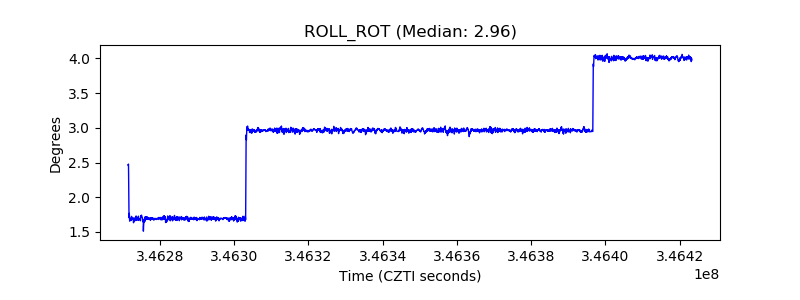 |
| _Roll_DEC | 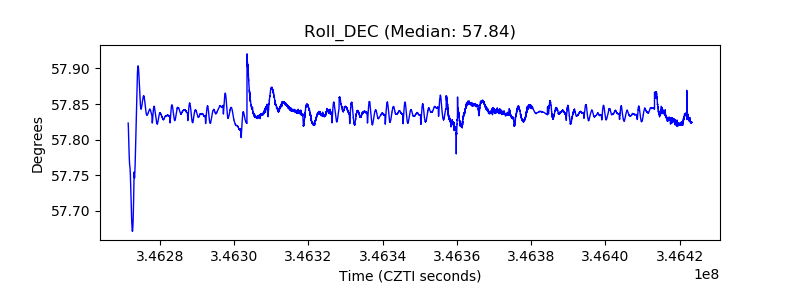 |
| _Roll_RA | 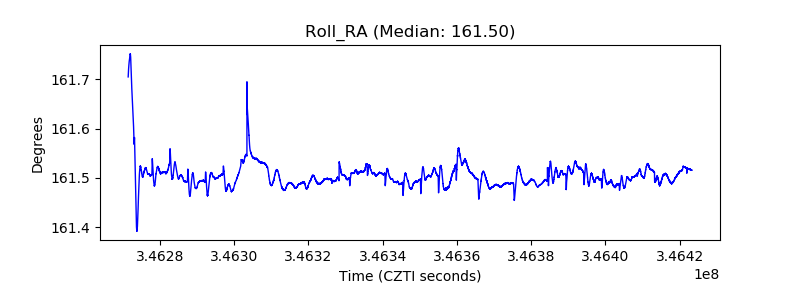 |
| Veto Counter | 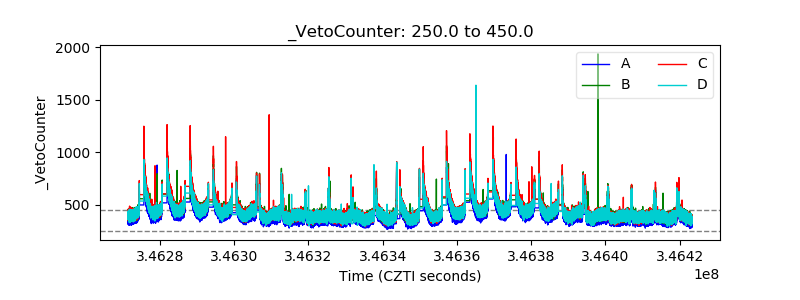 |