| Param | Original file | Final file |
|---|---|---|
| Filename | modeM0/AS1A10_102T10_9000004080_28296cztM0_level2.evt | modeM0/AS1A10_102T10_9000004080_28296cztM0_level2_quad_clean.evt |
| Size (bytes) | 341,225,280 | 75,548,160 |
| Size | 325.4 MB | 72.0 MB |
| Events in quadrant A | 2,101,013 | 504,877 |
| Events in quadrant B | 2,303,624 | 516,511 |
| Events in quadrant C | 2,190,513 | 502,037 |
| Events in quadrant D | 3,448,405 | 463,972 |
| Mode M0 | |||
|---|---|---|---|
| Quadrant | BADHDUFLAG | Total packets | Discarded packets |
| A | 0 | 9170 | 0 |
| B | 0 | 9784 | 0 |
| C | 0 | 9427 | 0 |
| D | 0 | 13150 | 0 |
| Mode M9 | |||
|---|---|---|---|
| Quadrant | BADHDUFLAG | Total packets | Discarded packets |
| A | 0 | 12 | 0 |
| B | 0 | 12 | 0 |
| C | 0 | 12 | 0 |
| D | 0 | 12 | 0 |
| Quadrant | Total seconds | Saturated seconds | Saturation percentage |
|---|---|---|---|
| A | 4270 | 42 | 0.983607% |
| B | 4270 | 80 | 1.873536% |
| C | 4269 | 73 | 1.710002% |
| D | 4269 | 283 | 6.629187% |
Noise dominated data is calculated using 1-second bins in cleaned event files. If a bin has >2000 counts, and if more than 50% of those come from <1% of pixels, then it is considered to be noise-dominated and hence unusable.
| Quadrant | # 1 sec bins | Bins with >0 counts | Bins with >2000 counts | High rate bins dominated by noise | Noise dominated (total time) | Noise dominated (detector-on time) | Marked lightcurve |
|---|---|---|---|---|---|---|---|
| A | 5490 | 4271 | 3 | 3 | 0.05% | 0.07% | 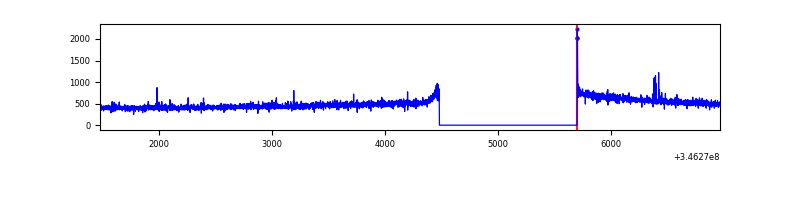 |
| B | 5490 | 4271 | 21 | 21 | 0.38% | 0.49% | 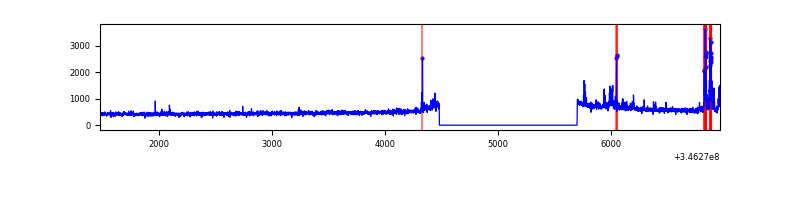 |
| C | 5489 | 4270 | 0 | 0 | 0.00% | 0.00% | 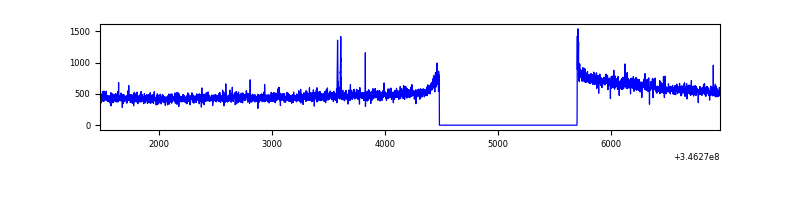 |
| D | 5489 | 4269 | 189 | 189 | 3.44% | 4.43% | 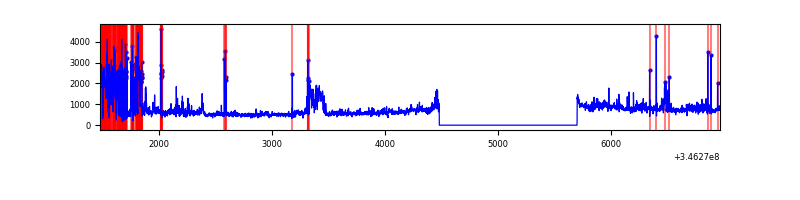 |
Top three noisy pixels from each quadrant. If the there are fewer than three noisy pixels in the level2.evt file, extra rows are filled as -1
| Pixel properties | Quadrant properties | ||||||
|---|---|---|---|---|---|---|---|
| Quadrant | DetID | PixID | Counts | Sigma | Mean | Median | Sigma |
| A | 13 | 254 | 7667 | 66.14 | 541 | 531 | 107.9 |
| A | 8 | 192 | 7350 | 63.2 | 541 | 531 | 107.9 |
| A | 15 | 174 | 6365 | 54.07 | 541 | 531 | 107.9 |
| B | 10 | 245 | 158451 | 1563.46 | 540 | 528 | 101.0 |
| B | 4 | 200 | 13819 | 131.58 | 540 | 528 | 101.0 |
| B | 12 | 111 | 11839 | 111.98 | 540 | 528 | 101.0 |
| C | 14 | 238 | 85119 | 687.03 | 529 | 531 | 123.1 |
| C | 3 | 233 | 45029 | 361.42 | 529 | 531 | 123.1 |
| C | 13 | 61 | 3568 | 24.67 | 529 | 531 | 123.1 |
| D | 1 | 52 | 1410624 | 11718.66 | 511 | 498 | 120.3 |
| D | 8 | 195 | 41144 | 337.78 | 511 | 498 | 120.3 |
| D | 2 | 120 | 22240 | 180.68 | 511 | 498 | 120.3 |
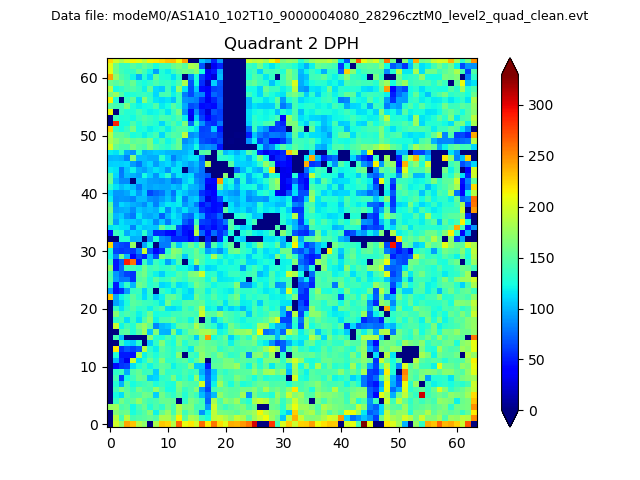
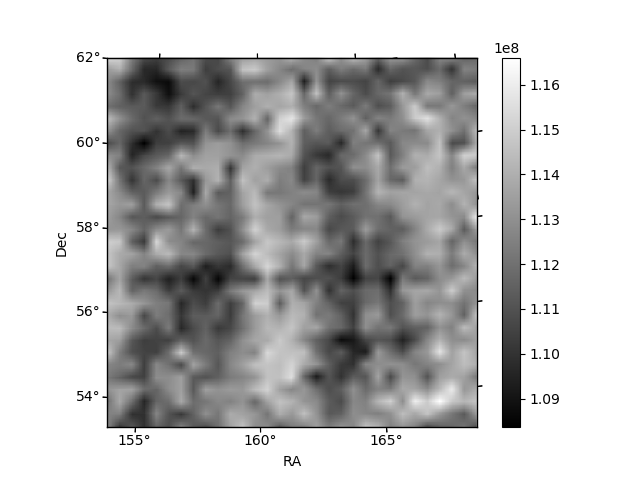
Histogram calculated using DETX and DETY for each event in the final _common_clean file
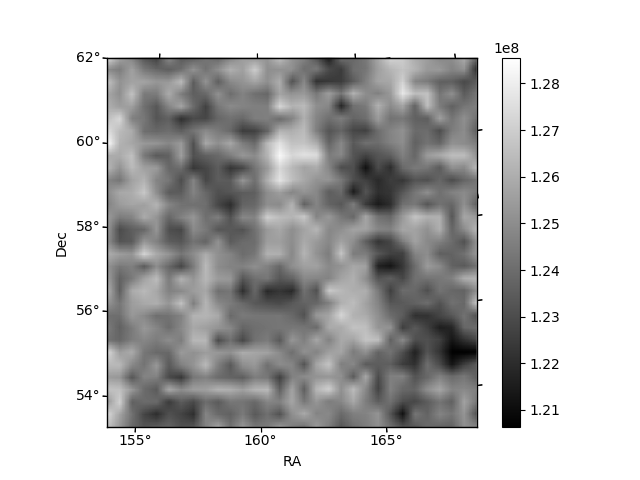
| Quadrant A | 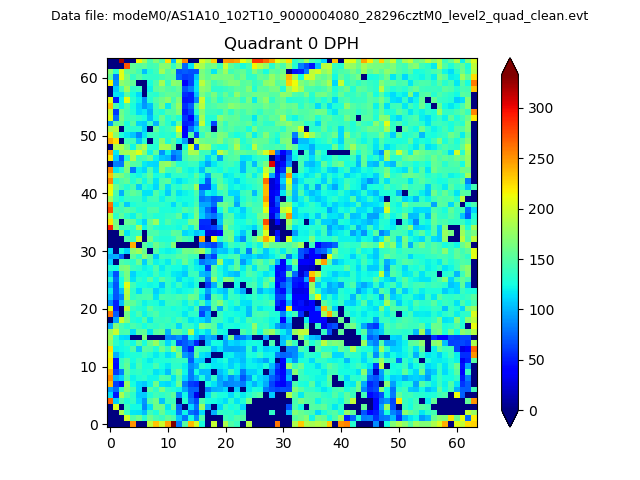 |
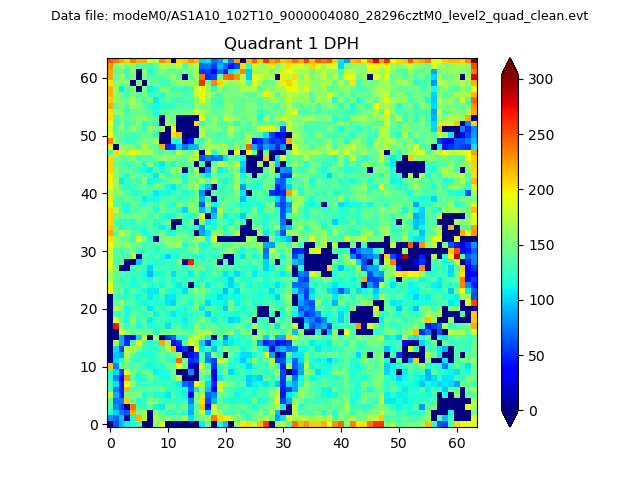 |
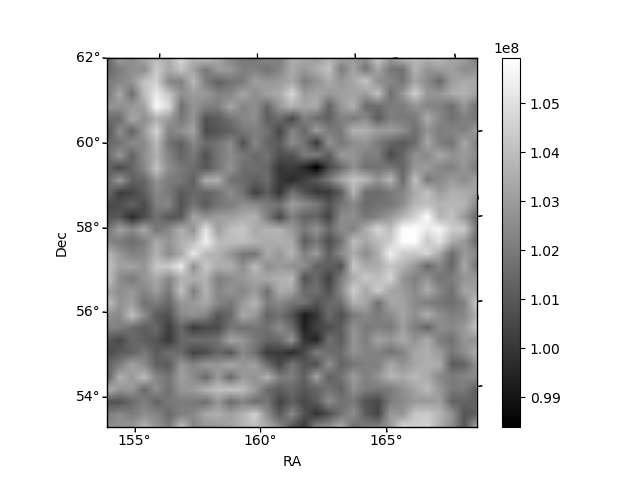
Quadrant B |
|---|---|---|---|
| Quadrant D | 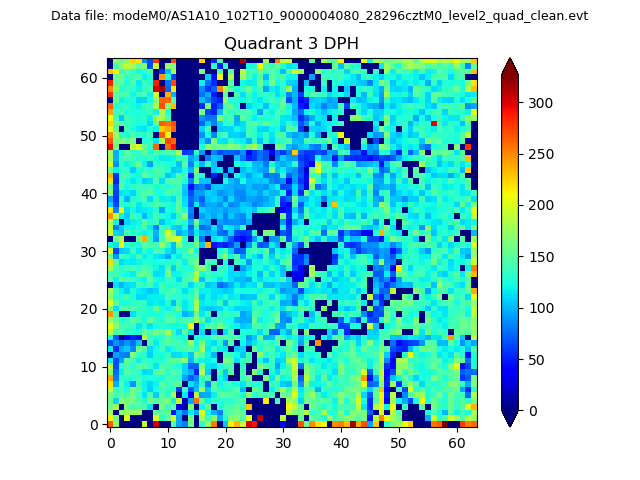 |
 |
Quadrant C |
| Plot type | Count rate plots | Images |
|---|---|---|
| Comparison with Poisson distribution Blue bars denote a histogram of data divided into 1 sec bins. Red curve is a Poisson curve with rate = median count rate of data. |
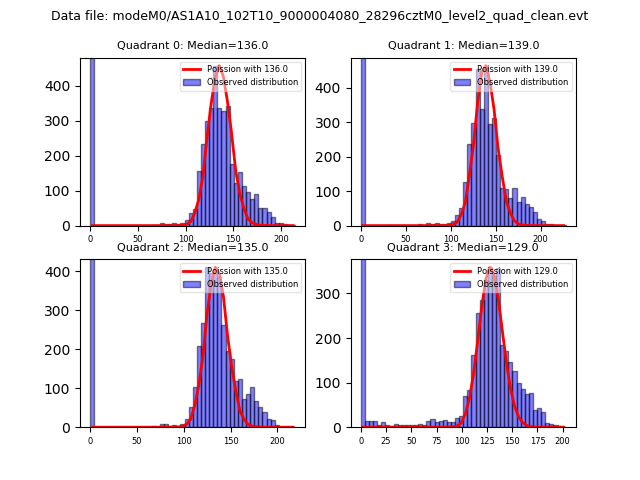 |
 |
| Quadrant-wise count rates Data is divided into 100 sec bins |
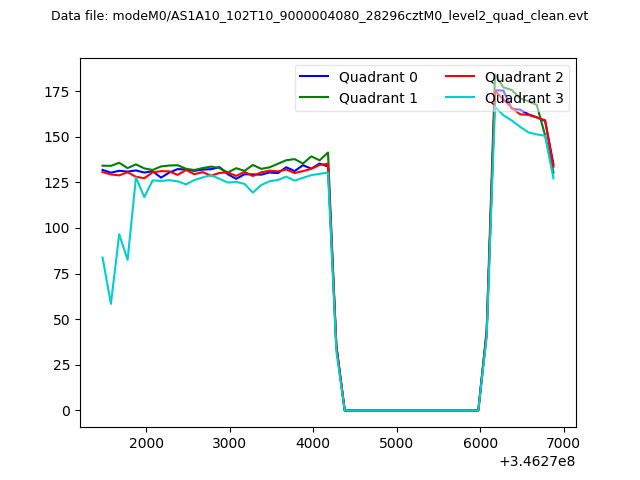 |
|
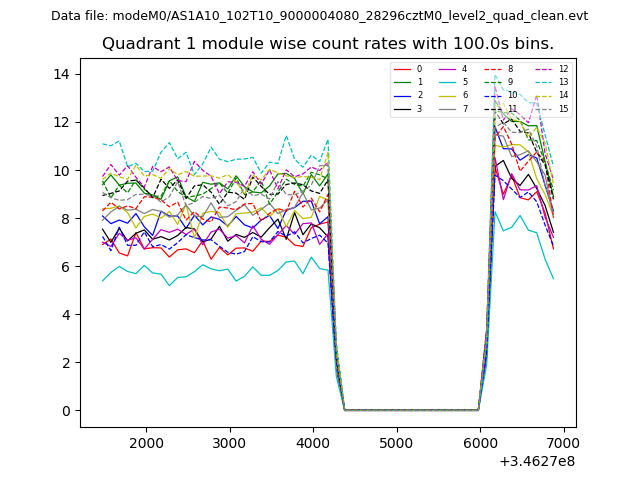
| Module-wise count rates for Quadrant A Data is divided into 100 sec bins |
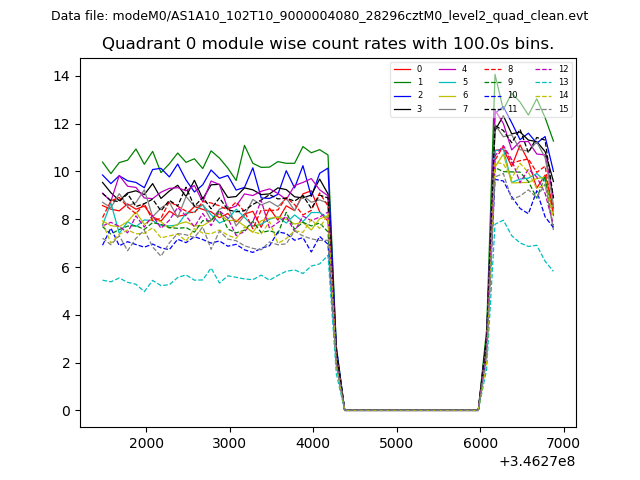 |
 |
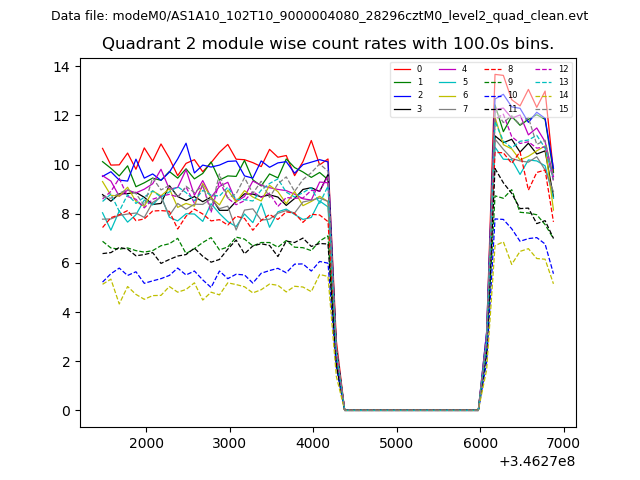
| Module-wise count rates for Quadrant B Data is divided into 100 sec bins |
 |
 |
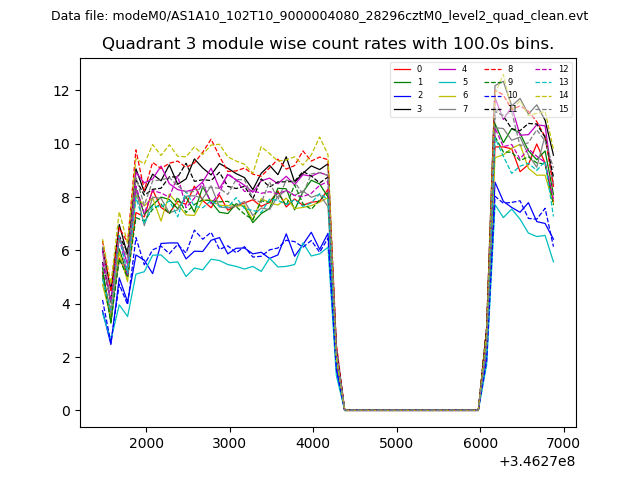
| Module-wise count rates for Quadrant C Data is divided into 100 sec bins |
 |
 |
| Module-wise count rates for Quadrant D Data is divided into 100 sec bins |
 |
 |
| Parameter | Plot |
|---|---|
| CZT HV Monitor | 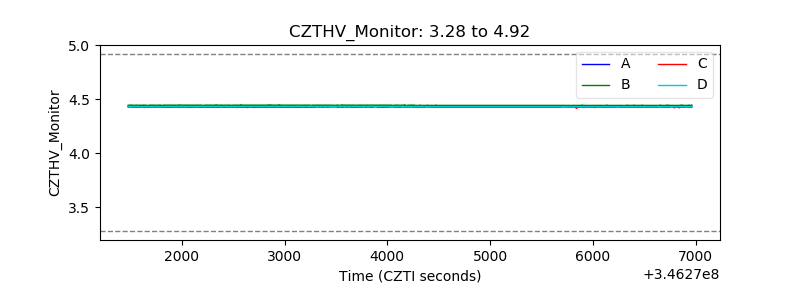 |
| D_VDD | 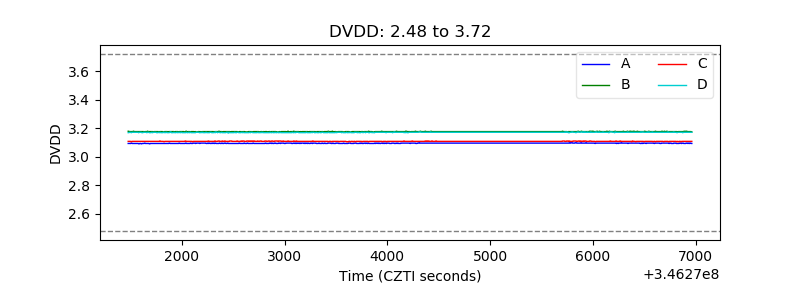 |
| Temperature 1 |  |
| Veto HV Monitor | 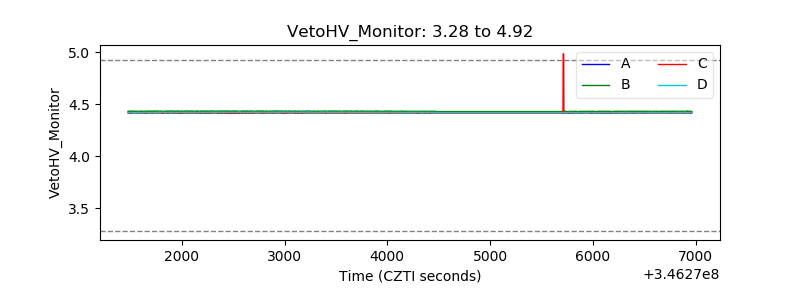 |
| Veto LLD | 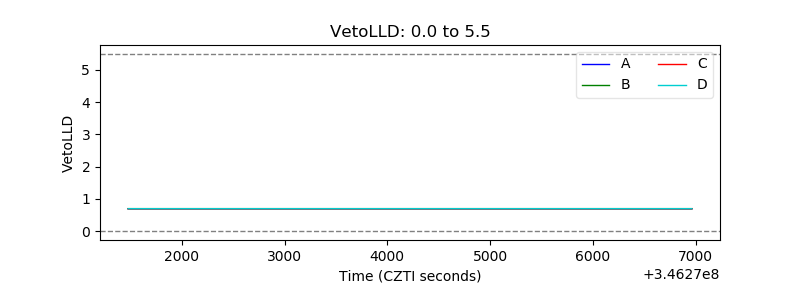 |
| Alpha Counter | 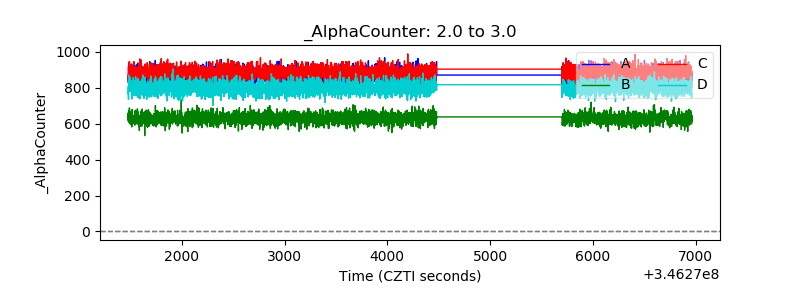 |
| _CPM_Rate | 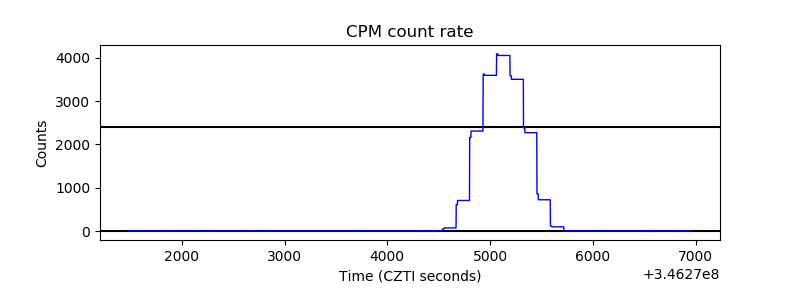 |
| CZT Counter |  |
| +2.5 Volts monitor |  |
| +5 Volts monitor |  |
| _ROLL_ROT | 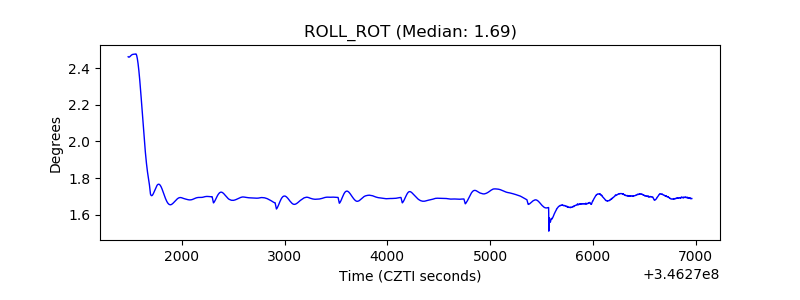 |
| _Roll_DEC | 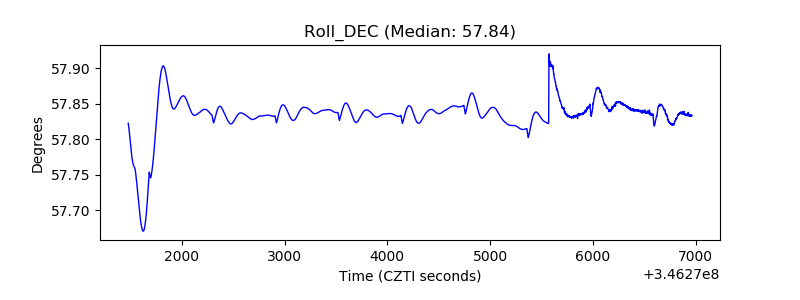 |
| _Roll_RA | 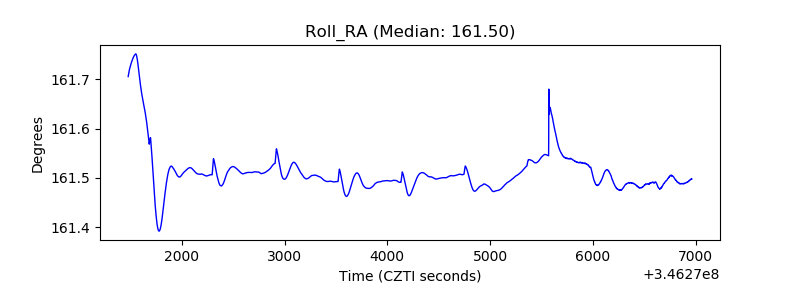 |
| Veto Counter | 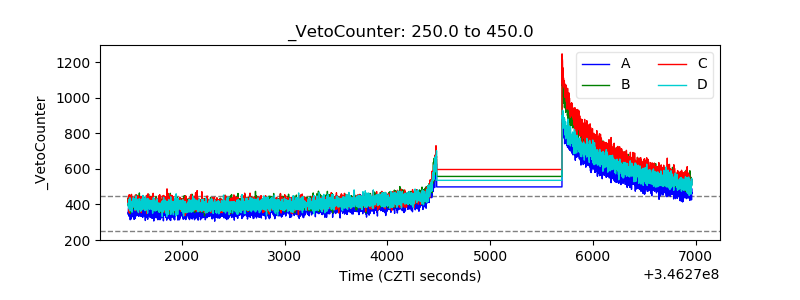 |