| Param | Original file | Final file |
|---|---|---|
| Filename | modeM0/AS1A10_102T10_9000004080_28298cztM0_level2.evt | modeM0/AS1A10_102T10_9000004080_28298cztM0_level2_quad_clean.evt |
| Size (bytes) | 524,891,520 | 121,380,480 |
| Size | 500.6 MB | 115.8 MB |
| Events in quadrant A | 3,145,973 | 821,416 |
| Events in quadrant B | 3,603,844 | 856,630 |
| Events in quadrant C | 3,297,593 | 822,551 |
| Events in quadrant D | 5,432,380 | 746,549 |
| Mode M0 | |||
|---|---|---|---|
| Quadrant | BADHDUFLAG | Total packets | Discarded packets |
| A | 0 | 13237 | 0 |
| B | 0 | 14636 | 0 |
| C | 0 | 13755 | 0 |
| D | 0 | 20422 | 0 |
| Mode M9 | |||
|---|---|---|---|
| Quadrant | BADHDUFLAG | Total packets | Discarded packets |
| A | 0 | 14 | 0 |
| B | 0 | 14 | 0 |
| C | 0 | 14 | 0 |
| D | 0 | 14 | 0 |
| Quadrant | Total seconds | Saturated seconds | Saturation percentage |
|---|---|---|---|
| A | 6148 | 40 | 0.650618% |
| B | 6149 | 120 | 1.951537% |
| C | 6148 | 85 | 1.382563% |
| D | 6148 | 513 | 8.344177% |
Noise dominated data is calculated using 1-second bins in cleaned event files. If a bin has >2000 counts, and if more than 50% of those come from <1% of pixels, then it is considered to be noise-dominated and hence unusable.
| Quadrant | # 1 sec bins | Bins with >0 counts | Bins with >2000 counts | High rate bins dominated by noise | Noise dominated (total time) | Noise dominated (detector-on time) | Marked lightcurve |
|---|---|---|---|---|---|---|---|
| A | 7503 | 6149 | 5 | 5 | 0.07% | 0.08% | 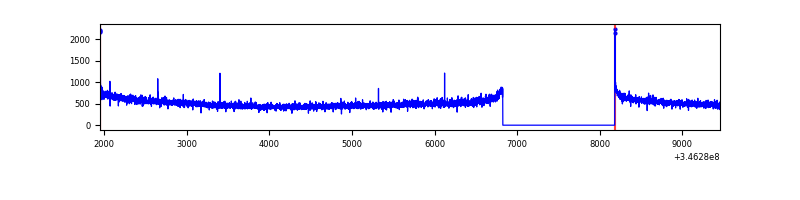 |
| B | 7504 | 6150 | 64 | 64 | 0.85% | 1.04% | 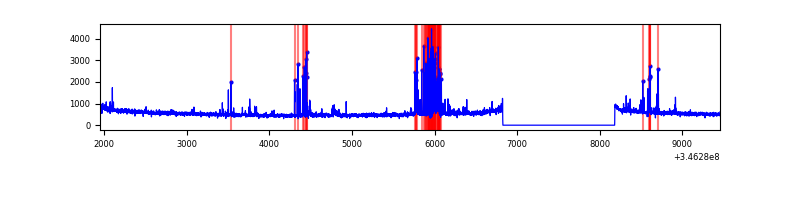 |
| C | 7503 | 6148 | 0 | 0 | 0.00% | 0.00% | 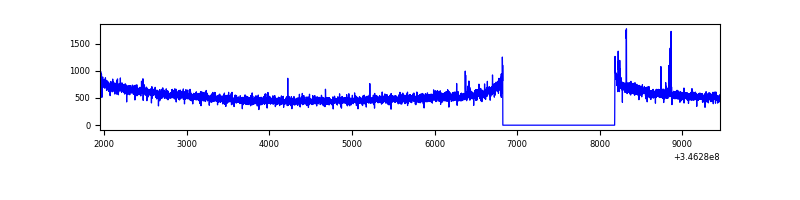 |
| D | 7503 | 6148 | 432 | 432 | 5.76% | 7.03% | 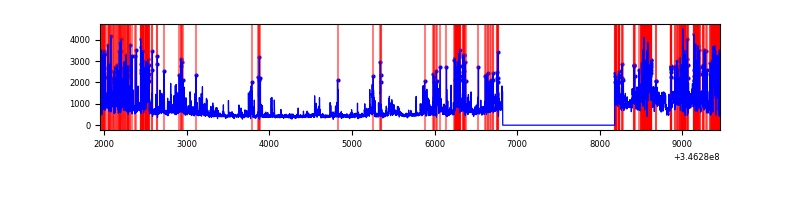 |
Top three noisy pixels from each quadrant. If the there are fewer than three noisy pixels in the level2.evt file, extra rows are filled as -1
| Pixel properties | Quadrant properties | ||||||
|---|---|---|---|---|---|---|---|
| Quadrant | DetID | PixID | Counts | Sigma | Mean | Median | Sigma |
| A | 8 | 192 | 15124 | 89.32 | 811 | 797 | 160.4 |
| A | 13 | 254 | 10754 | 62.08 | 811 | 797 | 160.4 |
| A | 3 | 137 | 7152 | 39.62 | 811 | 797 | 160.4 |
| B | 10 | 245 | 372877 | 2485.71 | 818 | 801 | 149.7 |
| B | 12 | 111 | 17631 | 112.44 | 818 | 801 | 149.7 |
| B | 11 | 111 | 15572 | 98.68 | 818 | 801 | 149.7 |
| C | 14 | 238 | 132089 | 716.52 | 800 | 808 | 183.2 |
| C | 3 | 233 | 44179 | 236.71 | 800 | 808 | 183.2 |
| C | 13 | 61 | 5523 | 25.73 | 800 | 808 | 183.2 |
| D | 1 | 52 | 1842136 | 10189.42 | 764 | 743 | 180.7 |
| D | 8 | 195 | 464875 | 2568.29 | 764 | 743 | 180.7 |
| D | 2 | 250 | 77957 | 427.27 | 764 | 743 | 180.7 |
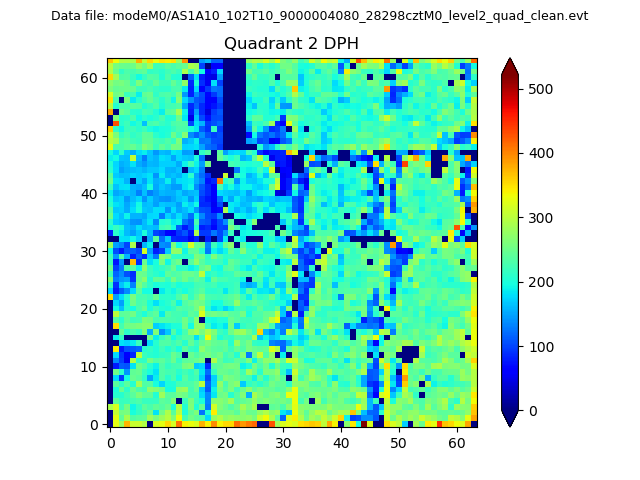
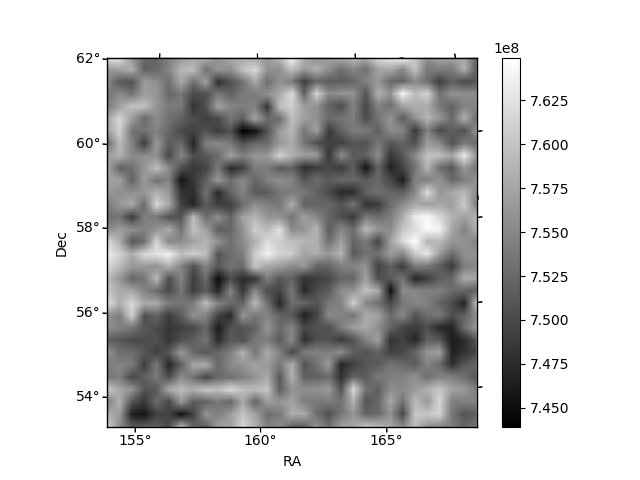
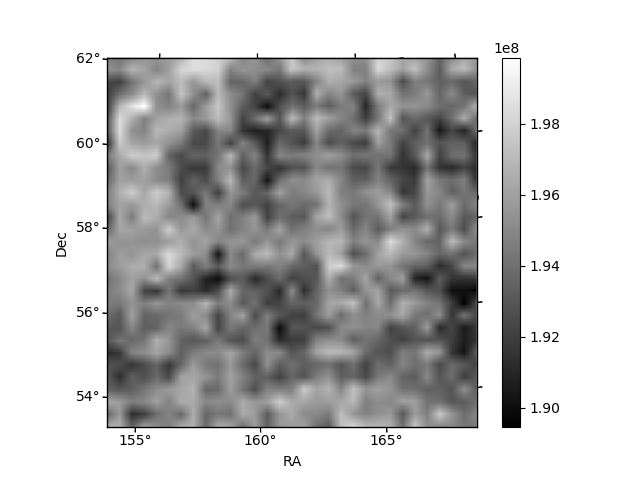
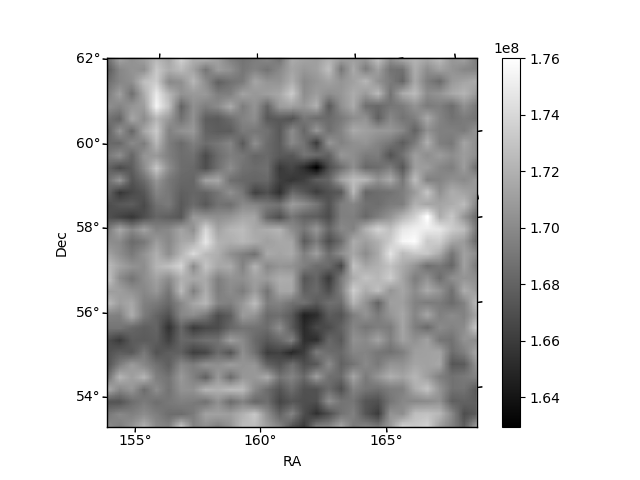
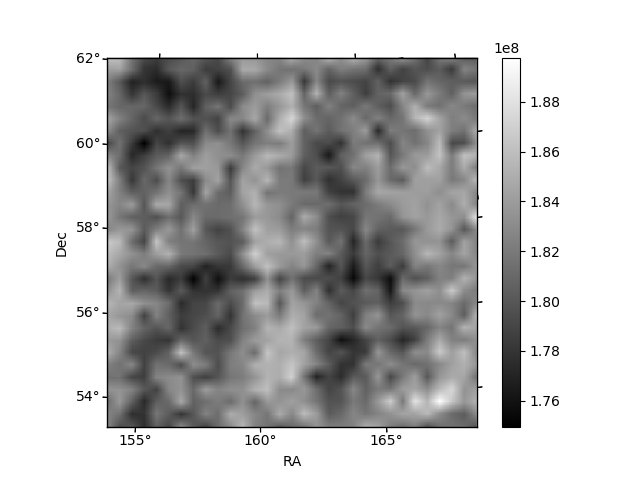
Histogram calculated using DETX and DETY for each event in the final _common_clean file
| Quadrant A | 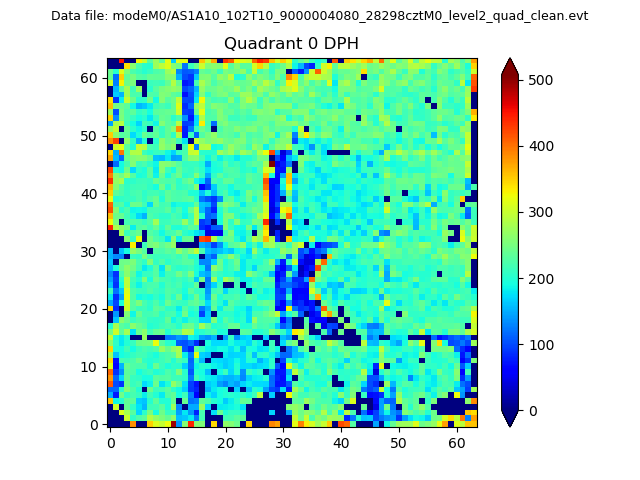 |
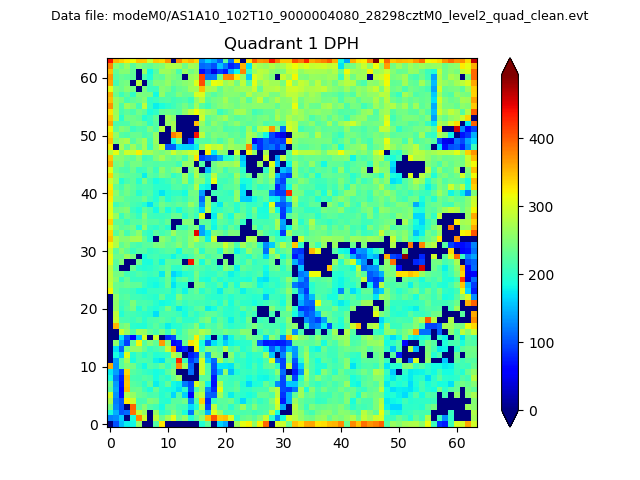 |
Quadrant B |
|---|---|---|---|
| Quadrant D | 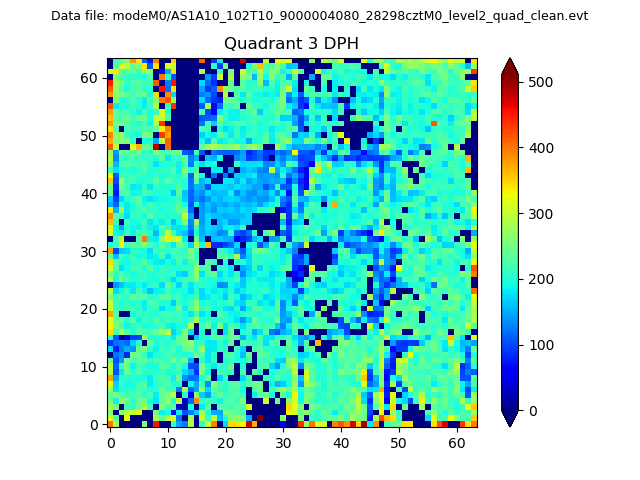 |
 |
Quadrant C |
| Plot type | Count rate plots | Images |
|---|---|---|
| Comparison with Poisson distribution Blue bars denote a histogram of data divided into 1 sec bins. Red curve is a Poisson curve with rate = median count rate of data. |
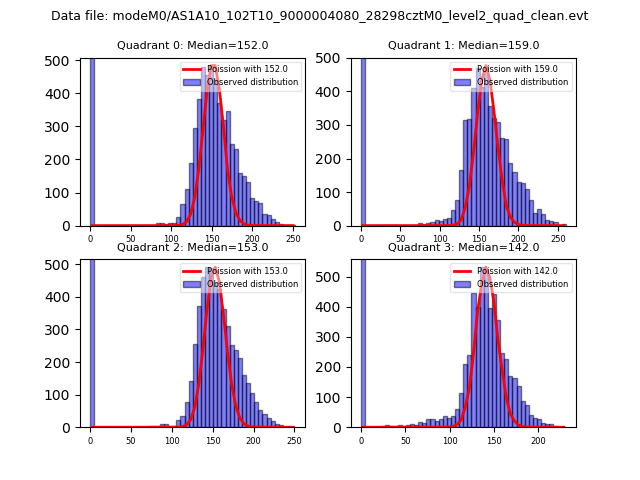 |
 |
| Quadrant-wise count rates Data is divided into 100 sec bins |
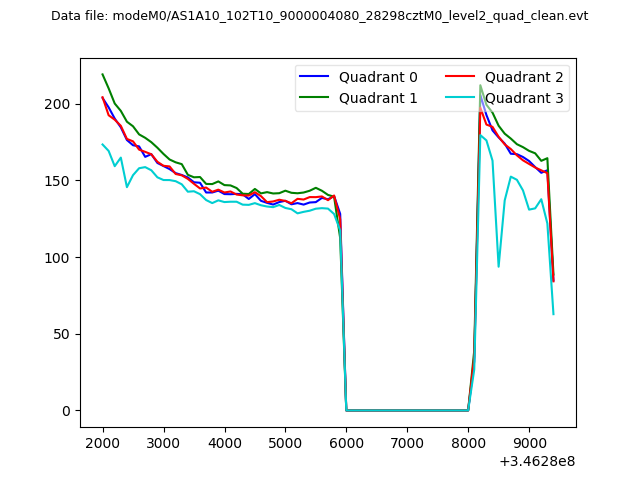 |
|
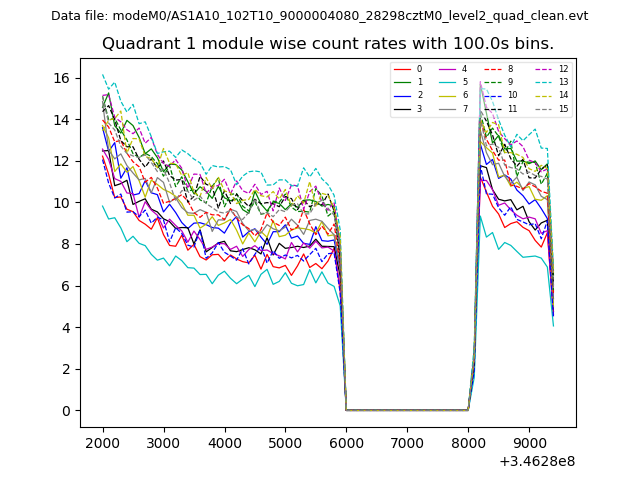
| Module-wise count rates for Quadrant A Data is divided into 100 sec bins |
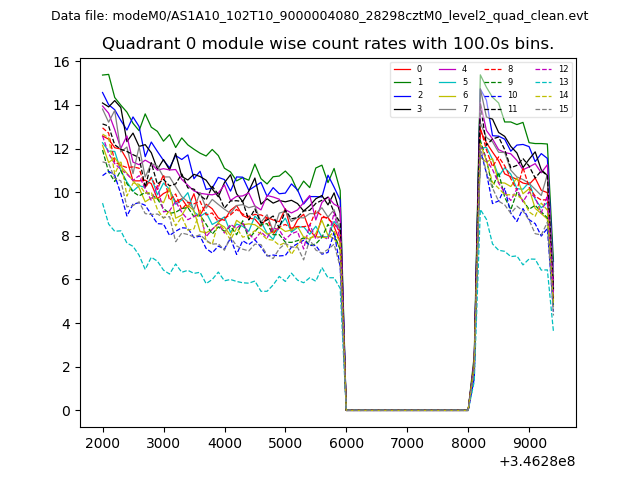 |
 |
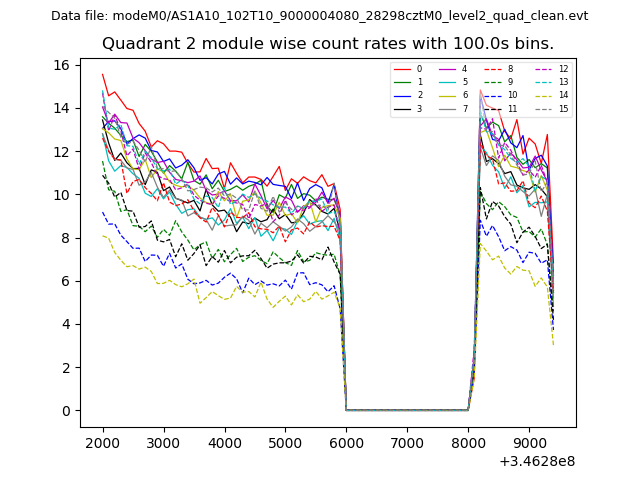
| Module-wise count rates for Quadrant B Data is divided into 100 sec bins |
 |
 |
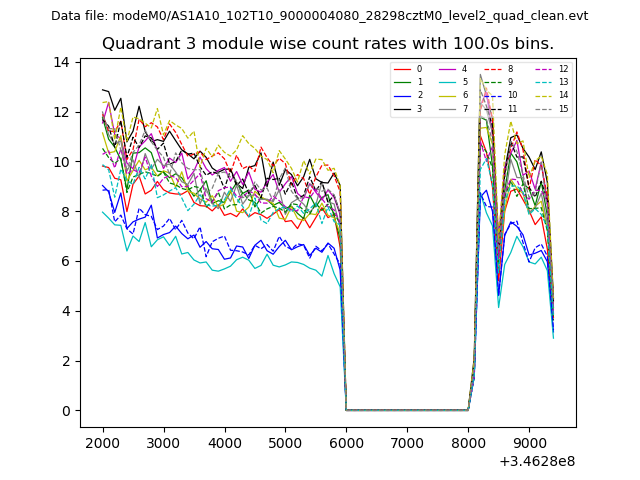
| Module-wise count rates for Quadrant C Data is divided into 100 sec bins |
 |
 |
| Module-wise count rates for Quadrant D Data is divided into 100 sec bins |
 |
 |
| Parameter | Plot |
|---|---|
| CZT HV Monitor | 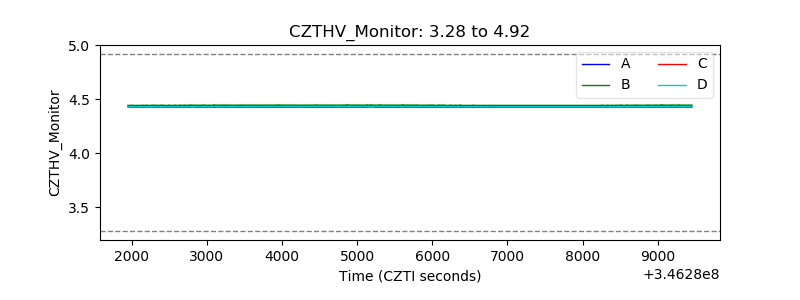 |
| D_VDD | 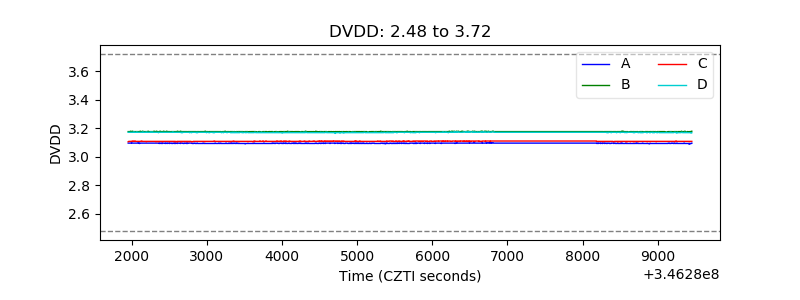 |
| Temperature 1 |  |
| Veto HV Monitor | 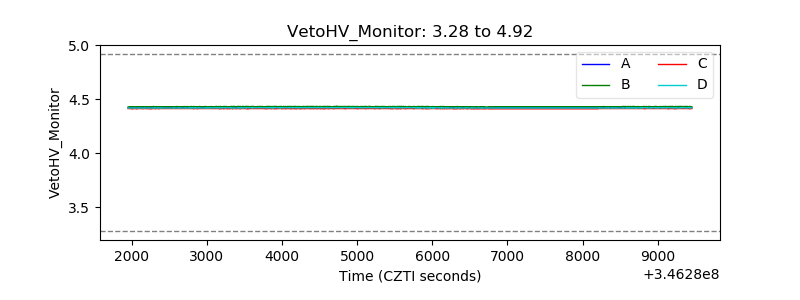 |
| Veto LLD | 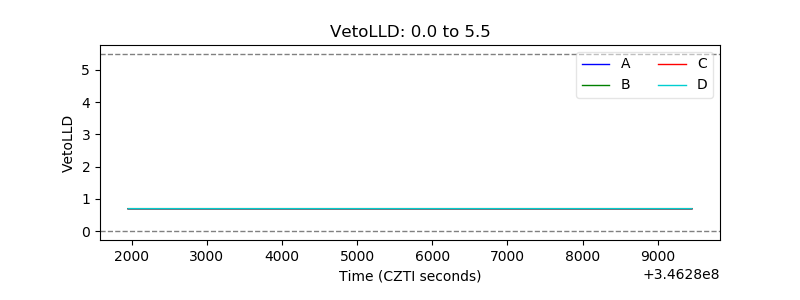 |
| Alpha Counter | 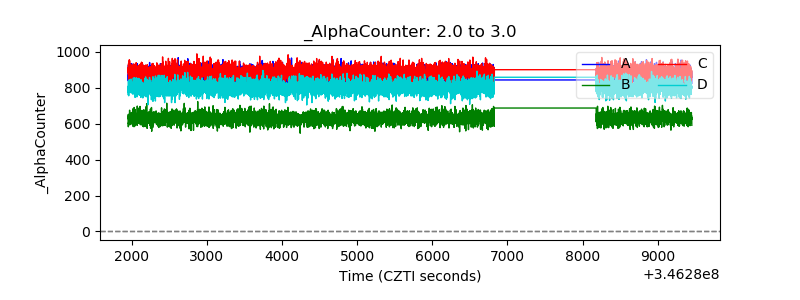 |
| _CPM_Rate | 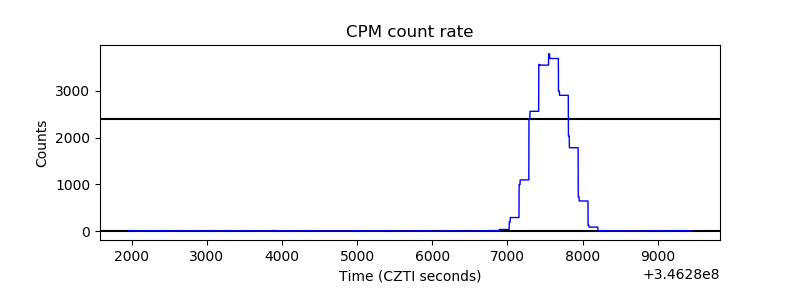 |
| CZT Counter | 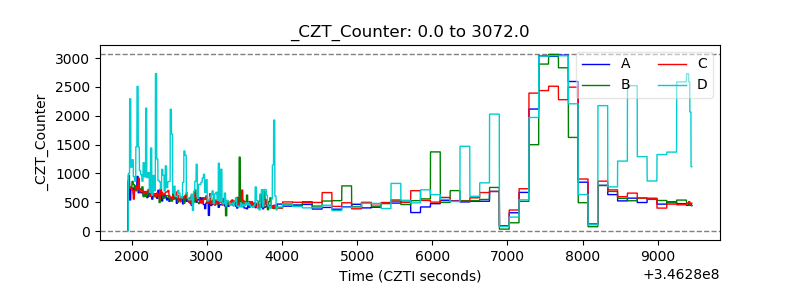 |
| +2.5 Volts monitor |  |
| +5 Volts monitor |  |
| _ROLL_ROT | 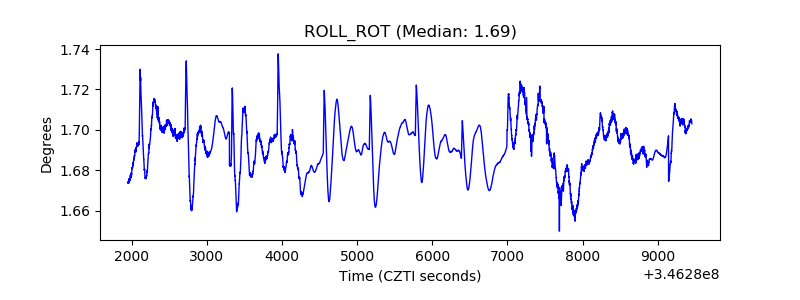 |
| _Roll_DEC |  |
| _Roll_RA | 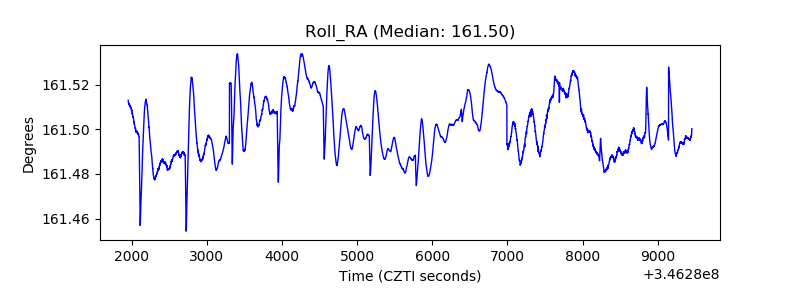 |
| Veto Counter |  |