| Param | Original file | Final file |
|---|---|---|
| Filename | modeM0/AS1A10_102T10_9000004080_28299cztM0_level2.evt | modeM0/AS1A10_102T10_9000004080_28299cztM0_level2_quad_clean.evt |
| Size (bytes) | 547,243,200 | 109,696,320 |
| Size | 521.9 MB | 104.6 MB |
| Events in quadrant A | 3,109,404 | 746,188 |
| Events in quadrant B | 3,524,983 | 771,680 |
| Events in quadrant C | 3,197,550 | 742,019 |
| Events in quadrant D | 6,322,784 | 631,130 |
| Mode M0 | |||
|---|---|---|---|
| Quadrant | BADHDUFLAG | Total packets | Discarded packets |
| A | 0 | 13127 | 0 |
| B | 0 | 14320 | 0 |
| C | 0 | 13363 | 0 |
| D | 0 | 22899 | 0 |
| Mode M9 | |||
|---|---|---|---|
| Quadrant | BADHDUFLAG | Total packets | Discarded packets |
| A | 0 | 22 | 0 |
| B | 0 | 23 | 0 |
| C | 0 | 23 | 0 |
| D | 0 | 23 | 0 |
| Quadrant | Total seconds | Saturated seconds | Saturation percentage |
|---|---|---|---|
| A | 6170 | 36 | 0.583468% |
| B | 6170 | 162 | 2.625608% |
| C | 6170 | 84 | 1.361426% |
| D | 6169 | 1039 | 16.842276% |
Noise dominated data is calculated using 1-second bins in cleaned event files. If a bin has >2000 counts, and if more than 50% of those come from <1% of pixels, then it is considered to be noise-dominated and hence unusable.
| Quadrant | # 1 sec bins | Bins with >0 counts | Bins with >2000 counts | High rate bins dominated by noise | Noise dominated (total time) | Noise dominated (detector-on time) | Marked lightcurve |
|---|---|---|---|---|---|---|---|
| A | 7510 | 6171 | 3 | 3 | 0.04% | 0.05% | 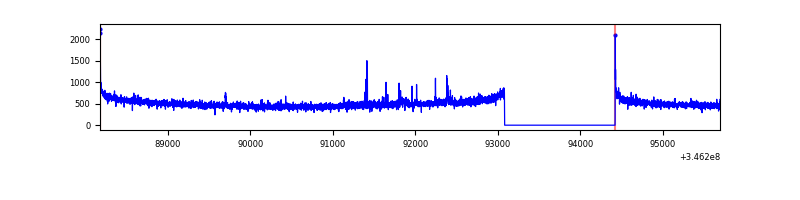 |
| B | 7510 | 6171 | 100 | 100 | 1.33% | 1.62% | 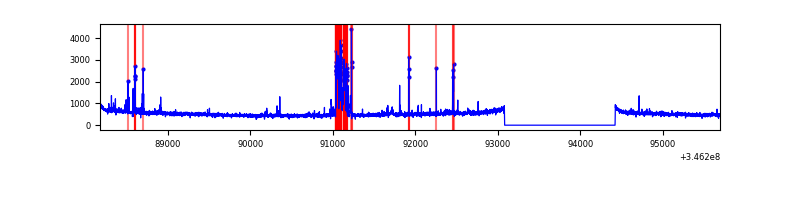 |
| C | 7510 | 6171 | 0 | 0 | 0.00% | 0.00% | 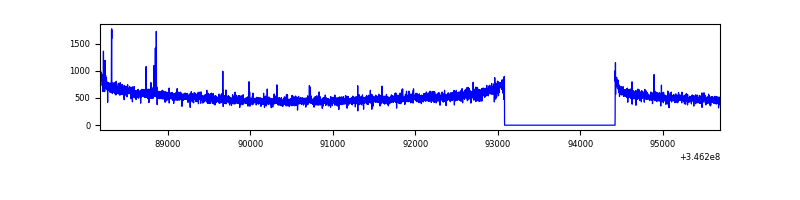 |
| D | 7509 | 6170 | 973 | 973 | 12.96% | 15.77% | 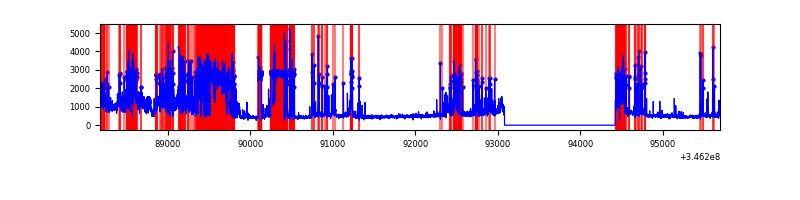 |
Top three noisy pixels from each quadrant. If the there are fewer than three noisy pixels in the level2.evt file, extra rows are filled as -1
| Pixel properties | Quadrant properties | ||||||
|---|---|---|---|---|---|---|---|
| Quadrant | DetID | PixID | Counts | Sigma | Mean | Median | Sigma |
| A | 15 | 174 | 33595 | 208.89 | 794 | 781 | 157.1 |
| A | 8 | 192 | 12970 | 77.59 | 794 | 781 | 157.1 |
| A | 13 | 254 | 10439 | 61.48 | 794 | 781 | 157.1 |
| B | 10 | 245 | 390555 | 2646.87 | 796 | 780 | 147.3 |
| B | 12 | 111 | 17295 | 112.15 | 796 | 780 | 147.3 |
| B | 11 | 111 | 15606 | 100.68 | 796 | 780 | 147.3 |
| C | 14 | 238 | 127838 | 712.63 | 774 | 780 | 178.3 |
| C | 3 | 233 | 52911 | 292.38 | 774 | 780 | 178.3 |
| C | 13 | 61 | 5366 | 25.72 | 774 | 780 | 178.3 |
| D | 1 | 52 | 2652611 | 15802.19 | 713 | 695 | 167.8 |
| D | 8 | 195 | 441198 | 2624.86 | 713 | 695 | 167.8 |
| D | 2 | 250 | 240473 | 1428.78 | 713 | 695 | 167.8 |
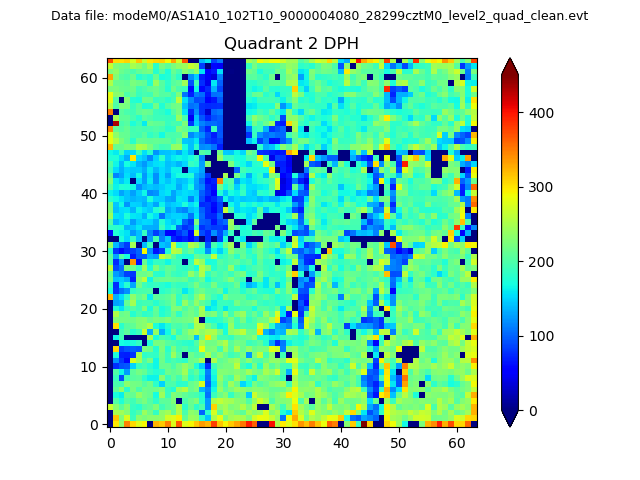
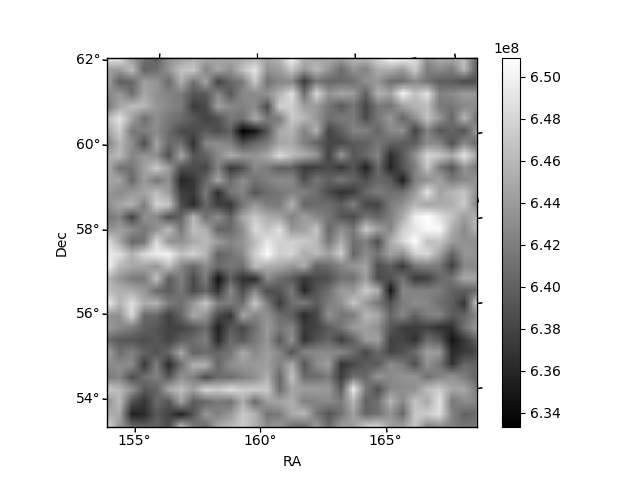
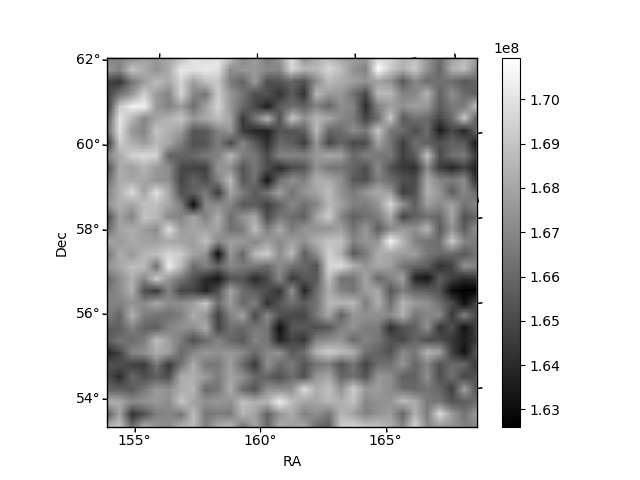
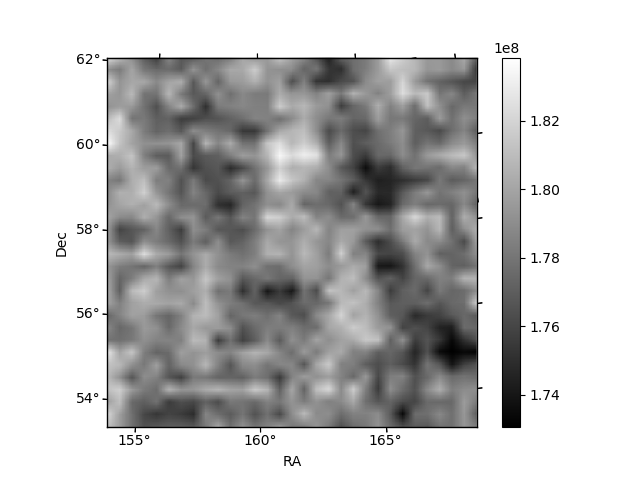
Histogram calculated using DETX and DETY for each event in the final _common_clean file
| Quadrant A | 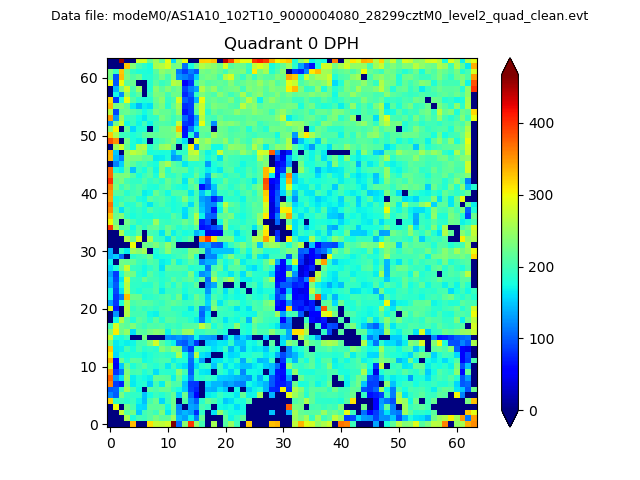 |
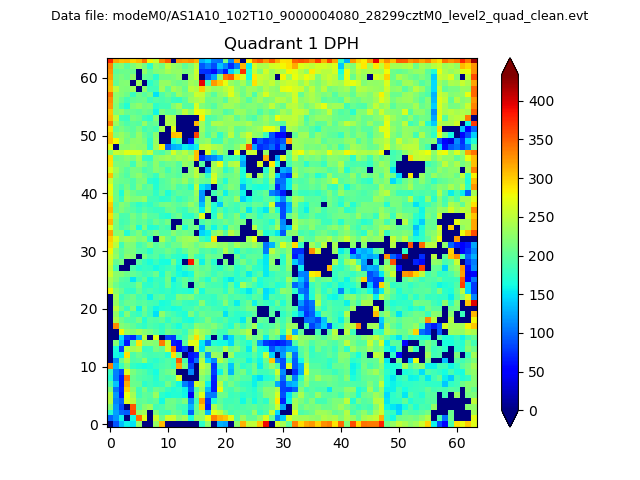 |
Quadrant B |
|---|---|---|---|
| Quadrant D | 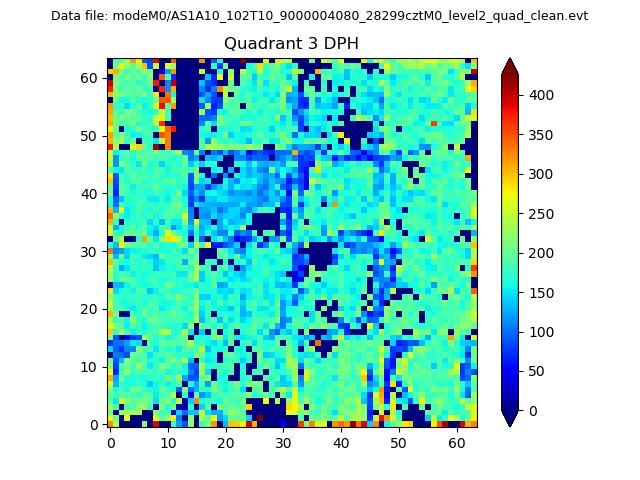 |
 |
Quadrant C |
| Plot type | Count rate plots | Images |
|---|---|---|
| Comparison with Poisson distribution Blue bars denote a histogram of data divided into 1 sec bins. Red curve is a Poisson curve with rate = median count rate of data. |
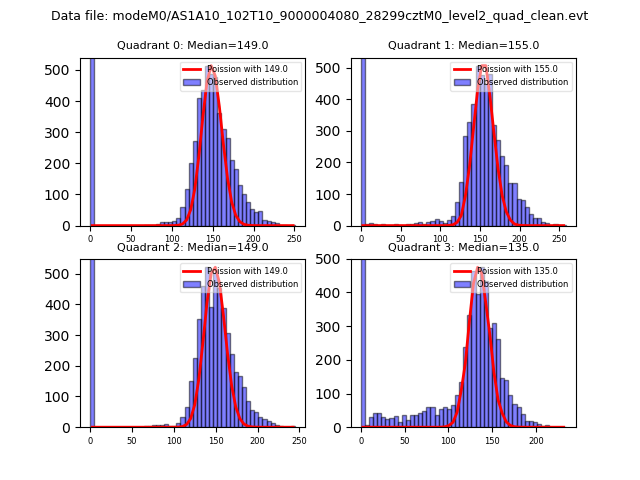 |
 |
| Quadrant-wise count rates Data is divided into 100 sec bins |
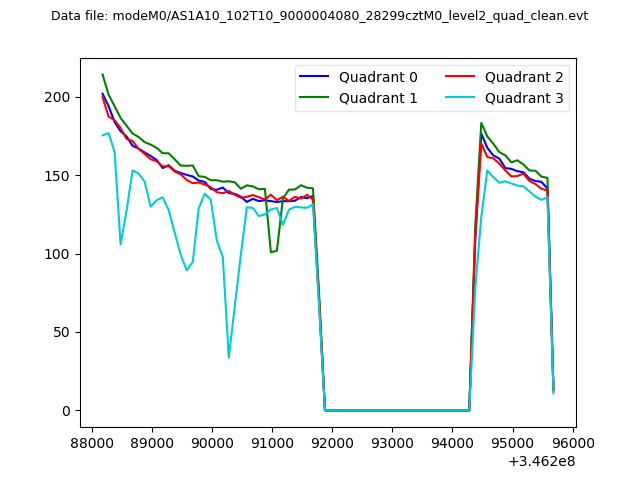 |
|
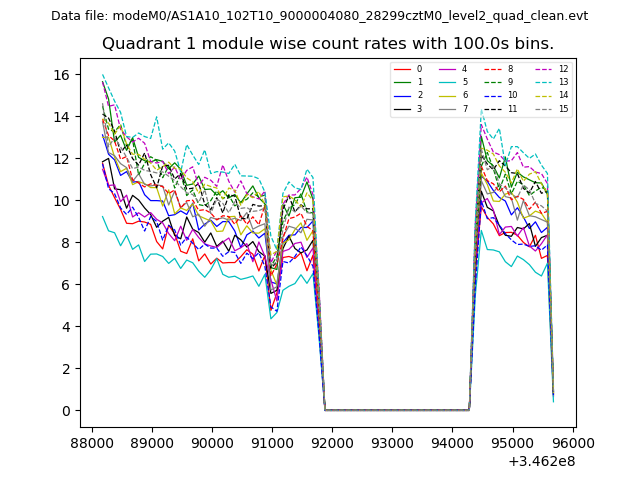
| Module-wise count rates for Quadrant A Data is divided into 100 sec bins |
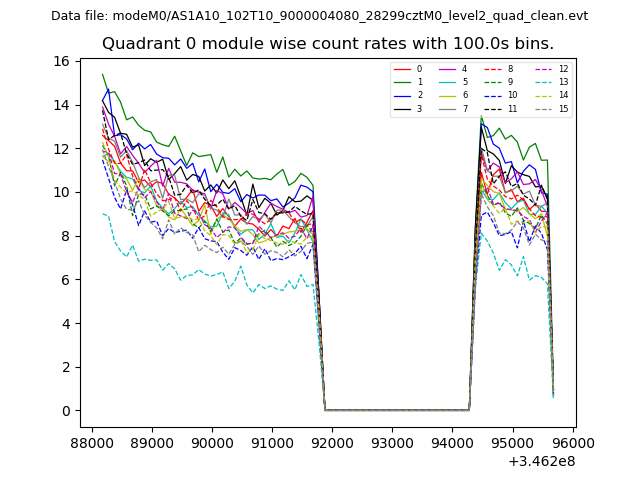 |
 |
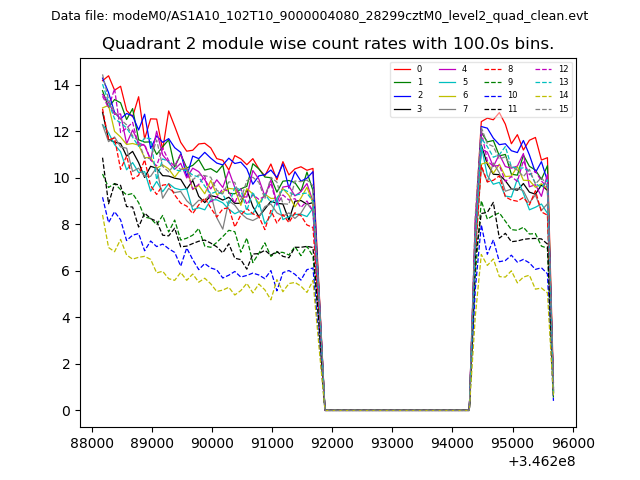
| Module-wise count rates for Quadrant B Data is divided into 100 sec bins |
 |
 |
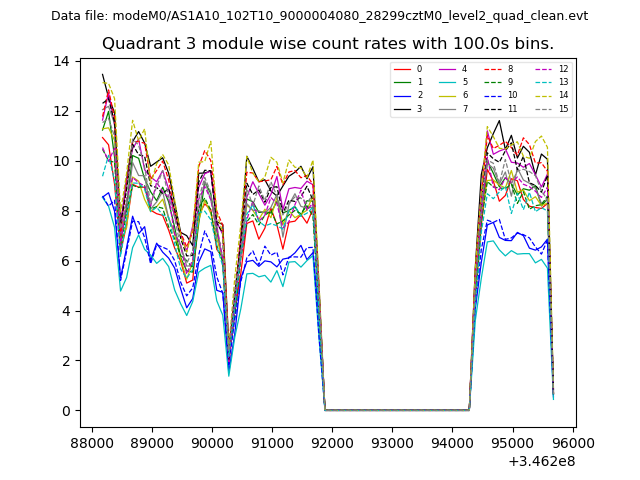
| Module-wise count rates for Quadrant C Data is divided into 100 sec bins |
 |
 |
| Module-wise count rates for Quadrant D Data is divided into 100 sec bins |
 |
 |
| Parameter | Plot |
|---|---|
| CZT HV Monitor | 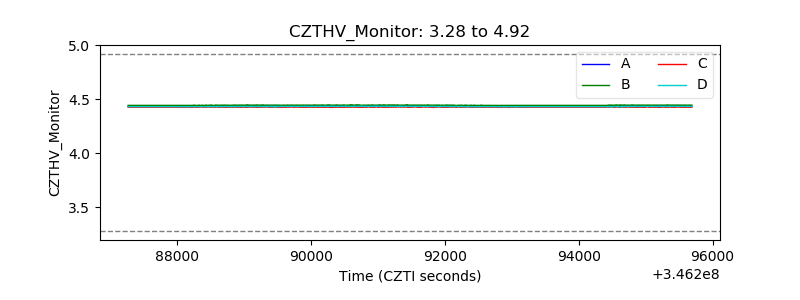 |
| D_VDD | 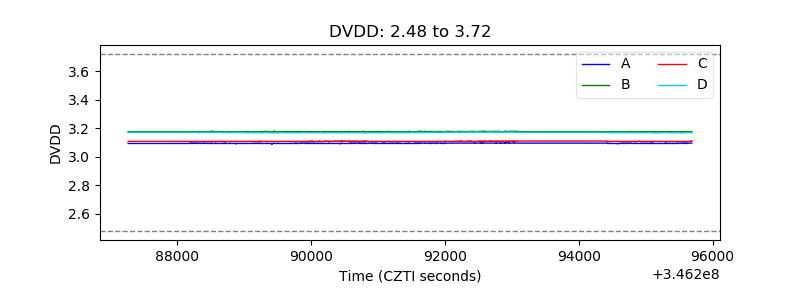 |
| Temperature 1 | 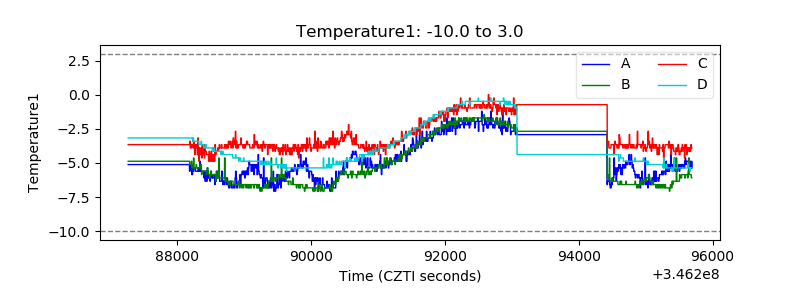 |
| Veto HV Monitor | 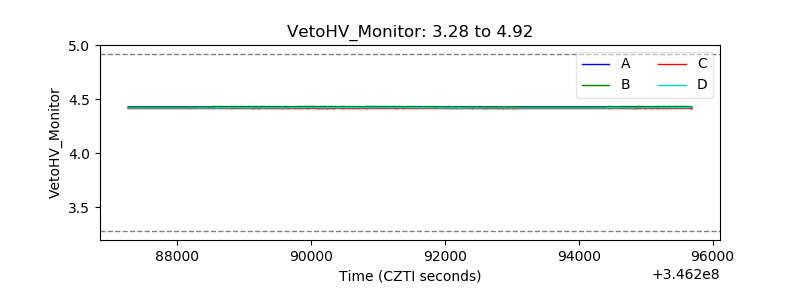 |
| Veto LLD | 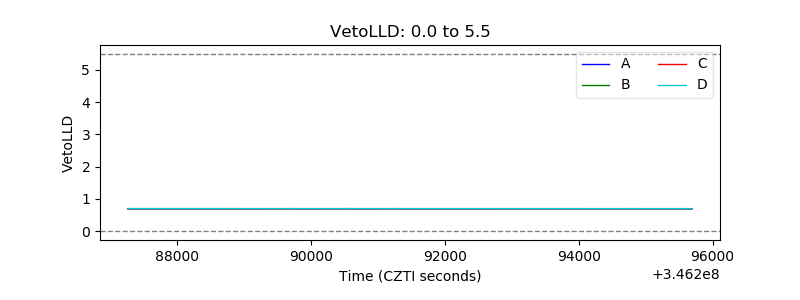 |
| Alpha Counter | 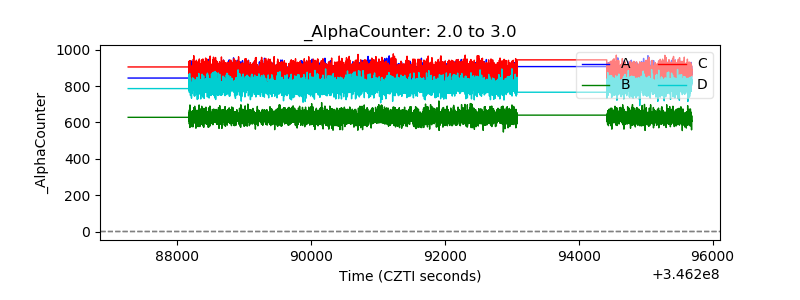 |
| _CPM_Rate | 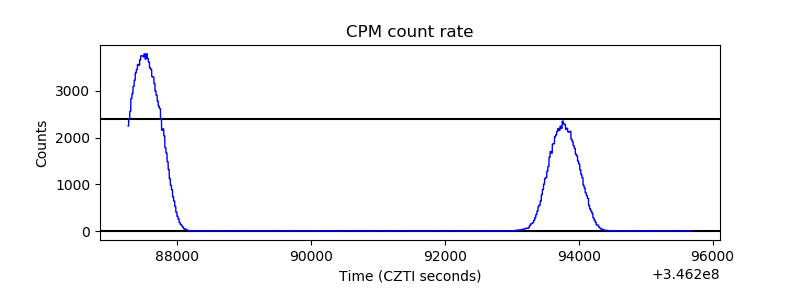 |
| CZT Counter | 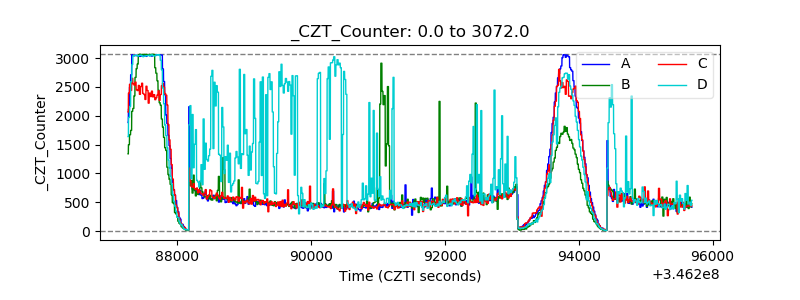 |
| +2.5 Volts monitor |  |
| +5 Volts monitor |  |
| _ROLL_ROT | 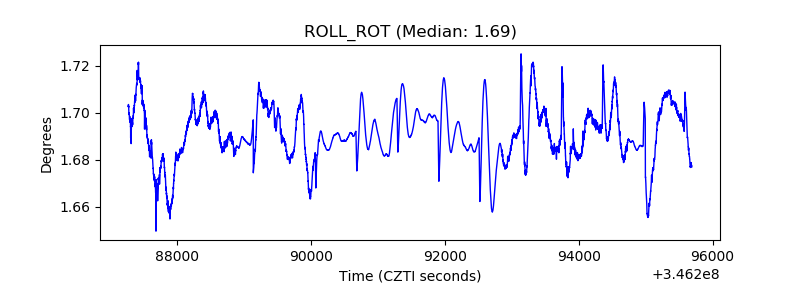 |
| _Roll_DEC | 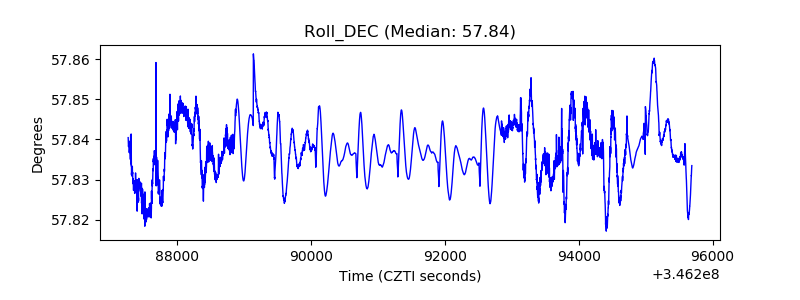 |
| _Roll_RA | 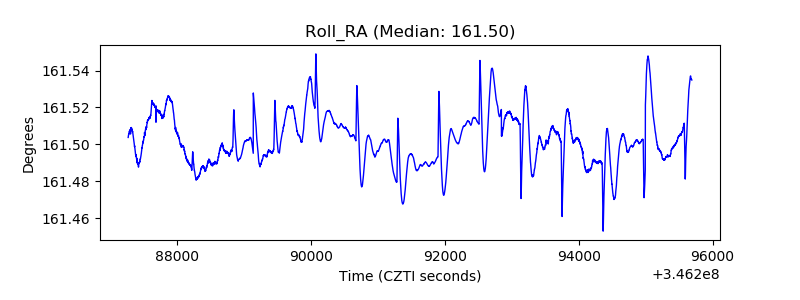 |
| Veto Counter | 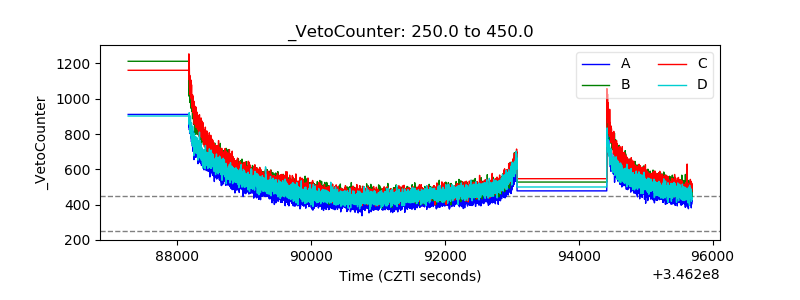 |