| Param | Original file | Final file |
|---|---|---|
| Filename | modeM0/AS1A10_102T10_9000004080_28300cztM0_level2.evt | modeM0/AS1A10_102T10_9000004080_28300cztM0_level2_quad_clean.evt |
| Size (bytes) | 487,566,720 | 100,457,280 |
| Size | 465.0 MB | 95.8 MB |
| Events in quadrant A | 3,566,164 | 654,400 |
| Events in quadrant B | 3,255,032 | 683,493 |
| Events in quadrant C | 3,181,632 | 648,815 |
| Events in quadrant D | 4,326,652 | 607,069 |
| Mode M0 | |||
|---|---|---|---|
| Quadrant | BADHDUFLAG | Total packets | Discarded packets |
| A | 0 | 14695 | 0 |
| B | 0 | 13767 | 0 |
| C | 0 | 13541 | 0 |
| D | 0 | 17227 | 0 |
| Mode M9 | |||
|---|---|---|---|
| Quadrant | BADHDUFLAG | Total packets | Discarded packets |
| A | 0 | 14 | 0 |
| B | 0 | 15 | 0 |
| C | 0 | 15 | 0 |
| D | 0 | 15 | 0 |
| Quadrant | Total seconds | Saturated seconds | Saturation percentage |
|---|---|---|---|
| A | 6433 | 57 | 0.886056% |
| B | 6432 | 44 | 0.684080% |
| C | 6432 | 77 | 1.197139% |
| D | 6432 | 288 | 4.477612% |
Noise dominated data is calculated using 1-second bins in cleaned event files. If a bin has >2000 counts, and if more than 50% of those come from <1% of pixels, then it is considered to be noise-dominated and hence unusable.
| Quadrant | # 1 sec bins | Bins with >0 counts | Bins with >2000 counts | High rate bins dominated by noise | Noise dominated (total time) | Noise dominated (detector-on time) | Marked lightcurve |
|---|---|---|---|---|---|---|---|
| A | 7633 | 6434 | 31 | 31 | 0.41% | 0.48% | 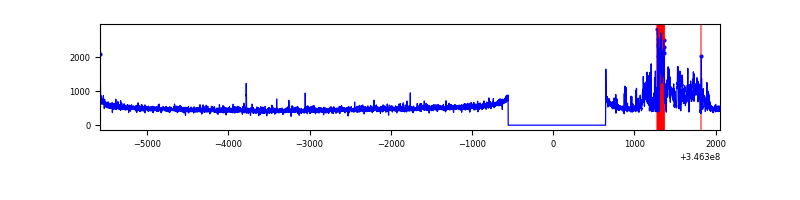 |
| B | 7632 | 6433 | 3 | 3 | 0.04% | 0.05% | 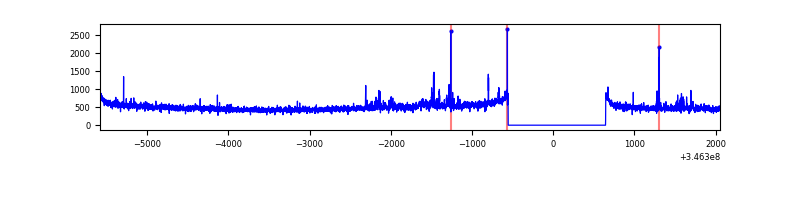 |
| C | 7632 | 6433 | 0 | 0 | 0.00% | 0.00% | 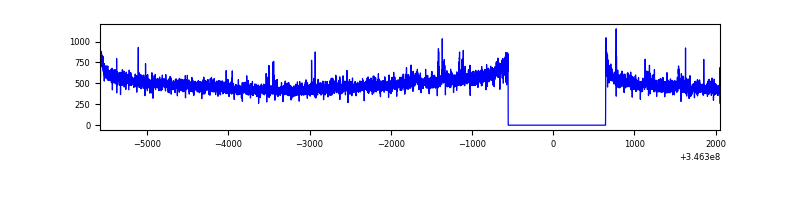 |
| D | 7632 | 6433 | 254 | 254 | 3.33% | 3.95% | 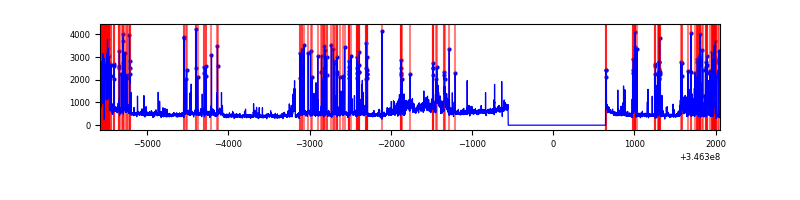 |
Top three noisy pixels from each quadrant. If the there are fewer than three noisy pixels in the level2.evt file, extra rows are filled as -1
| Pixel properties | Quadrant properties | ||||||
|---|---|---|---|---|---|---|---|
| Quadrant | DetID | PixID | Counts | Sigma | Mean | Median | Sigma |
| A | 15 | 174 | 455531 | 2872.74 | 797 | 781 | 158.3 |
| A | 4 | 2 | 25655 | 157.13 | 797 | 781 | 158.3 |
| A | 13 | 254 | 10852 | 63.62 | 797 | 781 | 158.3 |
| B | 10 | 245 | 96050 | 636.23 | 800 | 780 | 149.7 |
| B | 12 | 111 | 17978 | 114.85 | 800 | 780 | 149.7 |
| B | 4 | 200 | 17716 | 113.1 | 800 | 780 | 149.7 |
| C | 14 | 238 | 128593 | 717.45 | 767 | 774 | 178.2 |
| C | 3 | 233 | 63327 | 351.11 | 767 | 774 | 178.2 |
| C | 13 | 61 | 5325 | 25.54 | 767 | 774 | 178.2 |
| D | 8 | 195 | 469662 | 2639.82 | 751 | 732 | 177.6 |
| D | 2 | 82 | 369517 | 2076.06 | 751 | 732 | 177.6 |
| D | 2 | 250 | 217662 | 1221.2 | 751 | 732 | 177.6 |
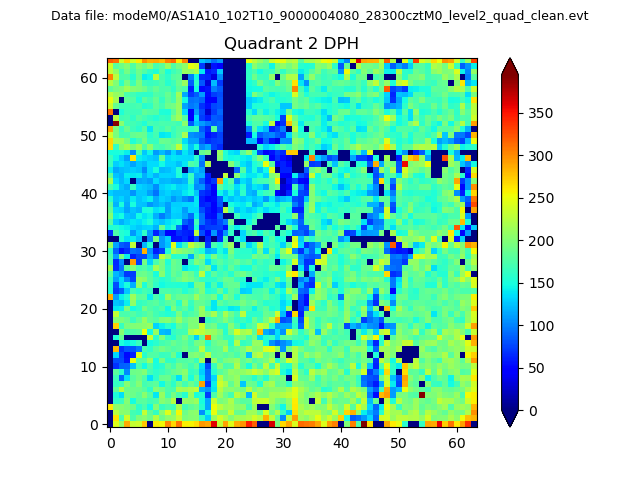
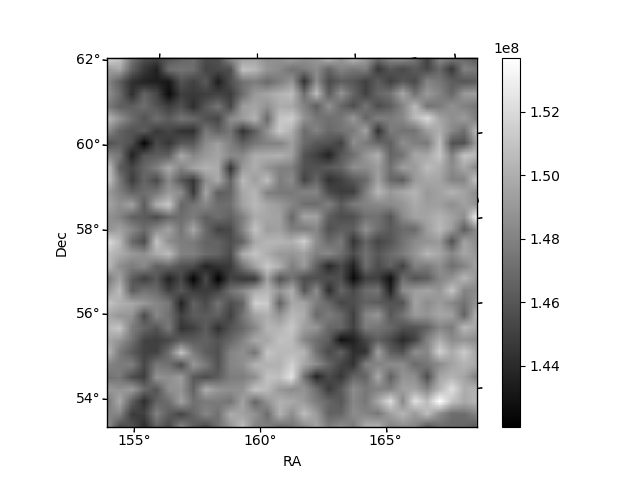
Histogram calculated using DETX and DETY for each event in the final _common_clean file
| Quadrant A |  |
 |
Quadrant B |
|---|---|---|---|
| Quadrant D | 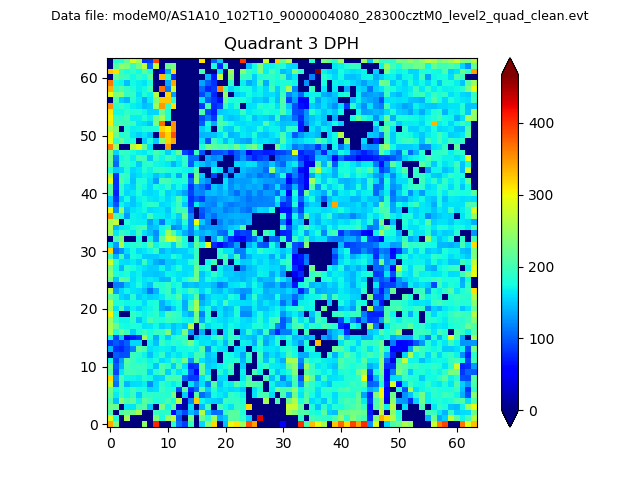 |
 |
Quadrant C |
| Plot type | Count rate plots | Images |
|---|---|---|
| Comparison with Poisson distribution Blue bars denote a histogram of data divided into 1 sec bins. Red curve is a Poisson curve with rate = median count rate of data. |
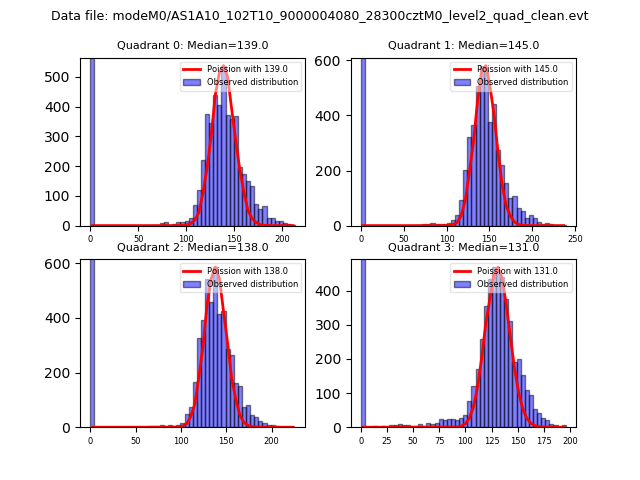 |
 |
| Quadrant-wise count rates Data is divided into 100 sec bins |
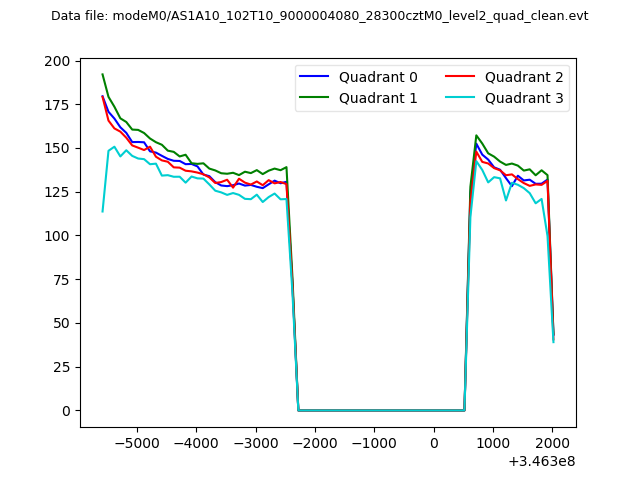 |
|
| Module-wise count rates for Quadrant A Data is divided into 100 sec bins |
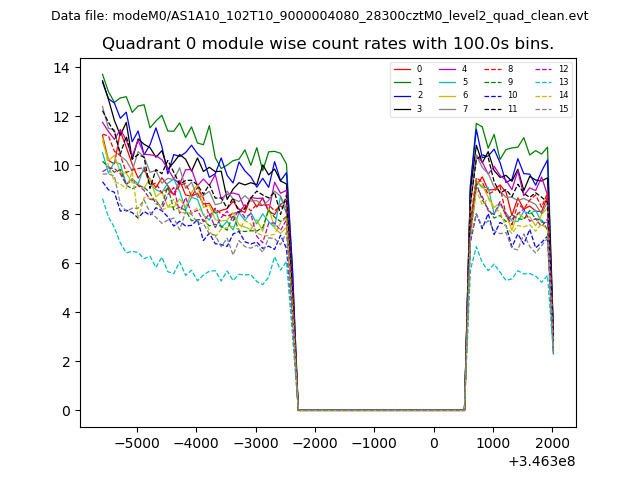 |
 |
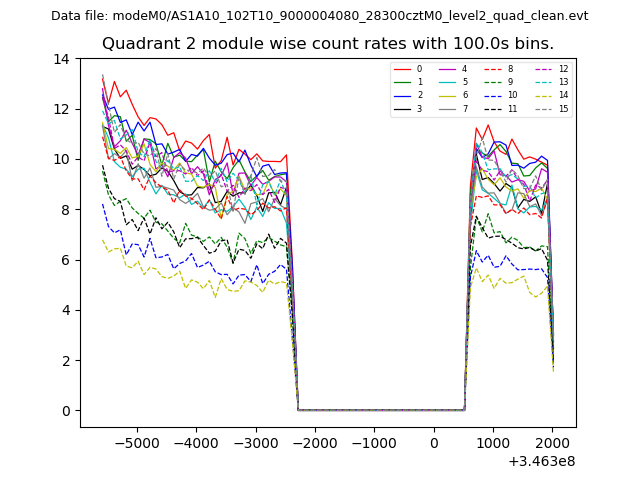
| Module-wise count rates for Quadrant B Data is divided into 100 sec bins |
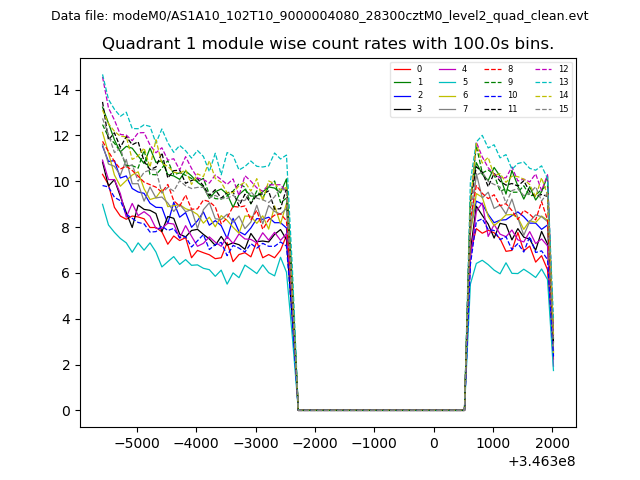 |
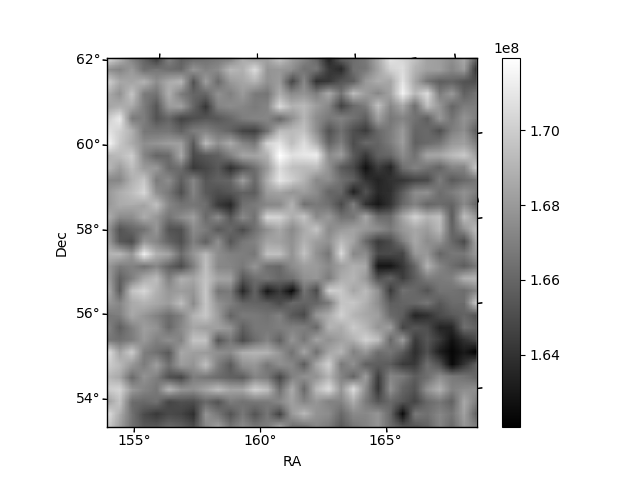 |
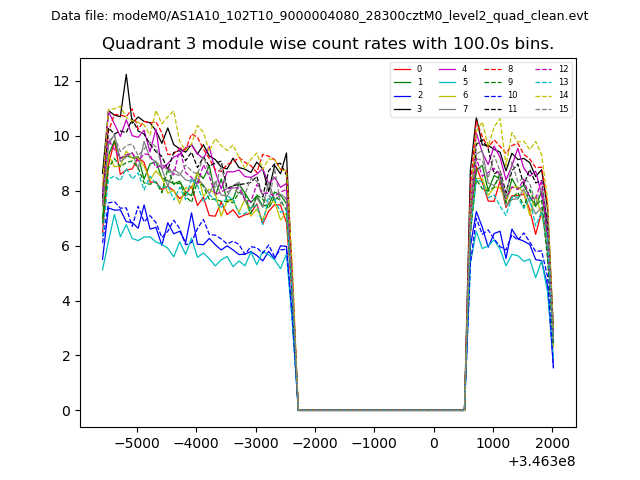
| Module-wise count rates for Quadrant C Data is divided into 100 sec bins |
 |
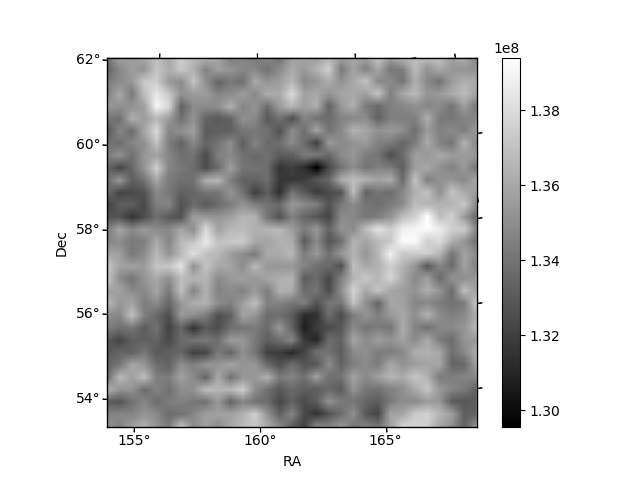 |
| Module-wise count rates for Quadrant D Data is divided into 100 sec bins |
 |
 |
| Parameter | Plot |
|---|---|
| CZT HV Monitor | 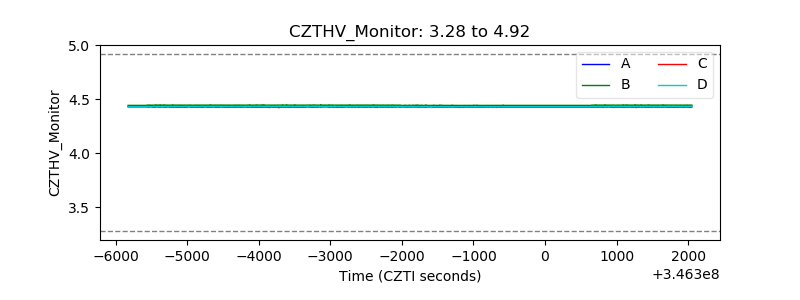 |
| D_VDD | 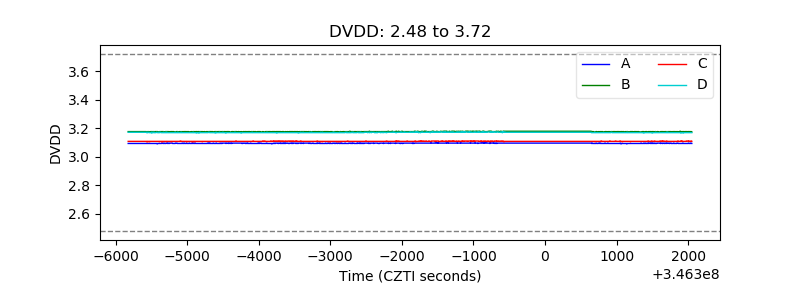 |
| Temperature 1 | 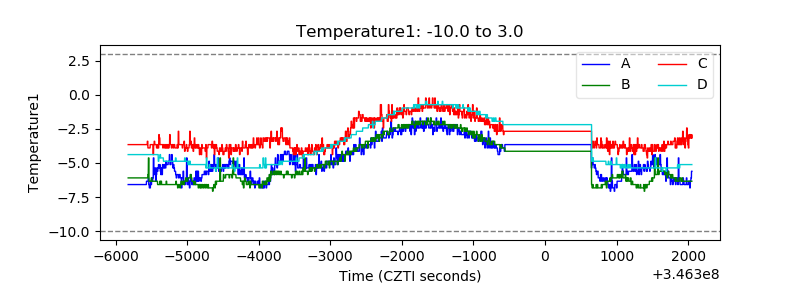 |
| Veto HV Monitor | 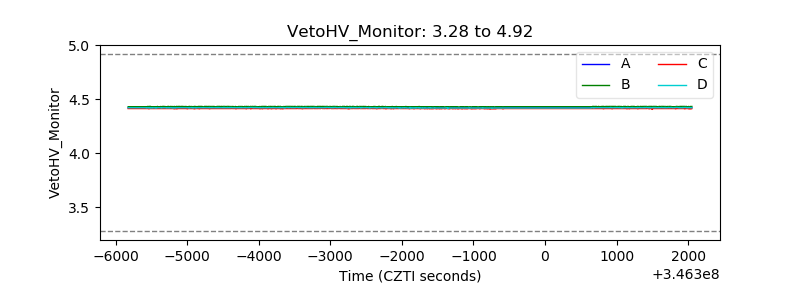 |
| Veto LLD |  |
| Alpha Counter | 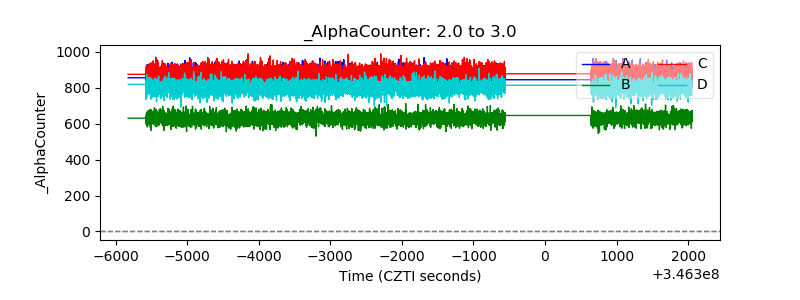 |
| _CPM_Rate | 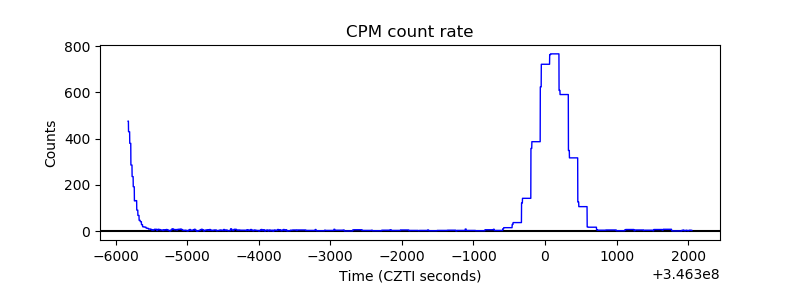 |
| CZT Counter | 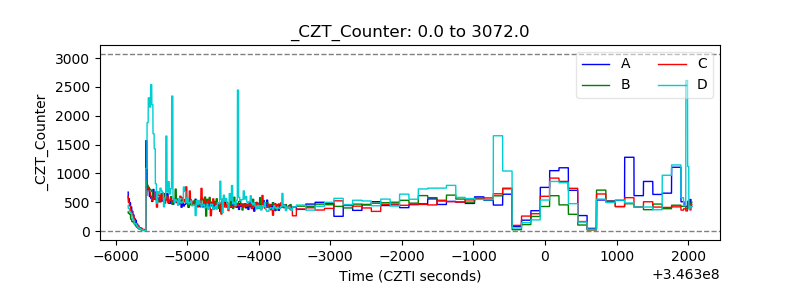 |
| +2.5 Volts monitor |  |
| +5 Volts monitor | 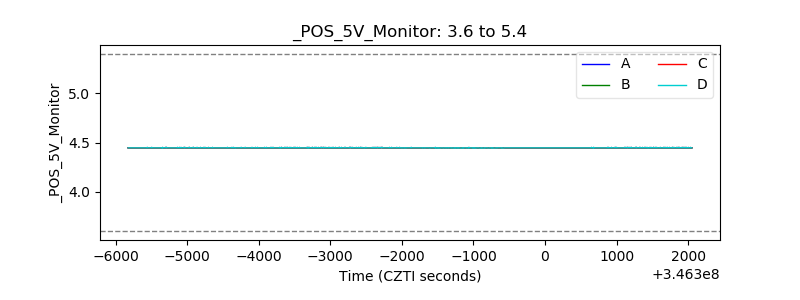 |
| _ROLL_ROT | 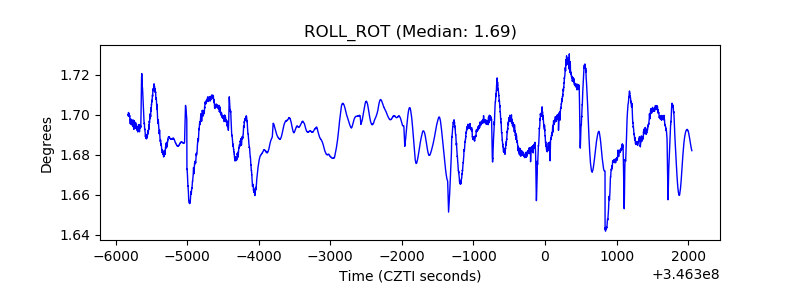 |
| _Roll_DEC | 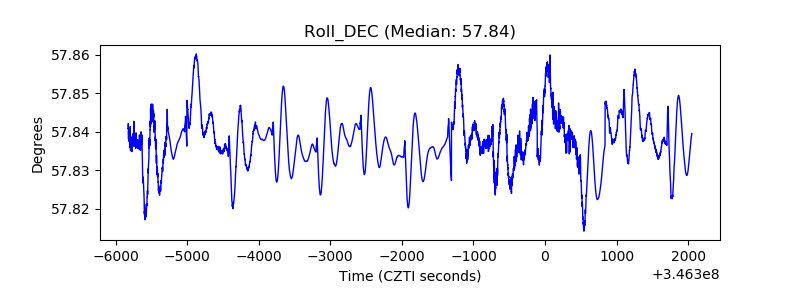 |
| _Roll_RA | 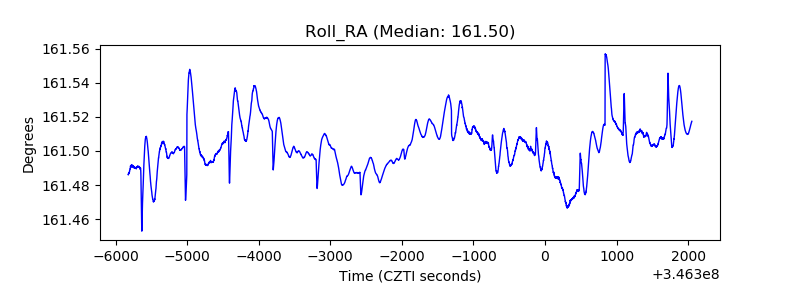 |
| Veto Counter | 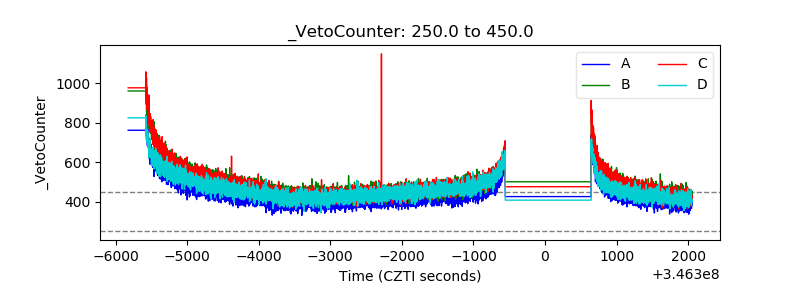 |