| Param | Original file | Final file |
|---|---|---|
| Filename | modeM0/AS1A10_102T10_9000004080_28301cztM0_level2.evt | modeM0/AS1A10_102T10_9000004080_28301cztM0_level2_quad_clean.evt |
| Size (bytes) | 237,228,480 | 32,132,160 |
| Size | 226.2 MB | 30.6 MB |
| Events in quadrant A | 1,909,825 | 175,839 |
| Events in quadrant B | 1,746,783 | 193,591 |
| Events in quadrant C | 1,582,240 | 190,287 |
| Events in quadrant D | 1,709,739 | 168,758 |
| Mode M0 | |||
|---|---|---|---|
| Quadrant | BADHDUFLAG | Total packets | Discarded packets |
| A | 0 | 7626 | 0 |
| B | 0 | 7228 | 0 |
| C | 0 | 6757 | 0 |
| D | 0 | 7177 | 0 |
| Mode M9 | |||
|---|---|---|---|
| Quadrant | BADHDUFLAG | Total packets | Discarded packets |
| A | 0 | 7 | 5 |
| B | 0 | 7 | 4 |
| C | 0 | 8 | 5 |
| D | 0 | 8 | 7 |
| Quadrant | Total seconds | Saturated seconds | Saturation percentage |
|---|---|---|---|
| A | 3161 | 37 | 1.170516% |
| B | 3257 | 57 | 1.750077% |
| C | 3299 | 36 | 1.091240% |
| D | 3161 | 34 | 1.075609% |
Noise dominated data is calculated using 1-second bins in cleaned event files. If a bin has >2000 counts, and if more than 50% of those come from <1% of pixels, then it is considered to be noise-dominated and hence unusable.
| Quadrant | # 1 sec bins | Bins with >0 counts | Bins with >2000 counts | High rate bins dominated by noise | Noise dominated (total time) | Noise dominated (detector-on time) | Marked lightcurve |
|---|---|---|---|---|---|---|---|
| A | 7346 | 3628 | 14 | 14 | 0.19% | 0.39% | 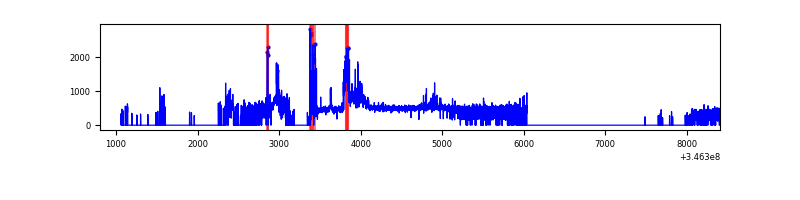 |
| B | 7346 | 3735 | 25 | 25 | 0.34% | 0.67% | 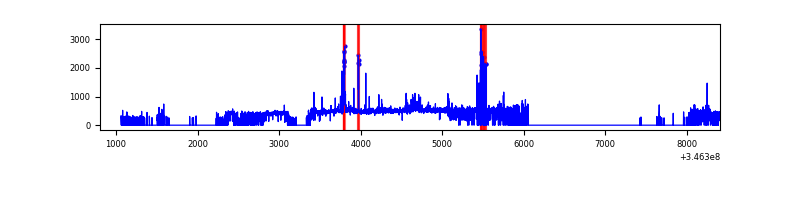 |
| C | 7604 | 3787 | 0 | 0 | 0.00% | 0.00% | 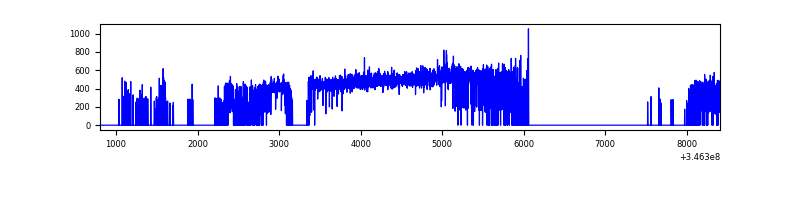 |
| D | 7556 | 3663 | 16 | 16 | 0.21% | 0.44% | 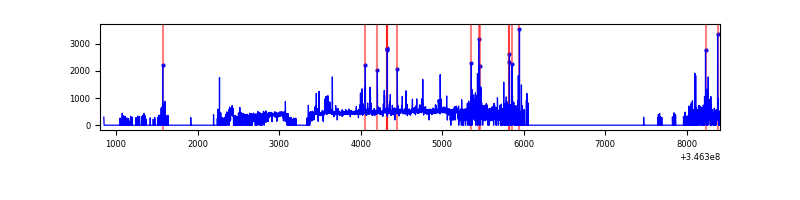 |
Top three noisy pixels from each quadrant. If the there are fewer than three noisy pixels in the level2.evt file, extra rows are filled as -1
| Pixel properties | Quadrant properties | ||||||
|---|---|---|---|---|---|---|---|
| Quadrant | DetID | PixID | Counts | Sigma | Mean | Median | Sigma |
| A | 15 | 174 | 422348 | 5358.54 | 385 | 377 | 78.7 |
| A | 13 | 254 | 5690 | 67.47 | 385 | 377 | 78.7 |
| A | 3 | 137 | 3737 | 42.67 | 385 | 377 | 78.7 |
| B | 10 | 245 | 164057 | 2179.63 | 390 | 380 | 75.1 |
| B | 4 | 200 | 35790 | 471.54 | 390 | 380 | 75.1 |
| B | 12 | 111 | 8869 | 113.05 | 390 | 380 | 75.1 |
| C | 14 | 238 | 61794 | 685.16 | 382 | 384 | 89.6 |
| C | 3 | 233 | 28443 | 313.06 | 382 | 384 | 89.6 |
| C | 13 | 61 | 2665 | 25.45 | 382 | 384 | 89.6 |
| D | 8 | 195 | 99347 | 1109.47 | 369 | 358 | 89.2 |
| D | 2 | 250 | 78045 | 870.72 | 369 | 358 | 89.2 |
| D | 2 | 82 | 50039 | 556.83 | 369 | 358 | 89.2 |
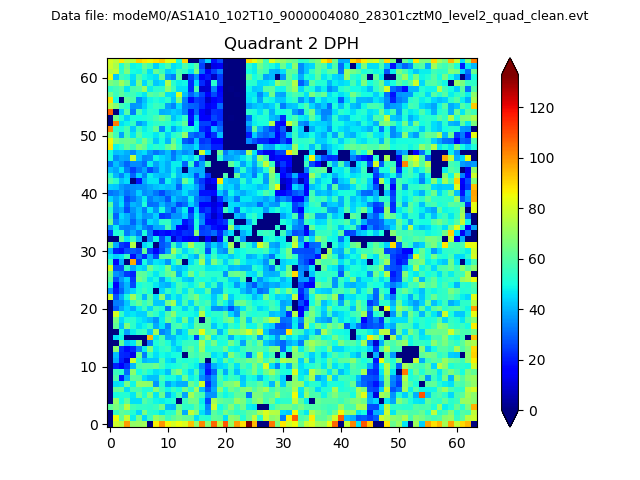
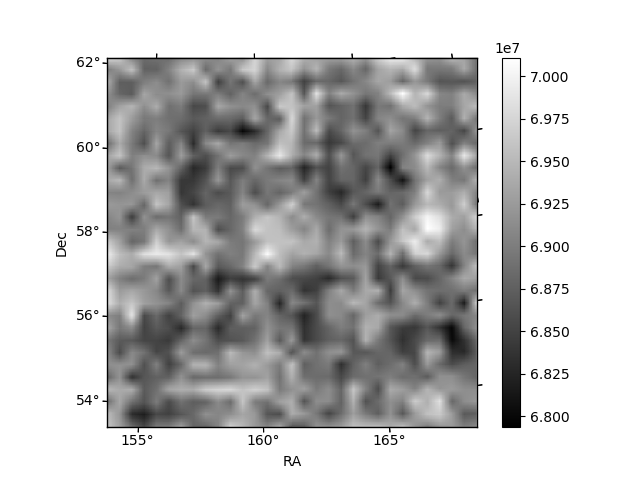
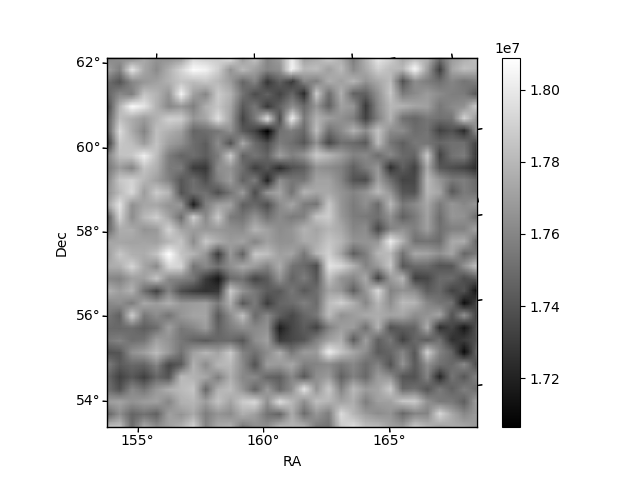
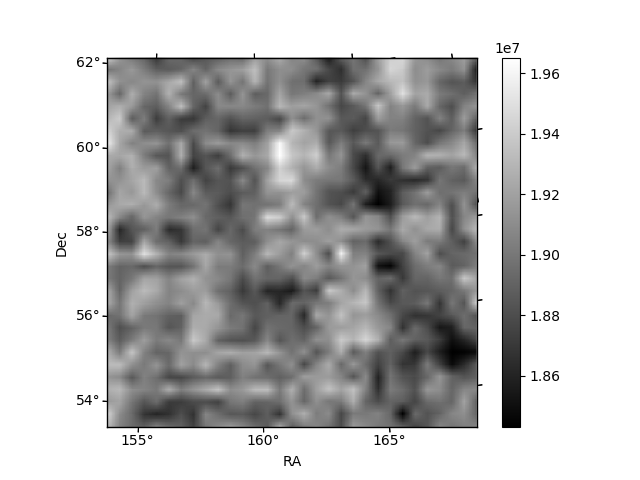
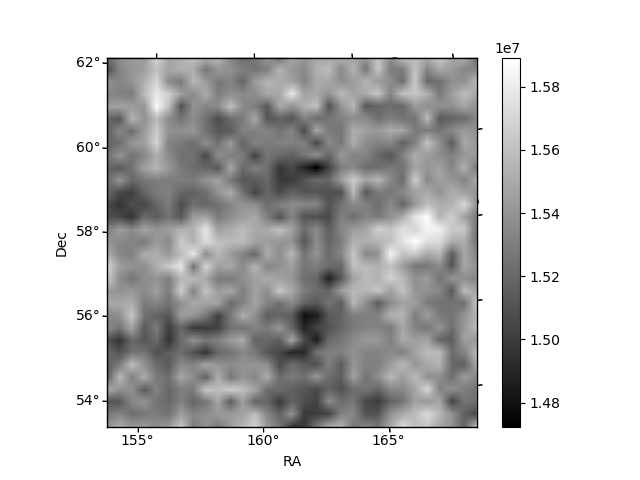
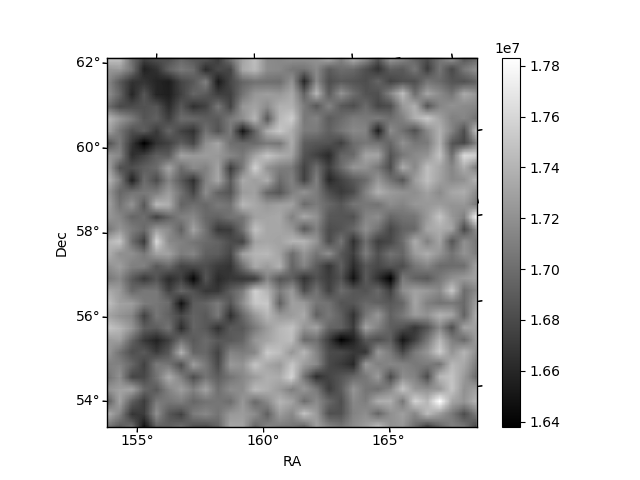
Histogram calculated using DETX and DETY for each event in the final _common_clean file
| Quadrant A | 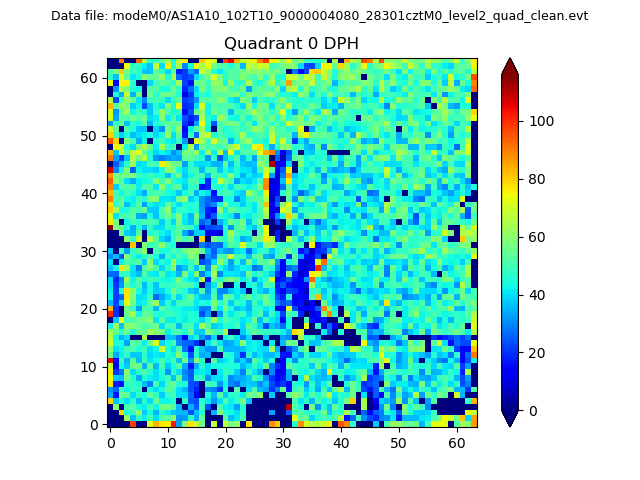 |
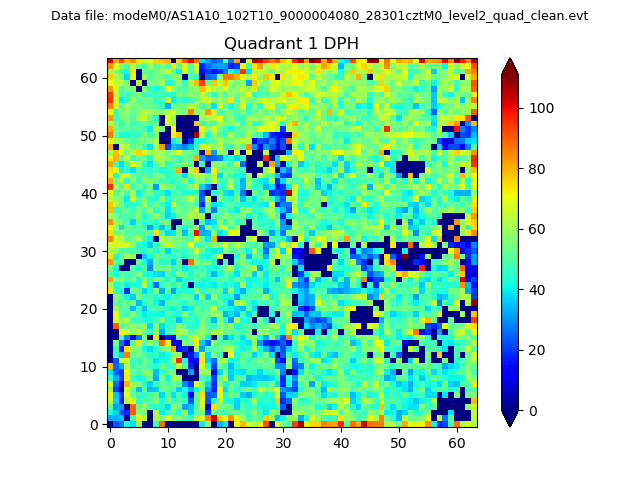 |
Quadrant B |
|---|---|---|---|
| Quadrant D | 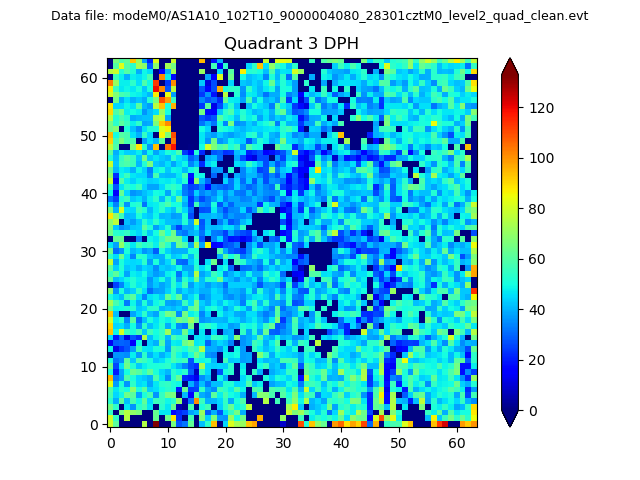 |
 |
Quadrant C |
| Plot type | Count rate plots | Images |
|---|---|---|
| Comparison with Poisson distribution Blue bars denote a histogram of data divided into 1 sec bins. Red curve is a Poisson curve with rate = median count rate of data. |
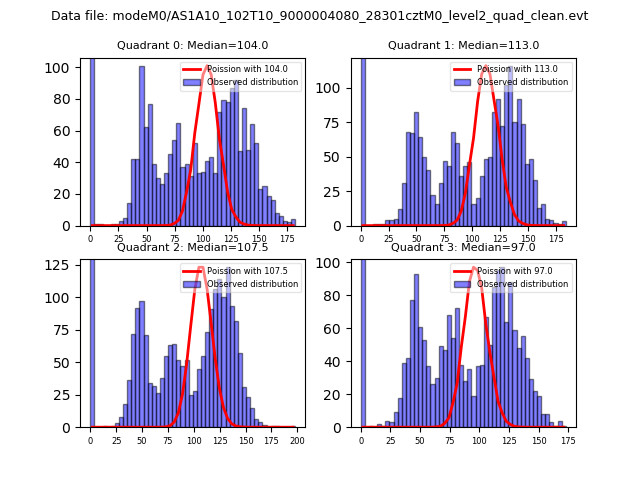 |
 |
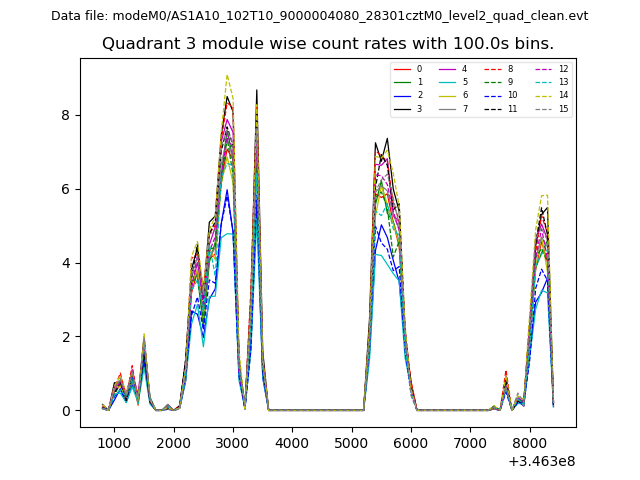
| Quadrant-wise count rates Data is divided into 100 sec bins |
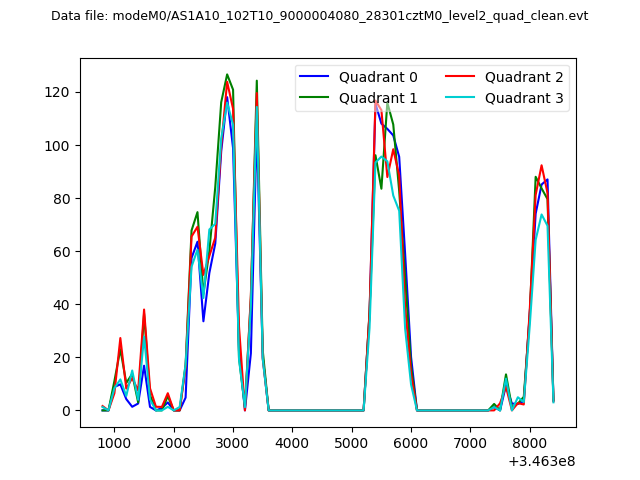 |
|
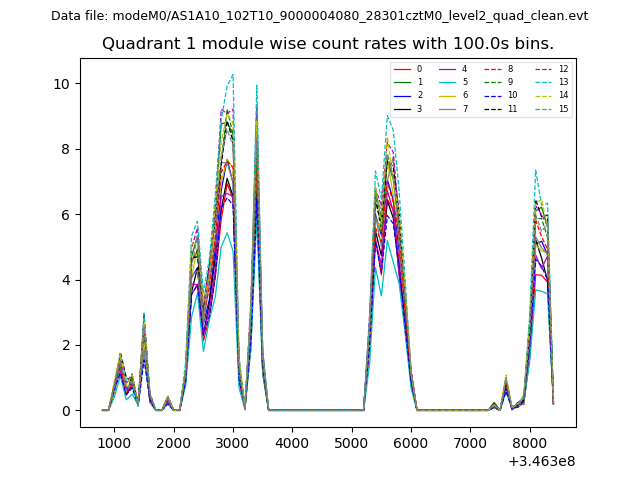
| Module-wise count rates for Quadrant A Data is divided into 100 sec bins |
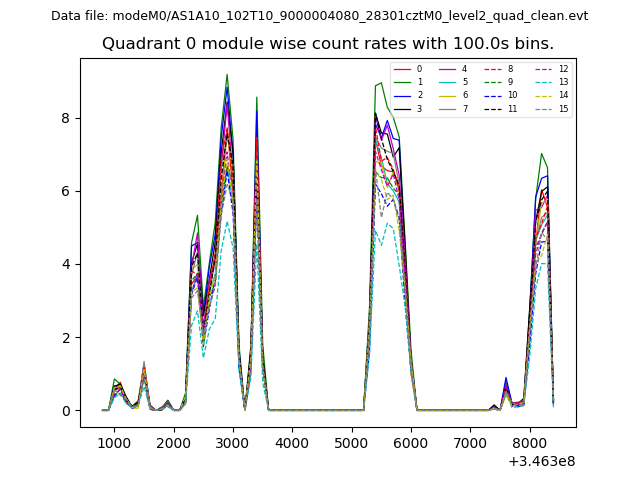 |
 |
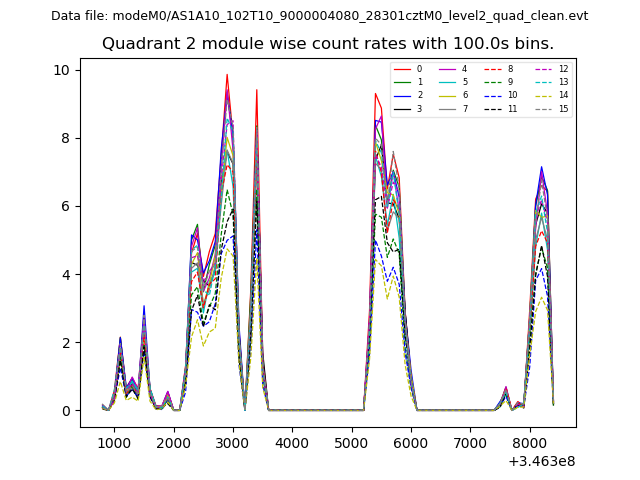
| Module-wise count rates for Quadrant B Data is divided into 100 sec bins |
 |
 |
| Module-wise count rates for Quadrant C Data is divided into 100 sec bins |
 |
 |
| Module-wise count rates for Quadrant D Data is divided into 100 sec bins |
 |
 |
| Parameter | Plot |
|---|---|
| CZT HV Monitor | 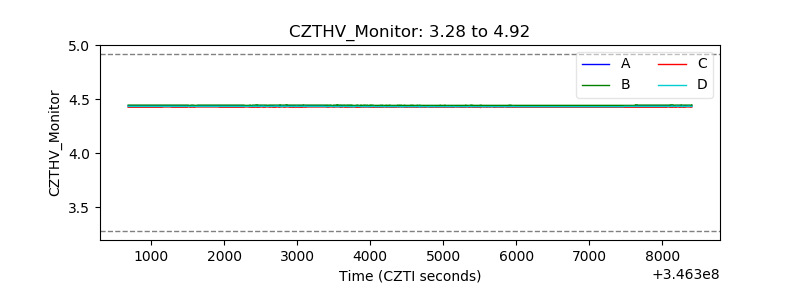 |
| D_VDD | 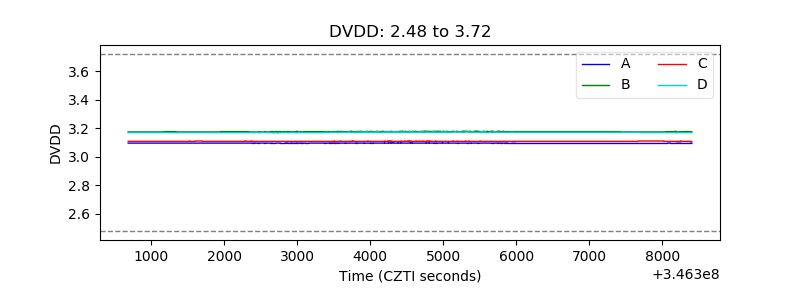 |
| Temperature 1 | 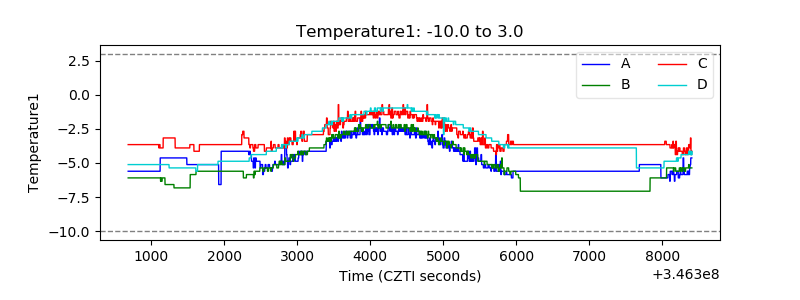 |
| Veto HV Monitor | 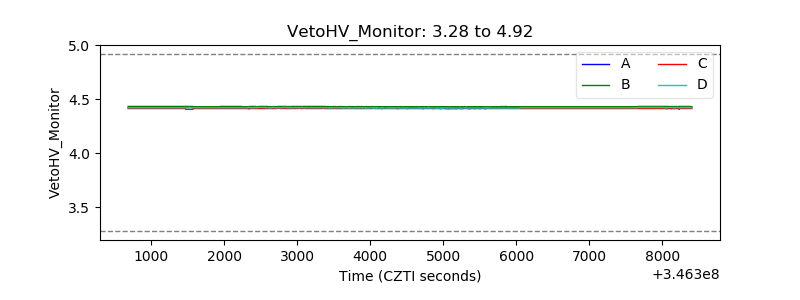 |
| Veto LLD |  |
| Alpha Counter | 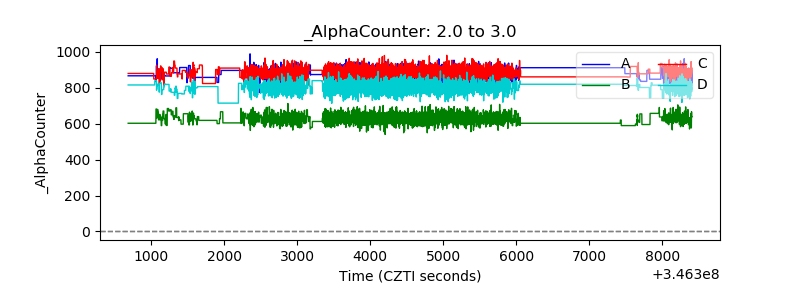 |
| _CPM_Rate | 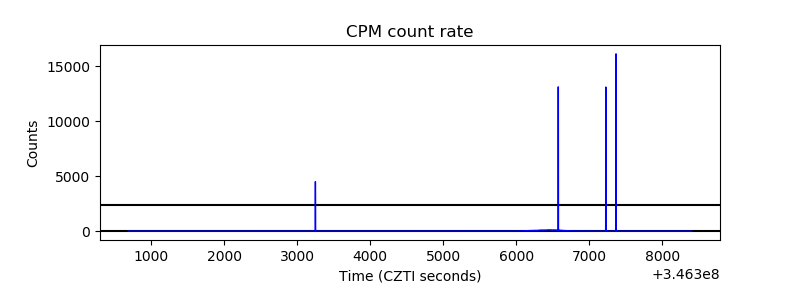 |
| CZT Counter | 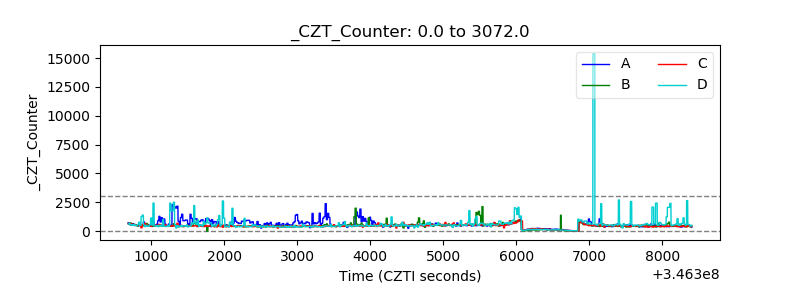 |
| +2.5 Volts monitor |  |
| +5 Volts monitor | 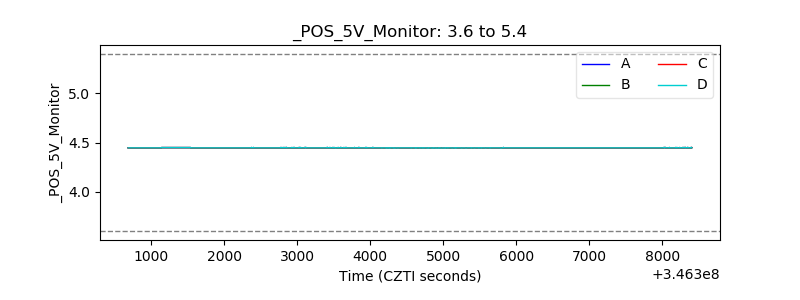 |
| _ROLL_ROT |  |
| _Roll_DEC | 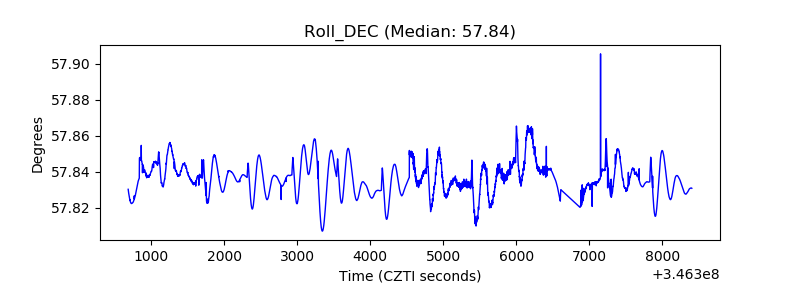 |
| _Roll_RA | 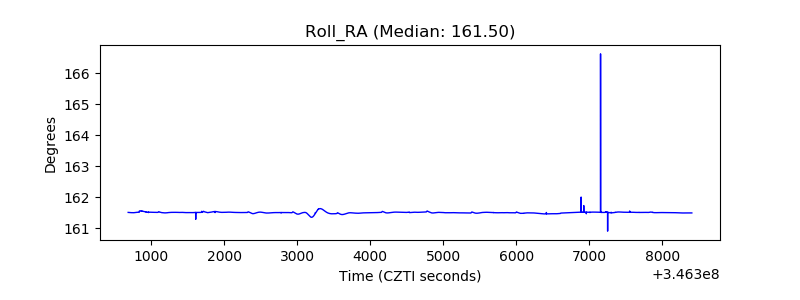 |
| Veto Counter |  |