| Param | Original file | Final file |
|---|---|---|
| Filename | modeM0/AS1A10_102T10_9000004080_28302cztM0_level2.evt | modeM0/AS1A10_102T10_9000004080_28302cztM0_level2_quad_clean.evt |
| Size (bytes) | 999,011,520 | 188,228,160 |
| Size | 952.7 MB | 179.5 MB |
| Events in quadrant A | 7,544,969 | 1,211,527 |
| Events in quadrant B | 6,718,497 | 1,245,796 |
| Events in quadrant C | 6,222,090 | 1,202,376 |
| Events in quadrant D | 8,885,842 | 1,137,725 |
| Mode M0 | |||
|---|---|---|---|
| Quadrant | BADHDUFLAG | Total packets | Discarded packets |
| A | 0 | 30999 | 0 |
| B | 0 | 28457 | 0 |
| C | 0 | 27030 | 0 |
| D | 0 | 35502 | 0 |
| Mode M9 | |||
|---|---|---|---|
| Quadrant | BADHDUFLAG | Total packets | Discarded packets |
| A | 0 | 11 | 0 |
| B | 0 | 11 | 0 |
| C | 0 | 11 | 0 |
| D | 0 | 11 | 0 |
| Quadrant | Total seconds | Saturated seconds | Saturation percentage |
|---|---|---|---|
| A | 13068 | 317 | 2.425773% |
| B | 13069 | 316 | 2.417936% |
| C | 13069 | 267 | 2.043003% |
| D | 13069 | 705 | 5.394445% |
Noise dominated data is calculated using 1-second bins in cleaned event files. If a bin has >2000 counts, and if more than 50% of those come from <1% of pixels, then it is considered to be noise-dominated and hence unusable.
| Quadrant | # 1 sec bins | Bins with >0 counts | Bins with >2000 counts | High rate bins dominated by noise | Noise dominated (total time) | Noise dominated (detector-on time) | Marked lightcurve |
|---|---|---|---|---|---|---|---|
| A | 14123 | 13071 | 103 | 103 | 0.73% | 0.79% |  |
| B | 14124 | 13072 | 61 | 61 | 0.43% | 0.47% | 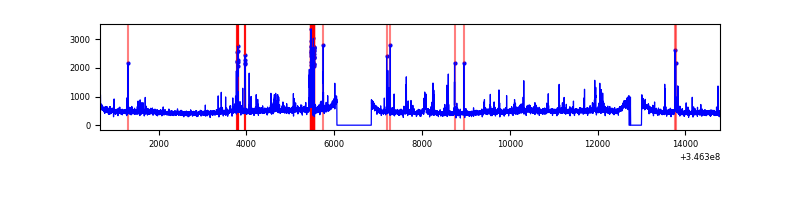 |
| C | 14124 | 13072 | 0 | 0 | 0.00% | 0.00% | 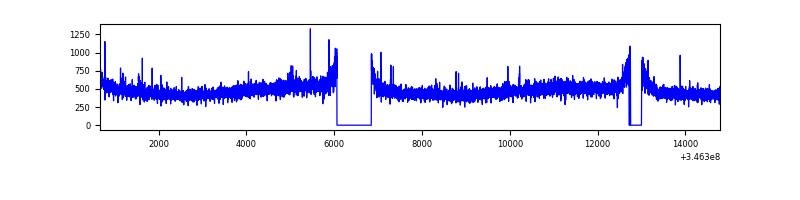 |
| D | 14124 | 13072 | 514 | 514 | 3.64% | 3.93% | 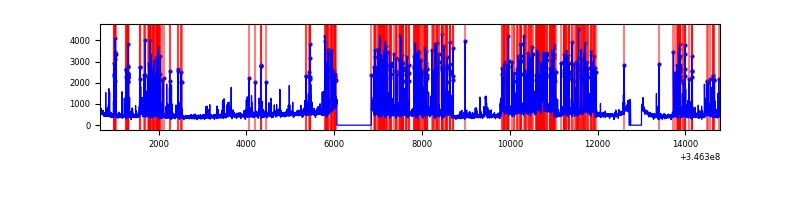 |
Top three noisy pixels from each quadrant. If the there are fewer than three noisy pixels in the level2.evt file, extra rows are filled as -1
| Pixel properties | Quadrant properties | ||||||
|---|---|---|---|---|---|---|---|
| Quadrant | DetID | PixID | Counts | Sigma | Mean | Median | Sigma |
| A | 15 | 174 | 1456573 | 4626.7 | 1576 | 1541 | 314.5 |
| A | 13 | 254 | 22031 | 65.15 | 1576 | 1541 | 314.5 |
| A | 3 | 137 | 15407 | 44.09 | 1576 | 1541 | 314.5 |
| B | 10 | 245 | 413891 | 1386.78 | 1567 | 1528 | 297.4 |
| B | 4 | 200 | 69389 | 228.22 | 1567 | 1528 | 297.4 |
| B | 10 | 246 | 66296 | 217.82 | 1567 | 1528 | 297.4 |
| C | 14 | 238 | 247612 | 704.92 | 1511 | 1517 | 349.1 |
| C | 3 | 233 | 89383 | 251.68 | 1511 | 1517 | 349.1 |
| C | 13 | 61 | 10335 | 25.26 | 1511 | 1517 | 349.1 |
| D | 8 | 195 | 1422356 | 3977.64 | 1495 | 1452 | 357.2 |
| D | 1 | 52 | 668803 | 1868.16 | 1495 | 1452 | 357.2 |
| D | 2 | 82 | 558685 | 1559.9 | 1495 | 1452 | 357.2 |
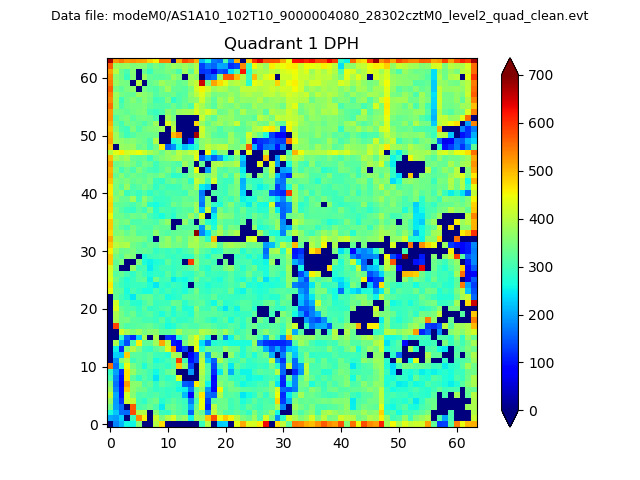
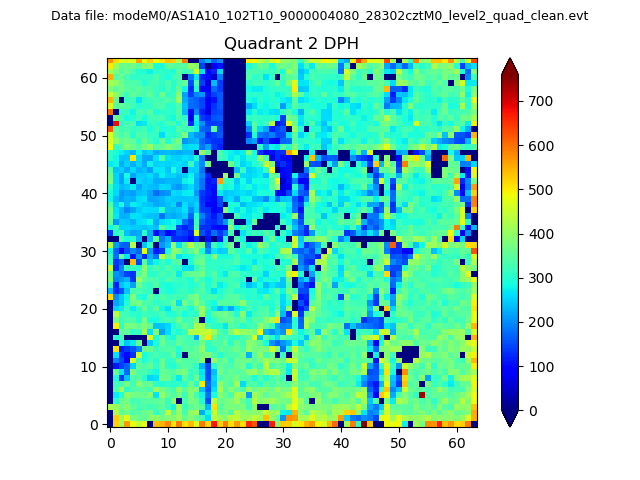
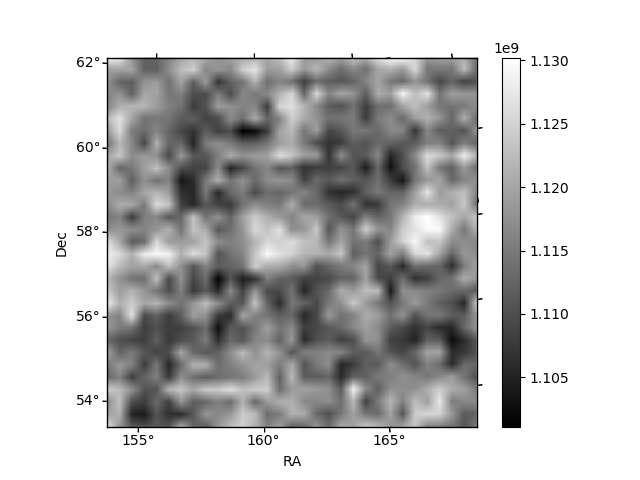
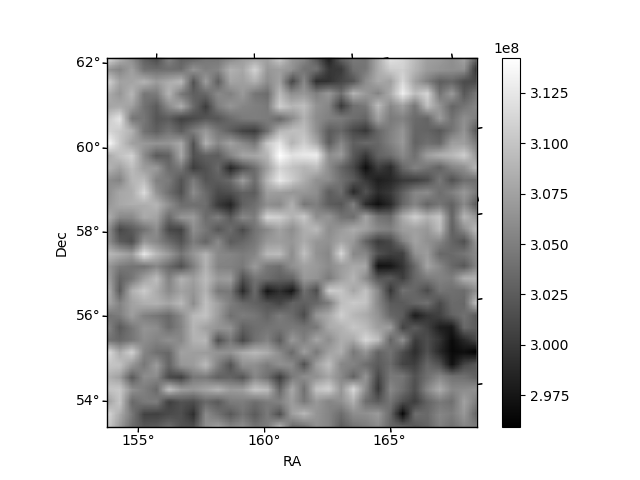
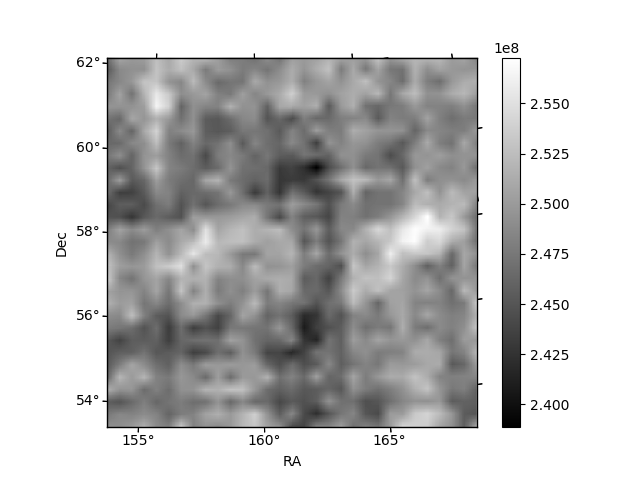
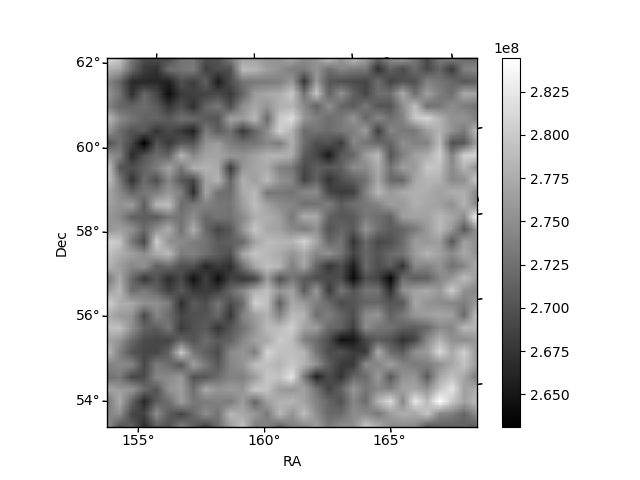
Histogram calculated using DETX and DETY for each event in the final _common_clean file
| Quadrant A | 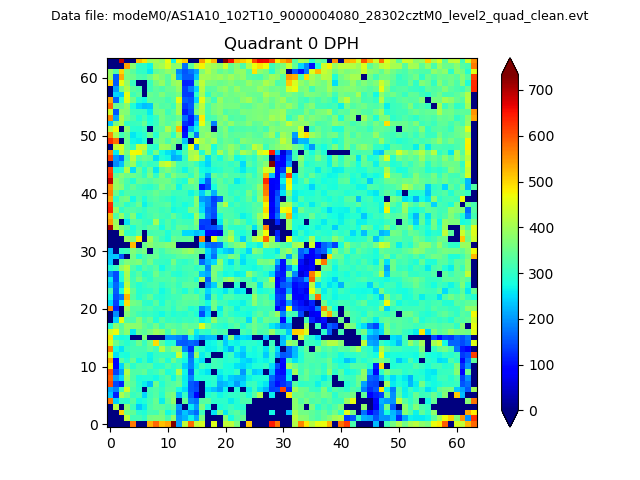 |
 |
Quadrant B |
|---|---|---|---|
| Quadrant D | 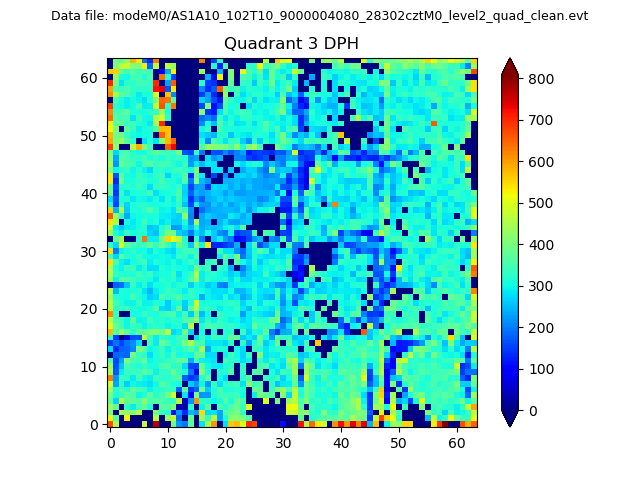 |
 |
Quadrant C |
| Plot type | Count rate plots | Images |
|---|---|---|
| Comparison with Poisson distribution Blue bars denote a histogram of data divided into 1 sec bins. Red curve is a Poisson curve with rate = median count rate of data. |
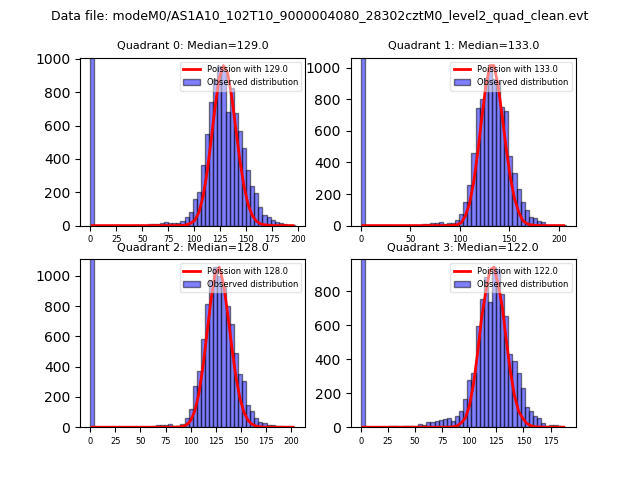 |
 |
| Quadrant-wise count rates Data is divided into 100 sec bins |
 |
|
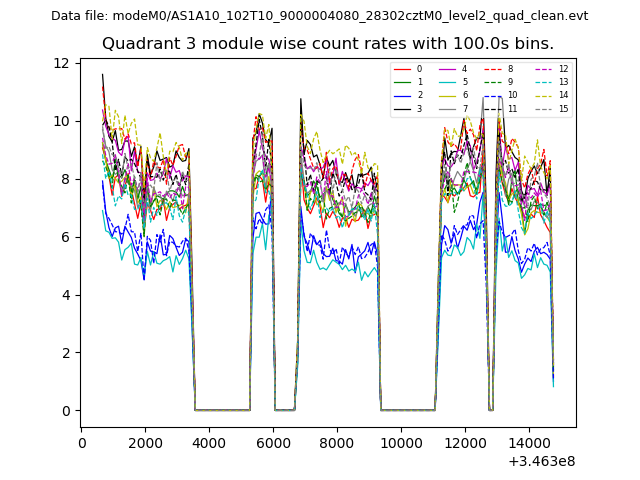
| Module-wise count rates for Quadrant A Data is divided into 100 sec bins |
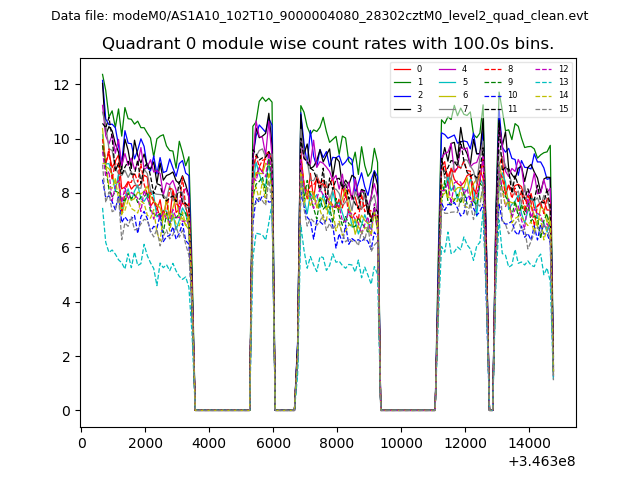 |
 |
| Module-wise count rates for Quadrant B Data is divided into 100 sec bins |
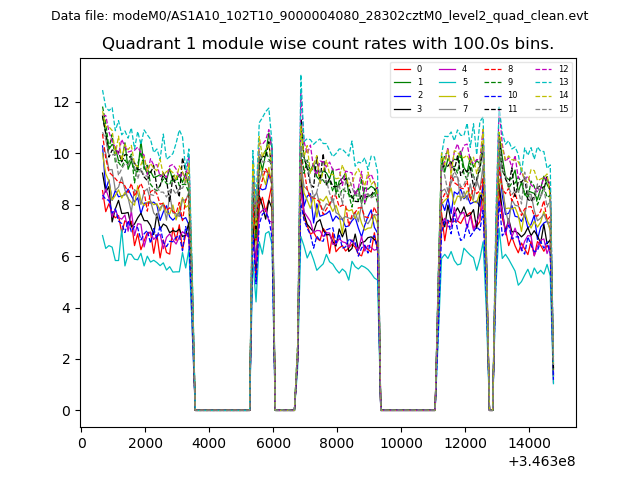 |
 |
| Module-wise count rates for Quadrant C Data is divided into 100 sec bins |
 |
 |
| Module-wise count rates for Quadrant D Data is divided into 100 sec bins |
 |
 |
| Parameter | Plot |
|---|---|
| CZT HV Monitor |  |
| D_VDD | 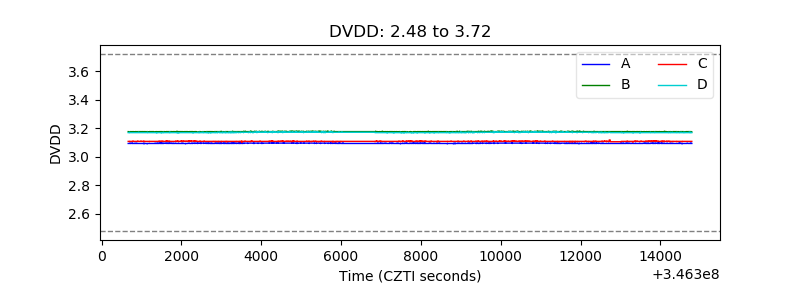 |
| Temperature 1 | 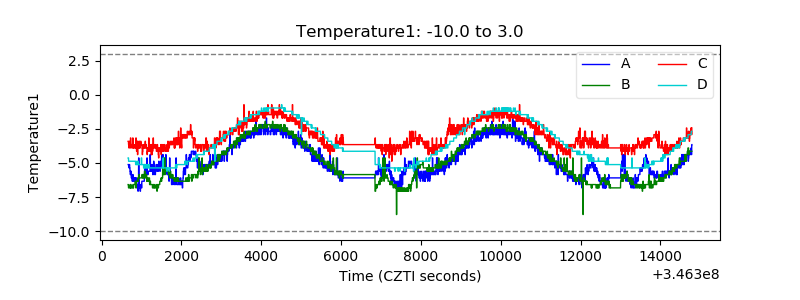 |
| Veto HV Monitor | 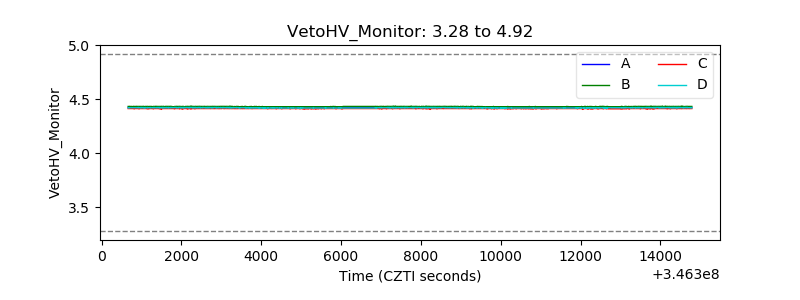 |
| Veto LLD | 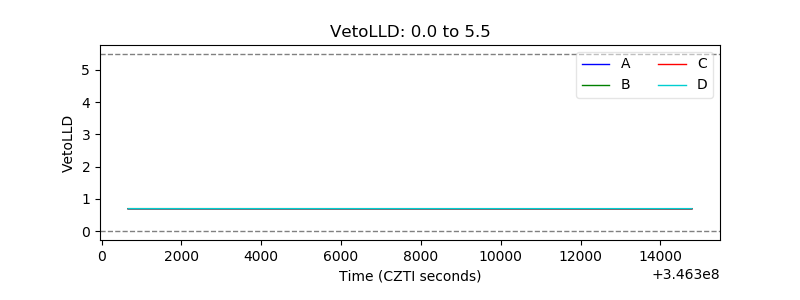 |
| Alpha Counter | 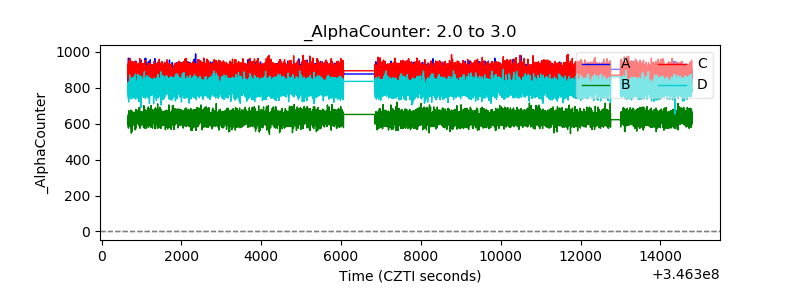 |
| _CPM_Rate | 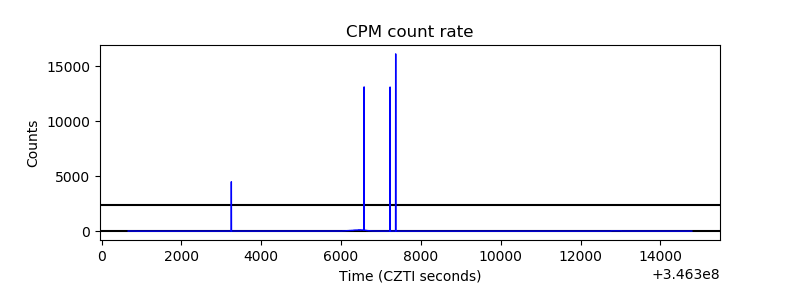 |
| CZT Counter | 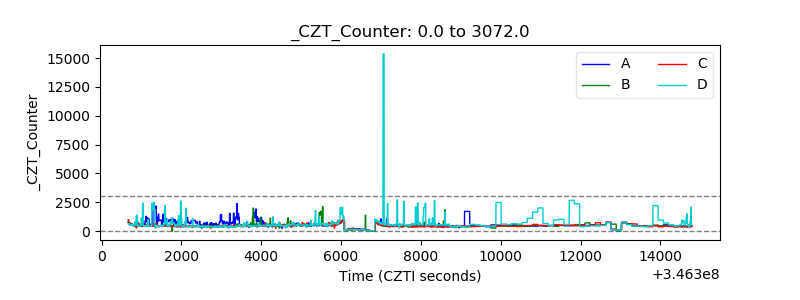 |
| +2.5 Volts monitor |  |
| +5 Volts monitor |  |
| _ROLL_ROT | 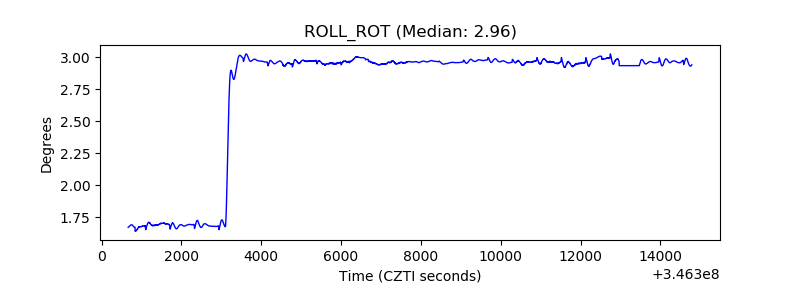 |
| _Roll_DEC | 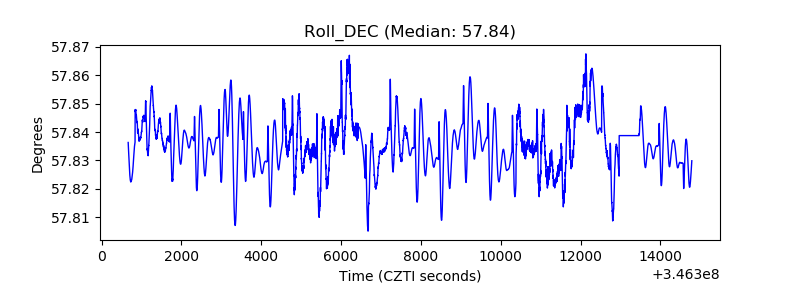 |
| _Roll_RA | 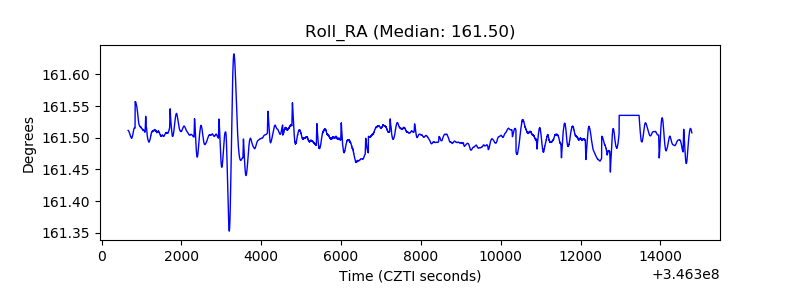 |
| Veto Counter | 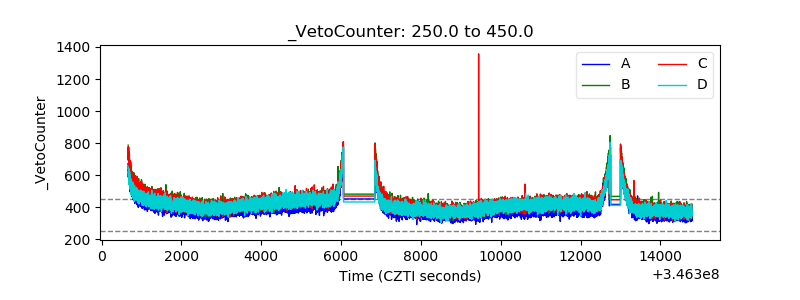 |