| Param | Original file | Final file |
|---|---|---|
| Filename | modeM0/AS1A10_102T10_9000004080_28303cztM0_level2.evt | modeM0/AS1A10_102T10_9000004080_28303cztM0_level2_quad_clean.evt |
| Size (bytes) | 562,337,280 | 113,279,040 |
| Size | 536.3 MB | 108.0 MB |
| Events in quadrant A | 3,512,979 | 735,924 |
| Events in quadrant B | 3,685,712 | 749,019 |
| Events in quadrant C | 3,528,907 | 721,586 |
| Events in quadrant D | 5,782,687 | 691,097 |
| Mode M0 | |||
|---|---|---|---|
| Quadrant | BADHDUFLAG | Total packets | Discarded packets |
| A | 0 | 15712 | 0 |
| B | 0 | 16023 | 0 |
| C | 0 | 15676 | 0 |
| D | 0 | 22536 | 0 |
| Quadrant | Total seconds | Saturated seconds | Saturation percentage |
|---|---|---|---|
| A | 7660 | 135 | 1.762402% |
| B | 7660 | 149 | 1.945170% |
| C | 7660 | 119 | 1.553525% |
| D | 7660 | 525 | 6.853786% |
Noise dominated data is calculated using 1-second bins in cleaned event files. If a bin has >2000 counts, and if more than 50% of those come from <1% of pixels, then it is considered to be noise-dominated and hence unusable.
| Quadrant | # 1 sec bins | Bins with >0 counts | Bins with >2000 counts | High rate bins dominated by noise | Noise dominated (total time) | Noise dominated (detector-on time) | Marked lightcurve |
|---|---|---|---|---|---|---|---|
| A | 7660 | 7660 | 0 | 0 | 0.00% | 0.00% | 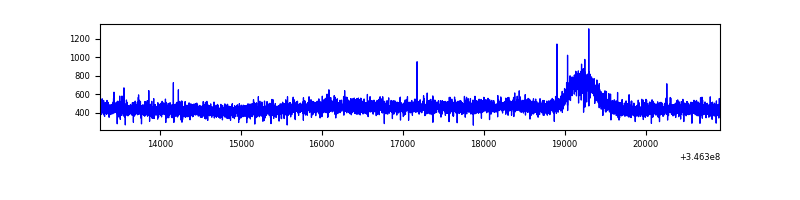 |
| B | 7660 | 7660 | 7 | 7 | 0.09% | 0.09% | 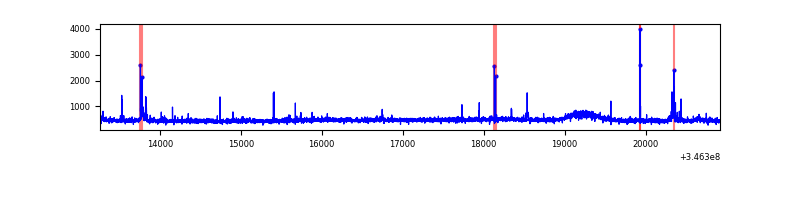 |
| C | 7660 | 7660 | 0 | 0 | 0.00% | 0.00% | 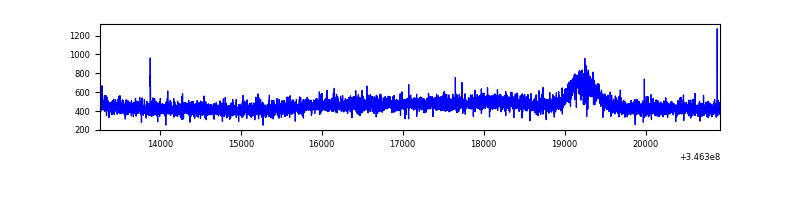 |
| D | 7660 | 7660 | 379 | 379 | 4.95% | 4.95% | 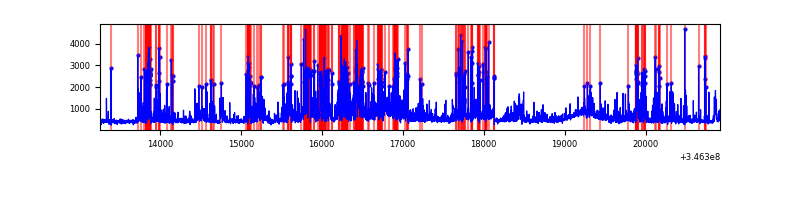 |
Top three noisy pixels from each quadrant. If the there are fewer than three noisy pixels in the level2.evt file, extra rows are filled as -1
| Pixel properties | Quadrant properties | ||||||
|---|---|---|---|---|---|---|---|
| Quadrant | DetID | PixID | Counts | Sigma | Mean | Median | Sigma |
| A | 13 | 254 | 11934 | 59.84 | 910 | 890 | 184.6 |
| A | 3 | 137 | 9221 | 45.14 | 910 | 890 | 184.6 |
| A | 0 | 226 | 7605 | 36.38 | 910 | 890 | 184.6 |
| B | 10 | 245 | 72278 | 412.16 | 904 | 880 | 173.2 |
| B | 10 | 246 | 36940 | 208.16 | 904 | 880 | 173.2 |
| B | 12 | 111 | 21705 | 120.22 | 904 | 880 | 173.2 |
| C | 14 | 238 | 140424 | 687.59 | 868 | 872 | 203.0 |
| C | 3 | 233 | 6815 | 29.28 | 868 | 872 | 203.0 |
| C | 13 | 61 | 5966 | 25.1 | 868 | 872 | 203.0 |
| D | 1 | 52 | 1977678 | 9779.84 | 850 | 826 | 202.1 |
| D | 8 | 195 | 322930 | 1593.51 | 850 | 826 | 202.1 |
| D | 2 | 250 | 225846 | 1113.21 | 850 | 826 | 202.1 |
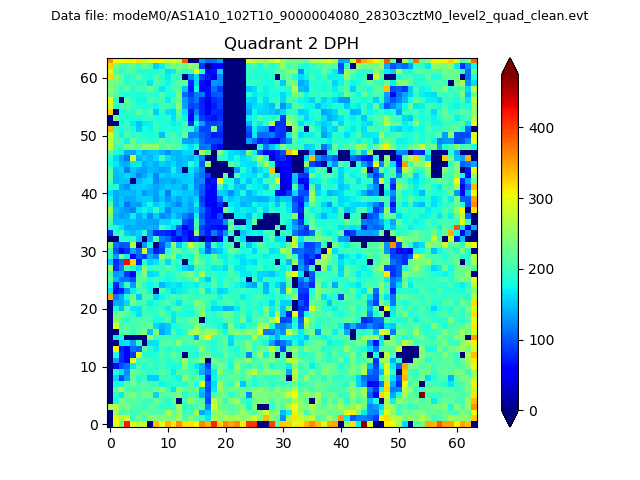
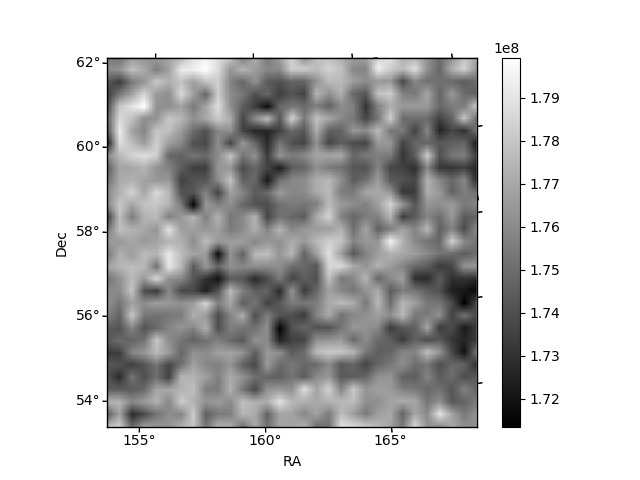
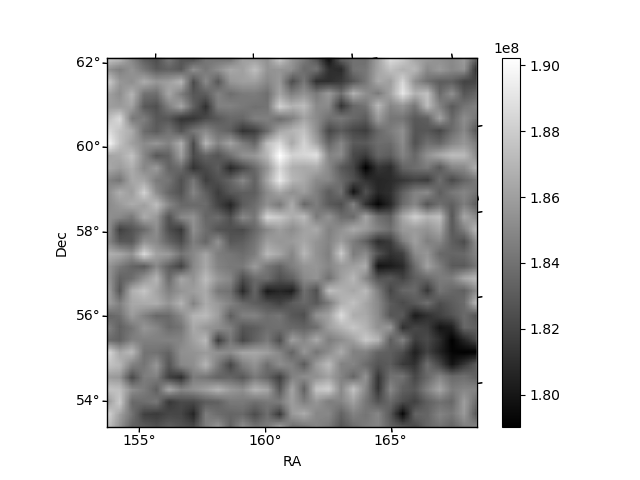
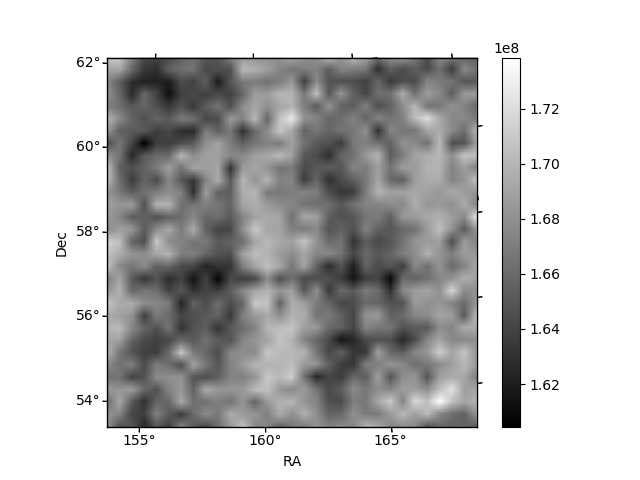
Histogram calculated using DETX and DETY for each event in the final _common_clean file
| Quadrant A |  |
 |
Quadrant B |
|---|---|---|---|
| Quadrant D | 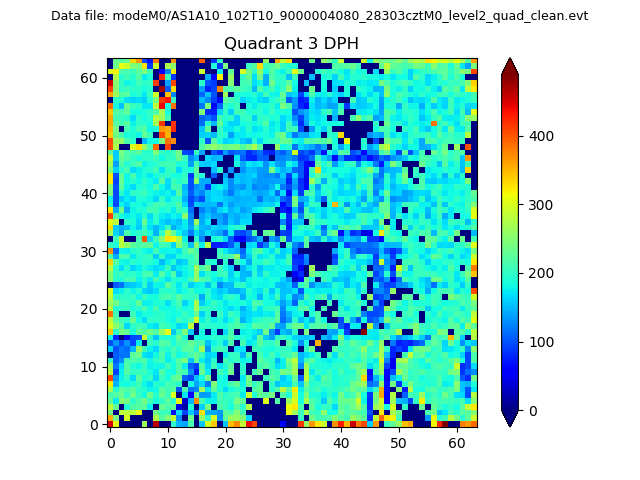 |
 |
Quadrant C |
| Plot type | Count rate plots | Images |
|---|---|---|
| Comparison with Poisson distribution Blue bars denote a histogram of data divided into 1 sec bins. Red curve is a Poisson curve with rate = median count rate of data. |
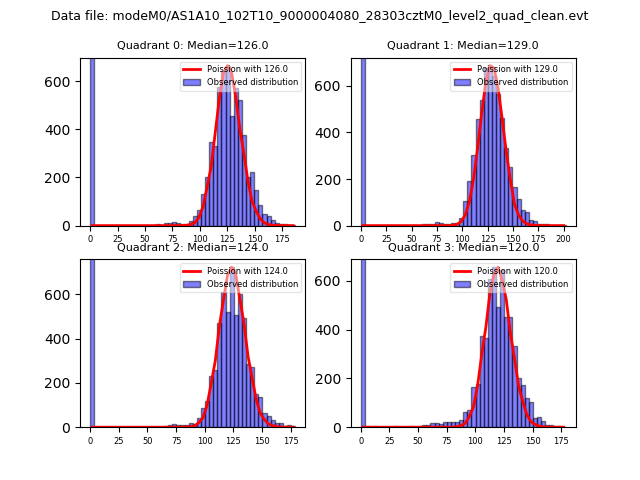 |
 |
| Quadrant-wise count rates Data is divided into 100 sec bins |
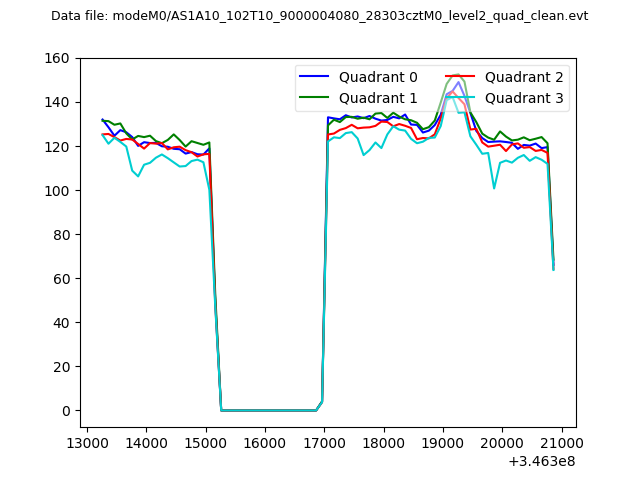 |
|
| Module-wise count rates for Quadrant A Data is divided into 100 sec bins |
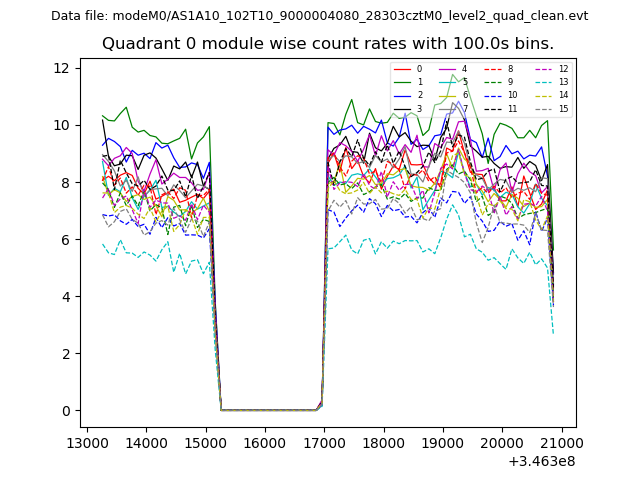 |
 |
| Module-wise count rates for Quadrant B Data is divided into 100 sec bins |
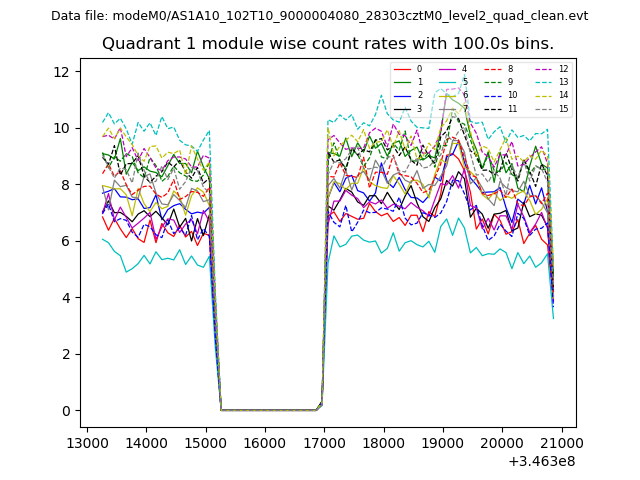 |
 |
| Module-wise count rates for Quadrant C Data is divided into 100 sec bins |
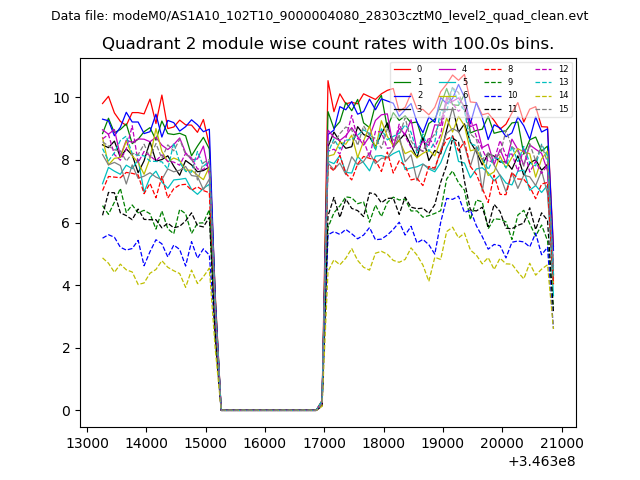 |
 |
| Module-wise count rates for Quadrant D Data is divided into 100 sec bins |
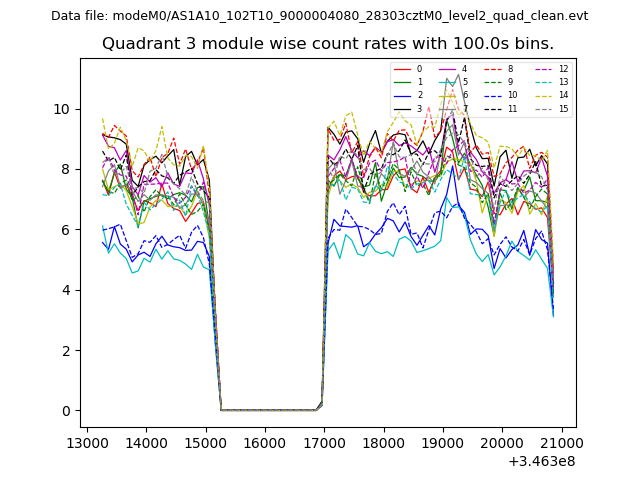 |
 |
| Parameter | Plot |
|---|---|
| CZT HV Monitor | 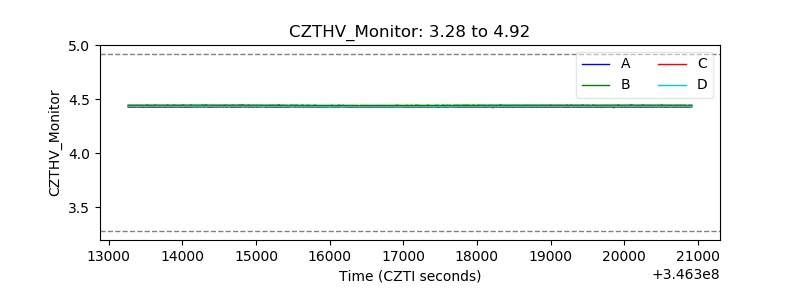 |
| D_VDD | 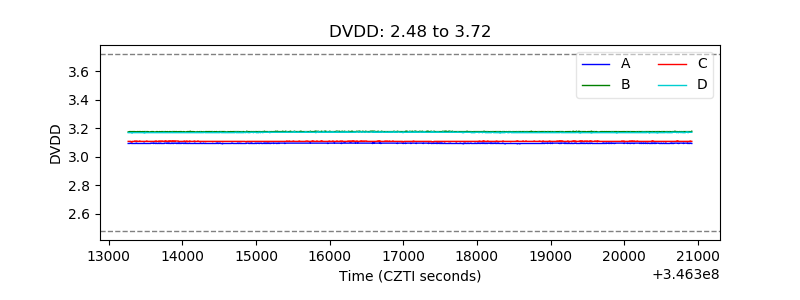 |
| Temperature 1 | 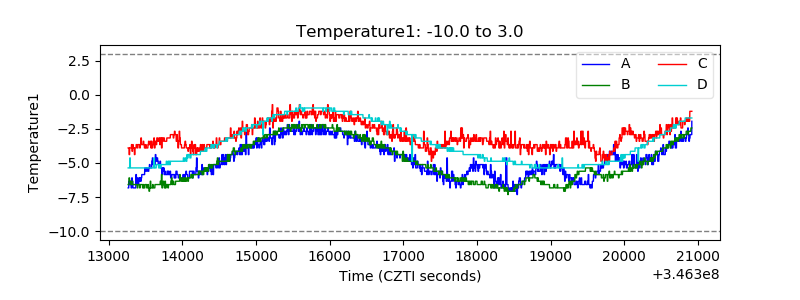 |
| Veto HV Monitor | 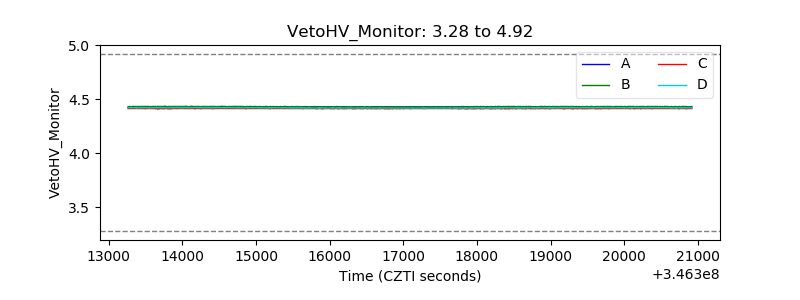 |
| Veto LLD |  |
| Alpha Counter | 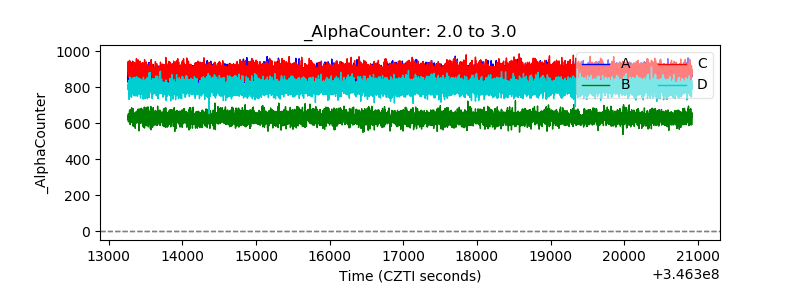 |
| _CPM_Rate | 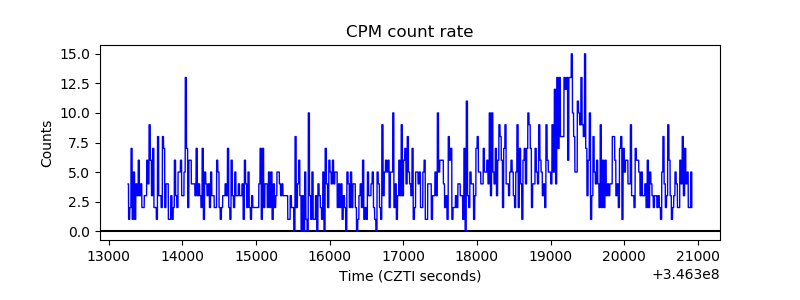 |
| CZT Counter | 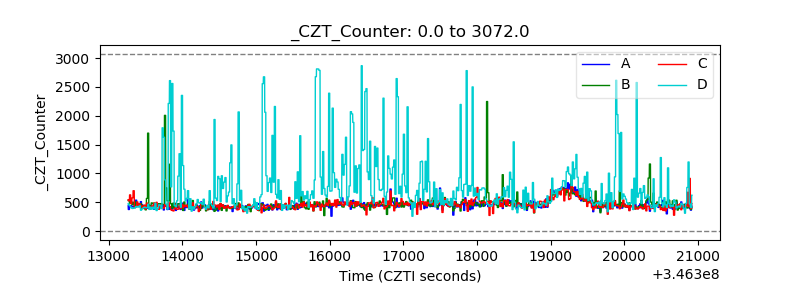 |
| +2.5 Volts monitor |  |
| +5 Volts monitor | 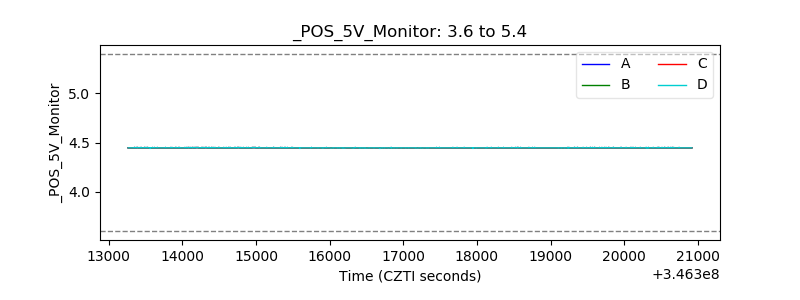 |
| _ROLL_ROT | 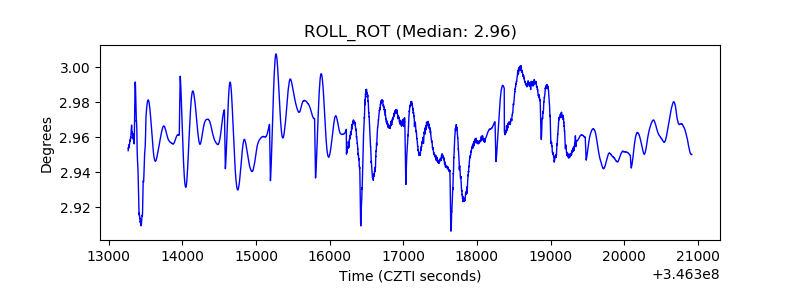 |
| _Roll_DEC | 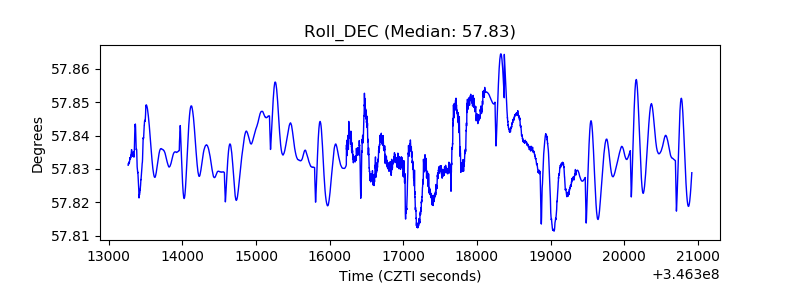 |
| _Roll_RA |  |
| Veto Counter | 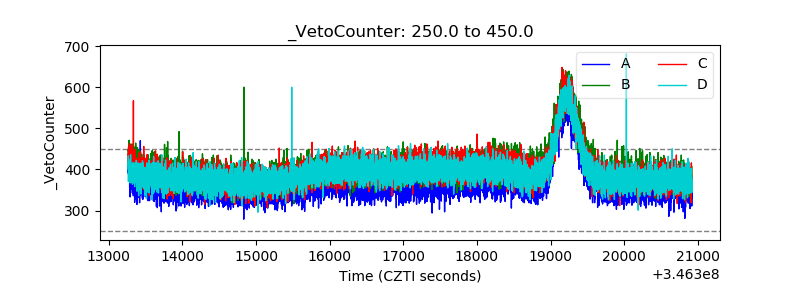 |