| Param | Original file | Final file |
|---|---|---|
| Filename | modeM0/AS1A10_102T10_9000004080_28304cztM0_level2.evt | modeM0/AS1A10_102T10_9000004080_28304cztM0_level2_quad_clean.evt |
| Size (bytes) | 575,190,720 | 92,338,560 |
| Size | 548.5 MB | 88.1 MB |
| Events in quadrant A | 3,156,317 | 596,006 |
| Events in quadrant B | 3,412,405 | 606,841 |
| Events in quadrant C | 3,194,876 | 581,862 |
| Events in quadrant D | 7,186,830 | 529,271 |
| Mode M0 | |||
|---|---|---|---|
| Quadrant | BADHDUFLAG | Total packets | Discarded packets |
| A | 0 | 14061 | 0 |
| B | 0 | 14586 | 0 |
| C | 0 | 14105 | 0 |
| D | 0 | 26185 | 0 |
| Mode M9 | |||
|---|---|---|---|
| Quadrant | BADHDUFLAG | Total packets | Discarded packets |
| A | 0 | 2 | 0 |
| B | 0 | 2 | 0 |
| C | 0 | 2 | 0 |
| D | 0 | 2 | 0 |
| Quadrant | Total seconds | Saturated seconds | Saturation percentage |
|---|---|---|---|
| A | 6913 | 87 | 1.258498% |
| B | 6914 | 115 | 1.663292% |
| C | 6914 | 89 | 1.287243% |
| D | 6914 | 1108 | 16.025456% |
Noise dominated data is calculated using 1-second bins in cleaned event files. If a bin has >2000 counts, and if more than 50% of those come from <1% of pixels, then it is considered to be noise-dominated and hence unusable.
| Quadrant | # 1 sec bins | Bins with >0 counts | Bins with >2000 counts | High rate bins dominated by noise | Noise dominated (total time) | Noise dominated (detector-on time) | Marked lightcurve |
|---|---|---|---|---|---|---|---|
| A | 7163 | 6913 | 0 | 0 | 0.00% | 0.00% | 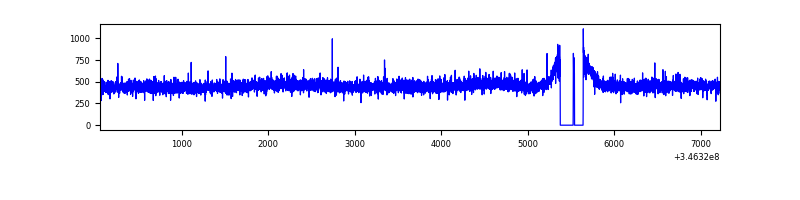 |
| B | 7164 | 6916 | 11 | 11 | 0.15% | 0.16% | 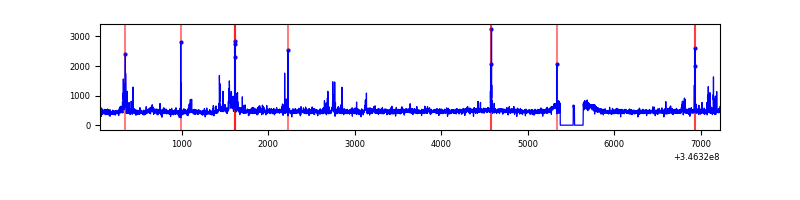 |
| C | 7164 | 6916 | 0 | 0 | 0.00% | 0.00% | 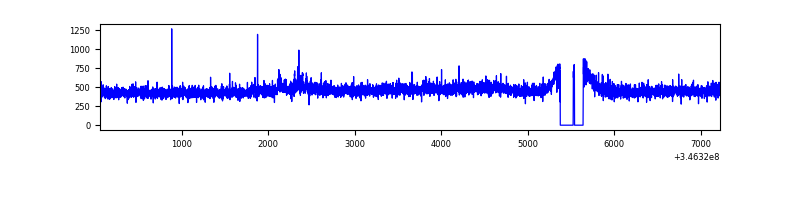 |
| D | 7164 | 6914 | 829 | 829 | 11.57% | 11.99% | 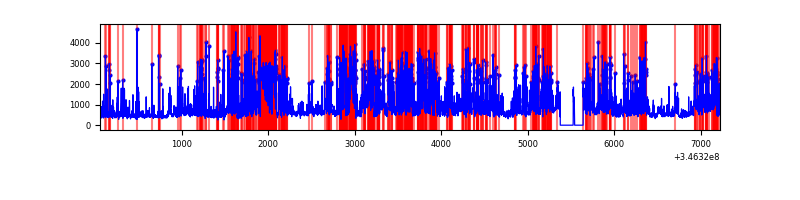 |
Top three noisy pixels from each quadrant. If the there are fewer than three noisy pixels in the level2.evt file, extra rows are filled as -1
| Pixel properties | Quadrant properties | ||||||
|---|---|---|---|---|---|---|---|
| Quadrant | DetID | PixID | Counts | Sigma | Mean | Median | Sigma |
| A | 13 | 254 | 10102 | 56.19 | 818 | 799 | 165.5 |
| A | 3 | 137 | 8254 | 45.03 | 818 | 799 | 165.5 |
| A | 0 | 226 | 7017 | 37.56 | 818 | 799 | 165.5 |
| B | 10 | 245 | 105371 | 671.29 | 810 | 786 | 155.8 |
| B | 10 | 246 | 51739 | 327.05 | 810 | 786 | 155.8 |
| B | 4 | 200 | 25371 | 157.8 | 810 | 786 | 155.8 |
| C | 14 | 238 | 125982 | 685.18 | 779 | 781 | 182.7 |
| C | 3 | 233 | 33271 | 177.81 | 779 | 781 | 182.7 |
| C | 13 | 61 | 5359 | 25.05 | 779 | 781 | 182.7 |
| D | 1 | 52 | 3804496 | 21621.68 | 734 | 715 | 175.9 |
| D | 8 | 195 | 313180 | 1776.13 | 734 | 715 | 175.9 |
| D | 2 | 250 | 157947 | 893.75 | 734 | 715 | 175.9 |
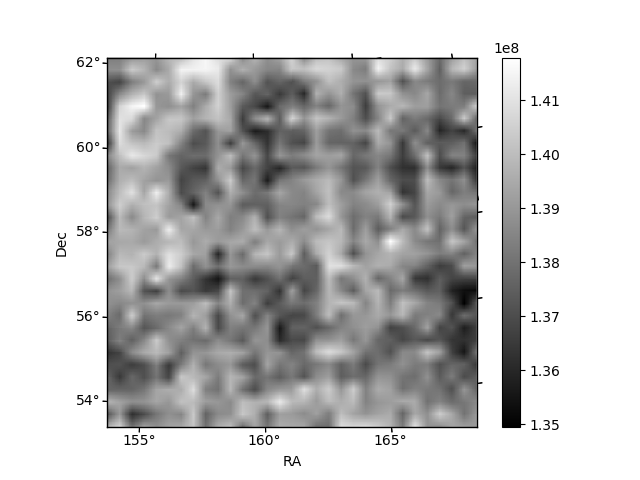
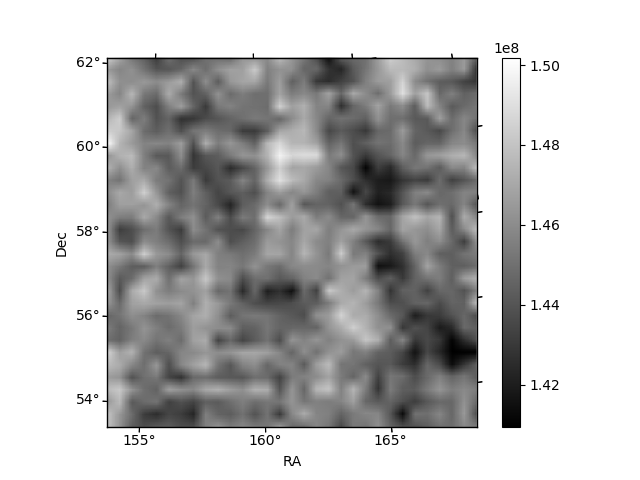
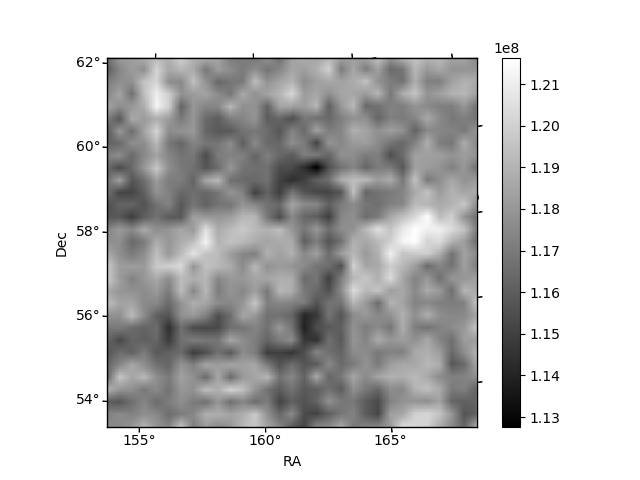
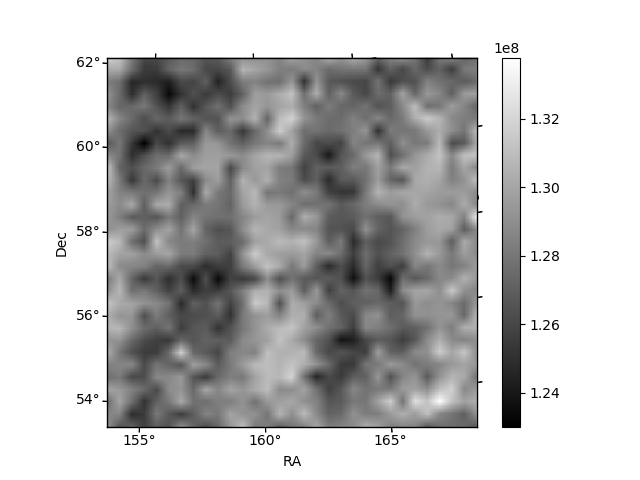
Histogram calculated using DETX and DETY for each event in the final _common_clean file
| Quadrant A | 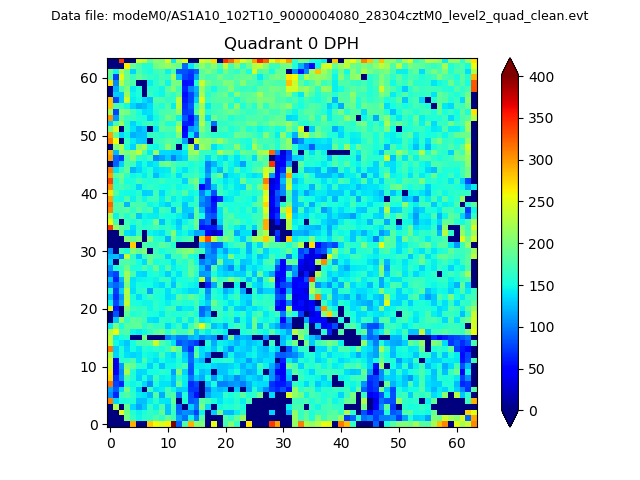 |
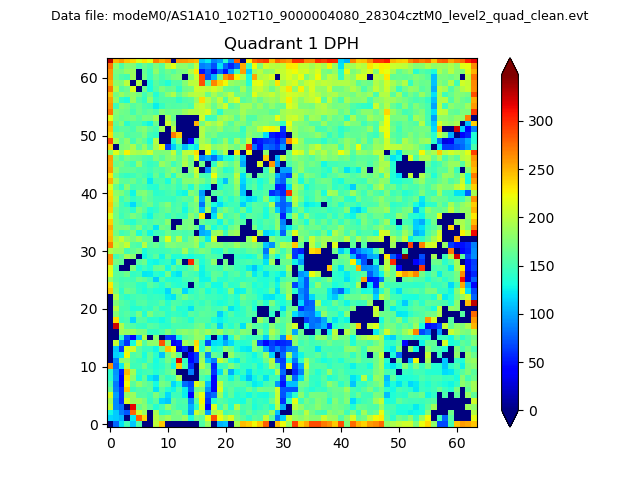 |
Quadrant B |
|---|---|---|---|
| Quadrant D |  |
 |
Quadrant C |
| Plot type | Count rate plots | Images |
|---|---|---|
| Comparison with Poisson distribution Blue bars denote a histogram of data divided into 1 sec bins. Red curve is a Poisson curve with rate = median count rate of data. |
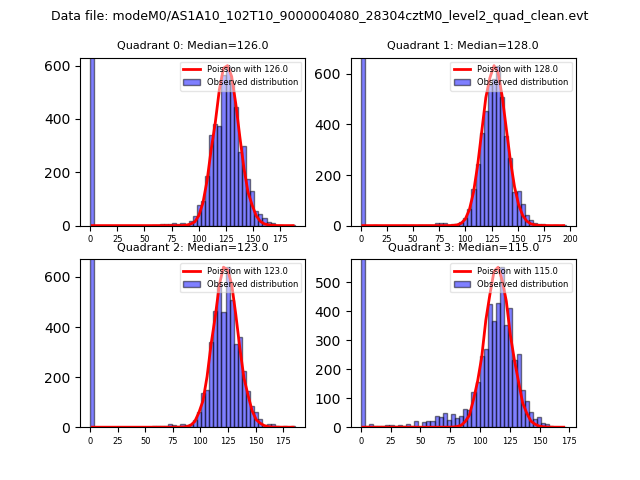 |
 |
| Quadrant-wise count rates Data is divided into 100 sec bins |
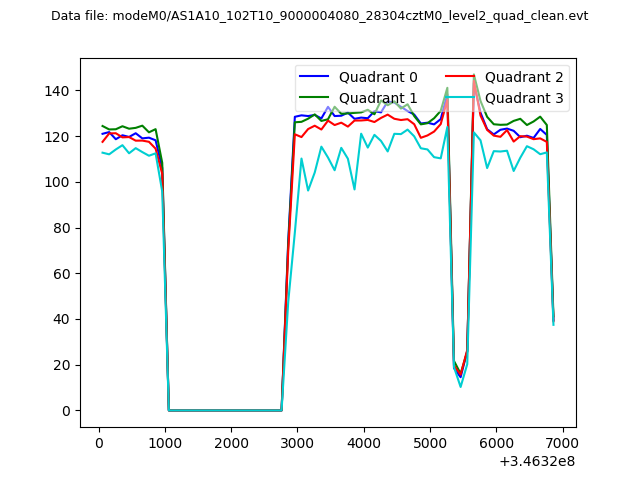 |
|
| Module-wise count rates for Quadrant A Data is divided into 100 sec bins |
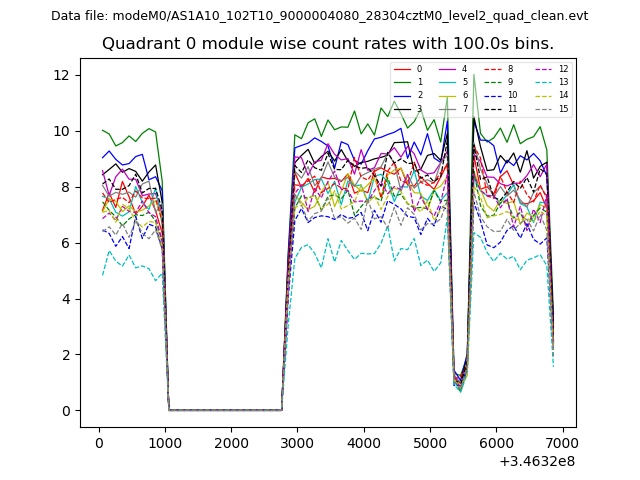 |
 |
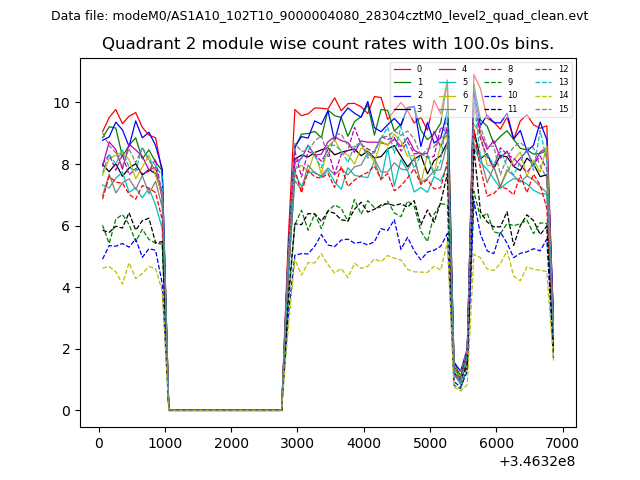
| Module-wise count rates for Quadrant B Data is divided into 100 sec bins |
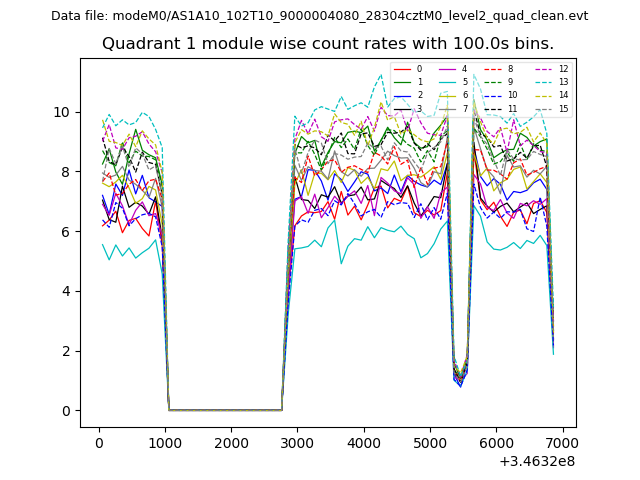 |
 |
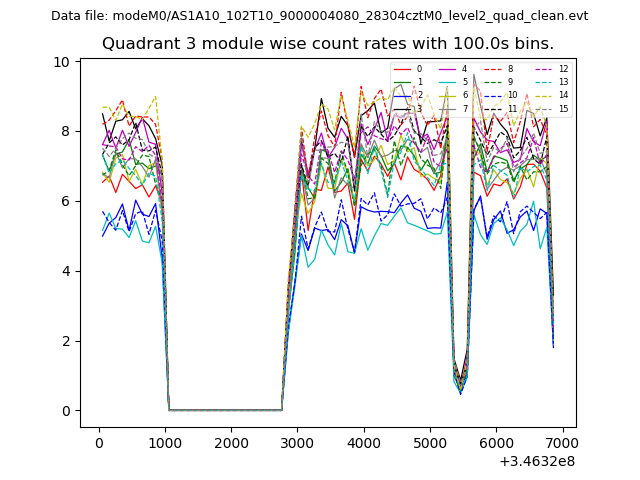
| Module-wise count rates for Quadrant C Data is divided into 100 sec bins |
 |
 |
| Module-wise count rates for Quadrant D Data is divided into 100 sec bins |
 |
 |
| Parameter | Plot |
|---|---|
| CZT HV Monitor | 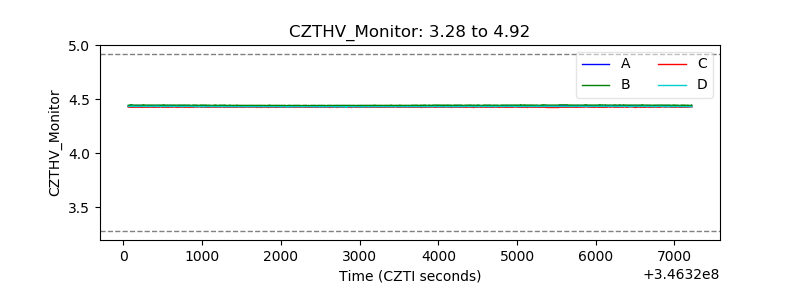 |
| D_VDD | 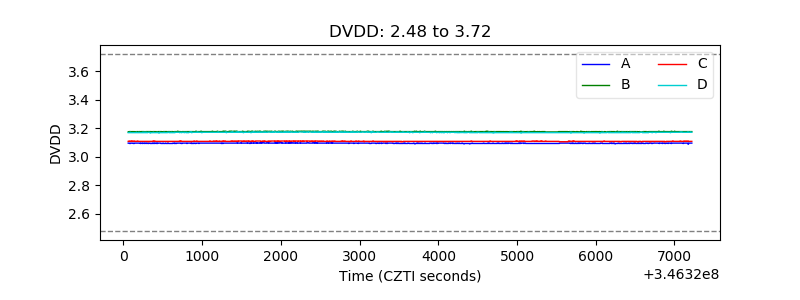 |
| Temperature 1 | 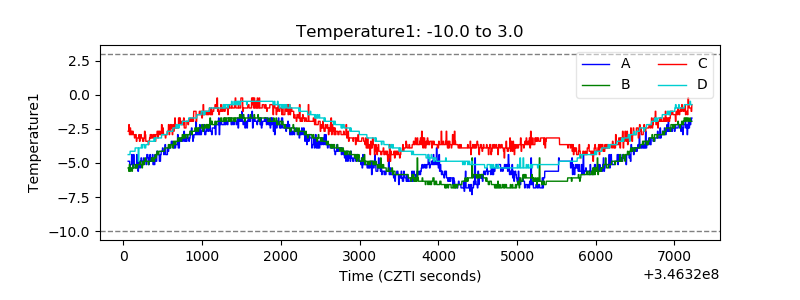 |
| Veto HV Monitor | 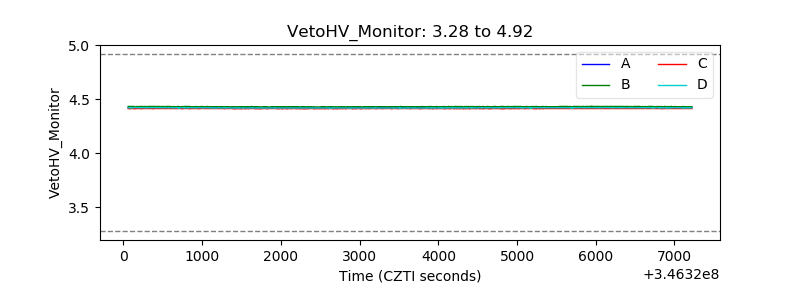 |
| Veto LLD |  |
| Alpha Counter | 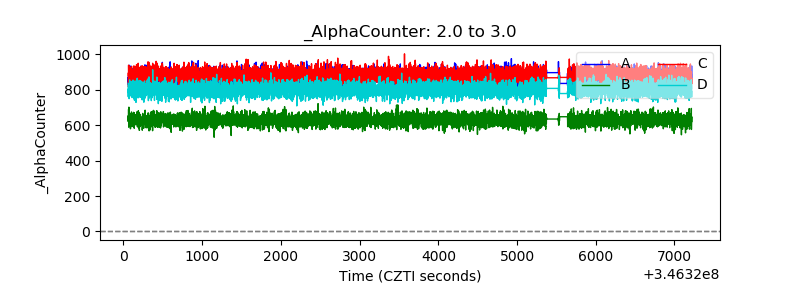 |
| _CPM_Rate | 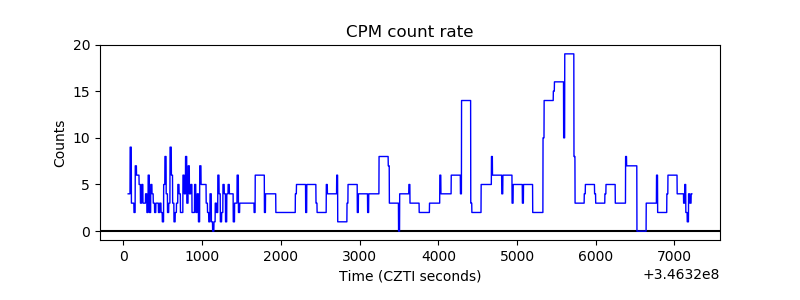 |
| CZT Counter |  |
| +2.5 Volts monitor |  |
| +5 Volts monitor | 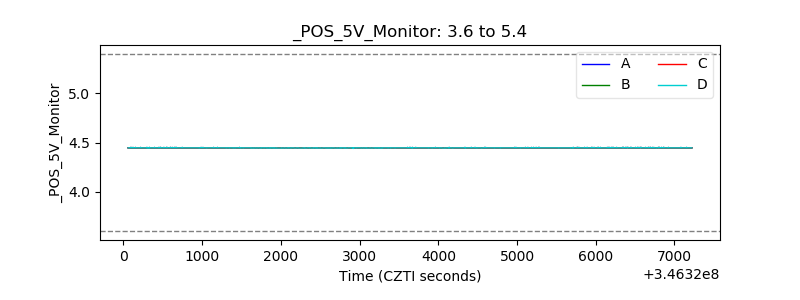 |
| _ROLL_ROT | 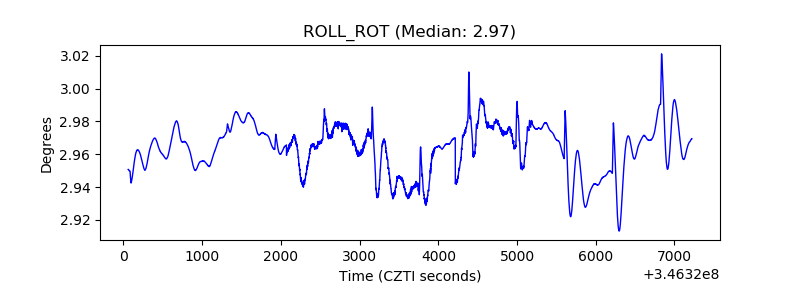 |
| _Roll_DEC | 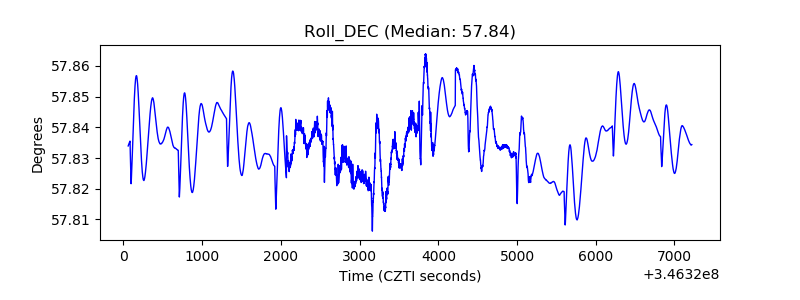 |
| _Roll_RA | 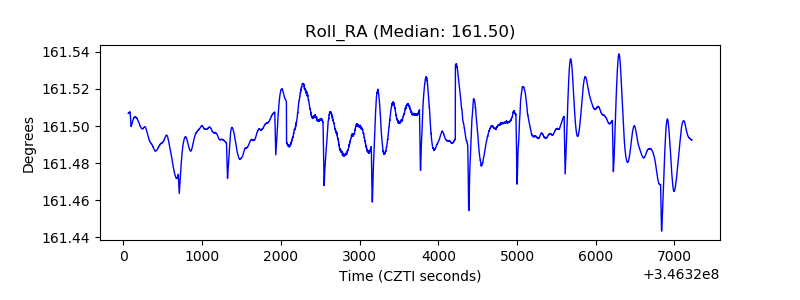 |
| Veto Counter | 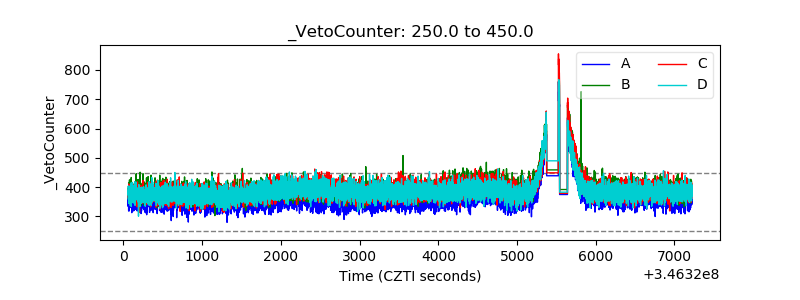 |