| Param | Original file | Final file |
|---|---|---|
| Filename | modeM0/AS1A10_102T10_9000004080_28306cztM0_level2.evt | modeM0/AS1A10_102T10_9000004080_28306cztM0_level2_quad_clean.evt |
| Size (bytes) | 458,746,560 | 76,533,120 |
| Size | 437.5 MB | 73.0 MB |
| Events in quadrant A | 2,613,249 | 491,311 |
| Events in quadrant B | 2,789,252 | 497,668 |
| Events in quadrant C | 2,664,369 | 477,746 |
| Events in quadrant D | 5,435,911 | 449,094 |
| Mode M0 | |||
|---|---|---|---|
| Quadrant | BADHDUFLAG | Total packets | Discarded packets |
| A | 0 | 11650 | 0 |
| B | 0 | 12020 | 0 |
| C | 0 | 11649 | 0 |
| D | 0 | 20138 | 0 |
| Mode M9 | |||
|---|---|---|---|
| Quadrant | BADHDUFLAG | Total packets | Discarded packets |
| A | 0 | 5 | 0 |
| B | 0 | 5 | 0 |
| C | 0 | 5 | 0 |
| D | 0 | 5 | 0 |
| Quadrant | Total seconds | Saturated seconds | Saturation percentage |
|---|---|---|---|
| A | 5745 | 67 | 1.166232% |
| B | 5746 | 90 | 1.566307% |
| C | 5746 | 78 | 1.357466% |
| D | 5746 | 795 | 13.835712% |
Noise dominated data is calculated using 1-second bins in cleaned event files. If a bin has >2000 counts, and if more than 50% of those come from <1% of pixels, then it is considered to be noise-dominated and hence unusable.
| Quadrant | # 1 sec bins | Bins with >0 counts | Bins with >2000 counts | High rate bins dominated by noise | Noise dominated (total time) | Noise dominated (detector-on time) | Marked lightcurve |
|---|---|---|---|---|---|---|---|
| A | 6225 | 5745 | 1 | 1 | 0.02% | 0.02% | 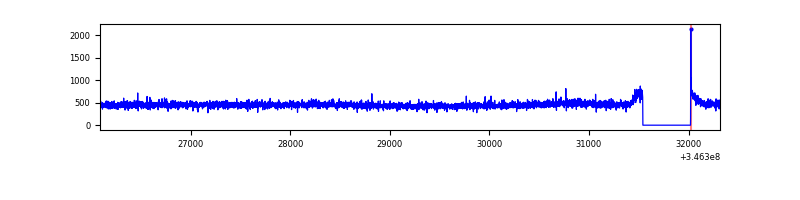 |
| B | 6226 | 5746 | 23 | 23 | 0.37% | 0.40% | 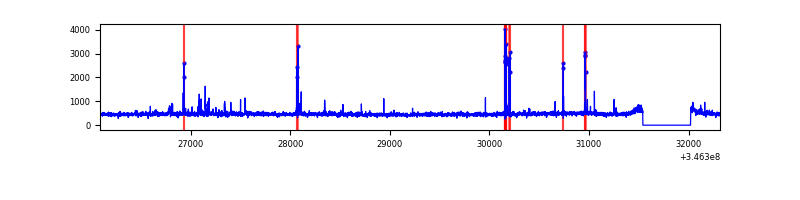 |
| C | 6226 | 5746 | 0 | 0 | 0.00% | 0.00% | 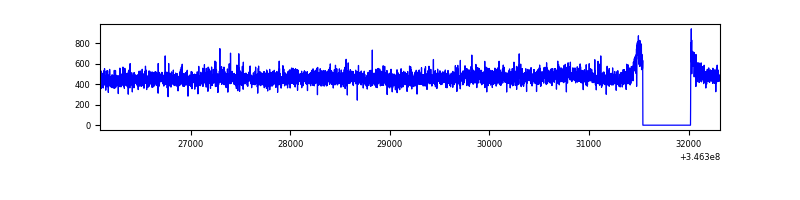 |
| D | 6226 | 5746 | 640 | 640 | 10.28% | 11.14% | 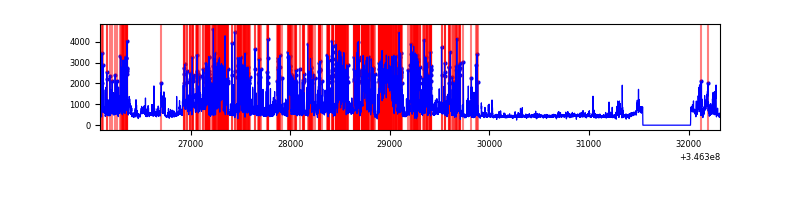 |
Top three noisy pixels from each quadrant. If the there are fewer than three noisy pixels in the level2.evt file, extra rows are filled as -1
| Pixel properties | Quadrant properties | ||||||
|---|---|---|---|---|---|---|---|
| Quadrant | DetID | PixID | Counts | Sigma | Mean | Median | Sigma |
| A | 13 | 254 | 8743 | 59.07 | 676 | 659 | 136.9 |
| A | 3 | 137 | 6809 | 44.94 | 676 | 659 | 136.9 |
| A | 8 | 192 | 6002 | 39.04 | 676 | 659 | 136.9 |
| B | 10 | 245 | 64385 | 494.99 | 671 | 652 | 128.8 |
| B | 10 | 246 | 54370 | 417.21 | 671 | 652 | 128.8 |
| B | 12 | 111 | 16197 | 120.73 | 671 | 652 | 128.8 |
| C | 14 | 238 | 105807 | 688.59 | 648 | 650 | 152.7 |
| C | 3 | 233 | 28254 | 180.76 | 648 | 650 | 152.7 |
| C | 13 | 61 | 4573 | 25.69 | 648 | 650 | 152.7 |
| D | 1 | 52 | 2591440 | 17448.46 | 622 | 605 | 148.5 |
| D | 8 | 195 | 292021 | 1962.6 | 622 | 605 | 148.5 |
| D | 2 | 250 | 113982 | 763.56 | 622 | 605 | 148.5 |
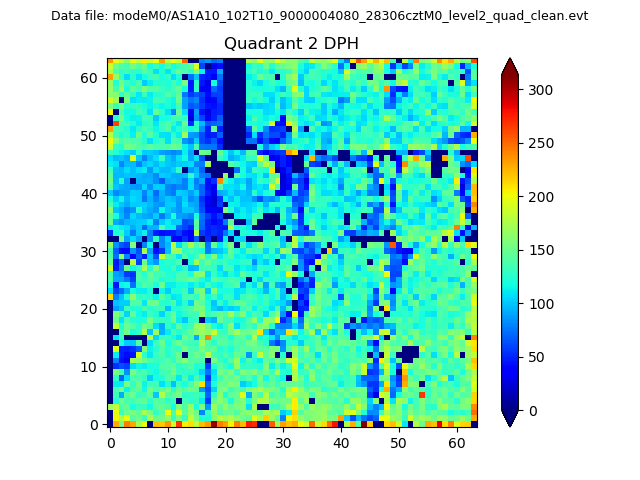
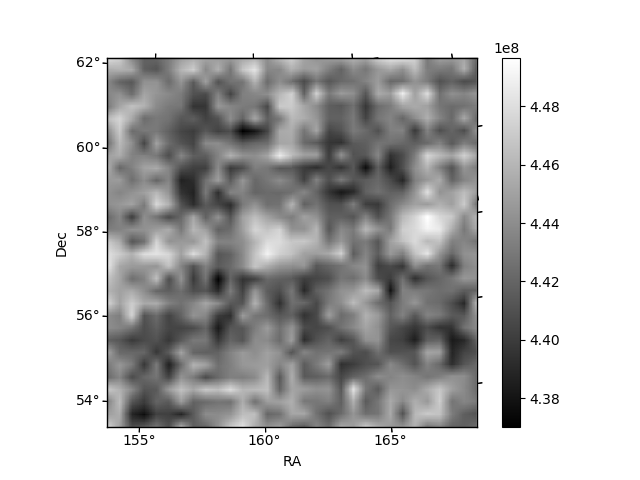
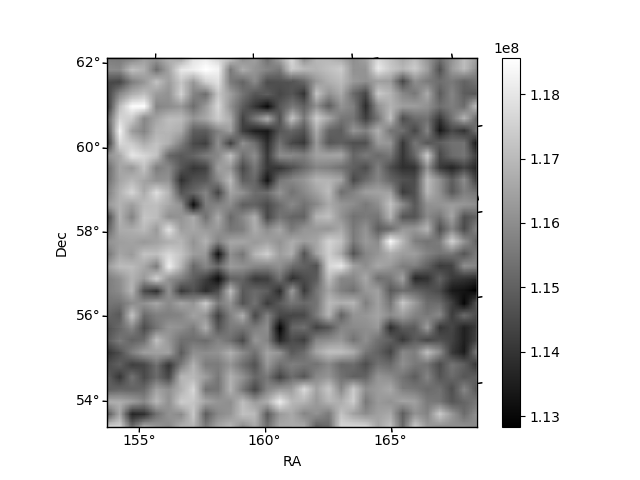
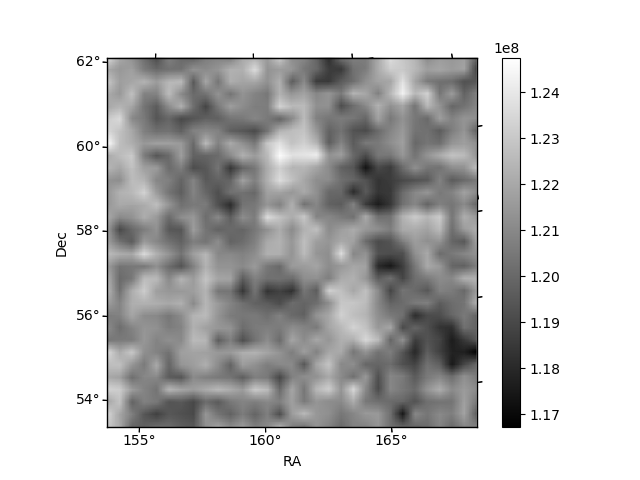
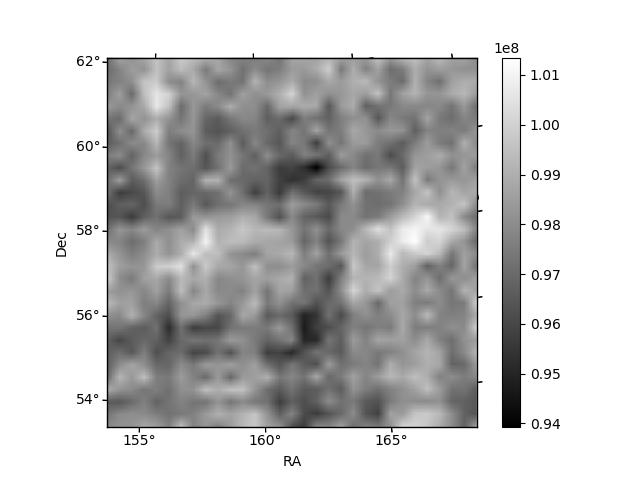
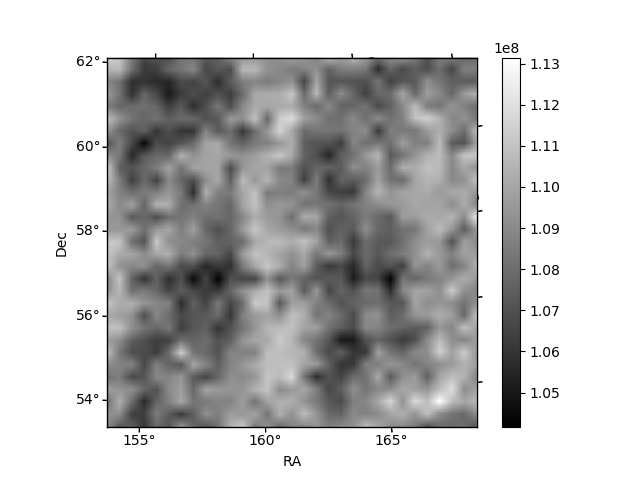
Histogram calculated using DETX and DETY for each event in the final _common_clean file
| Quadrant A | 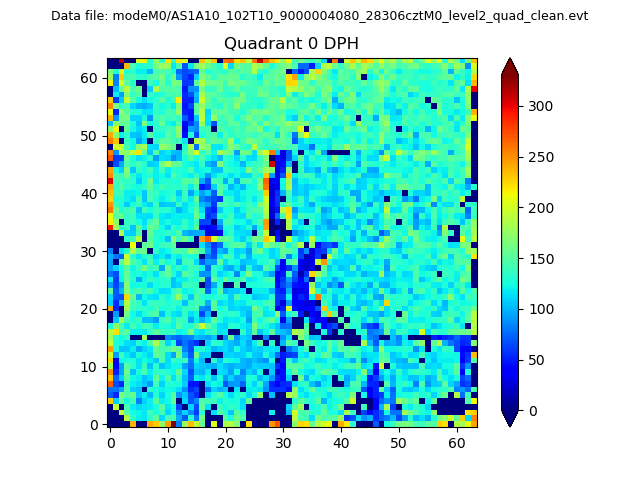 |
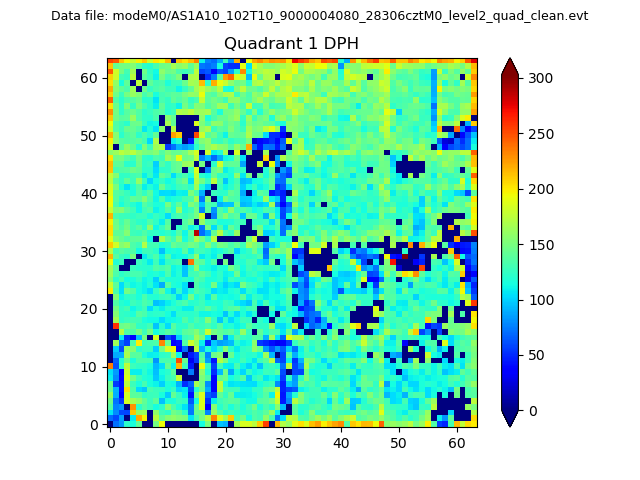 |
Quadrant B |
|---|---|---|---|
| Quadrant D | 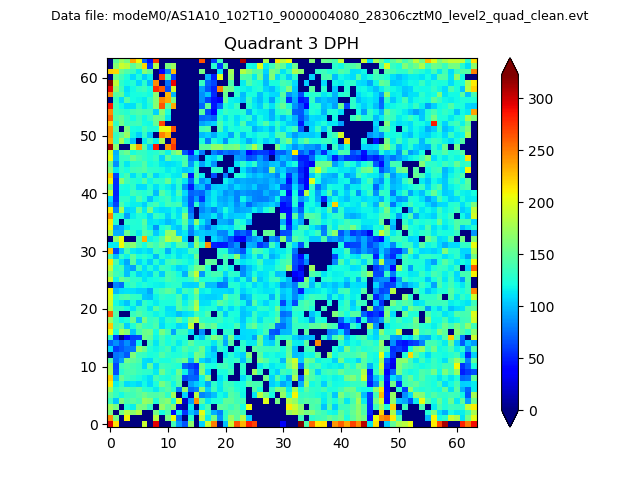 |
 |
Quadrant C |
| Plot type | Count rate plots | Images |
|---|---|---|
| Comparison with Poisson distribution Blue bars denote a histogram of data divided into 1 sec bins. Red curve is a Poisson curve with rate = median count rate of data. |
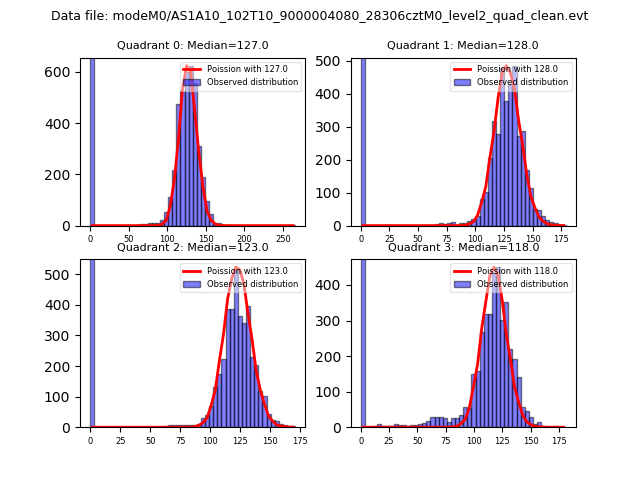 |
 |
| Quadrant-wise count rates Data is divided into 100 sec bins |
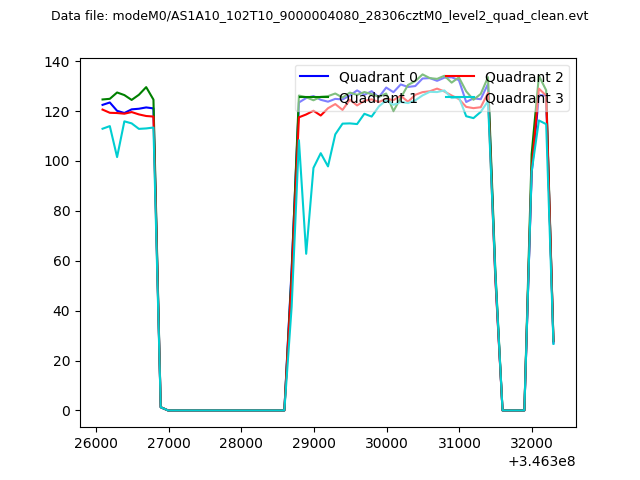 |
|
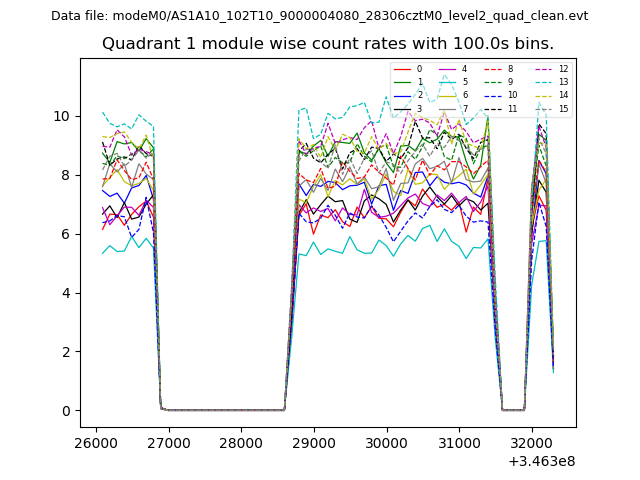
| Module-wise count rates for Quadrant A Data is divided into 100 sec bins |
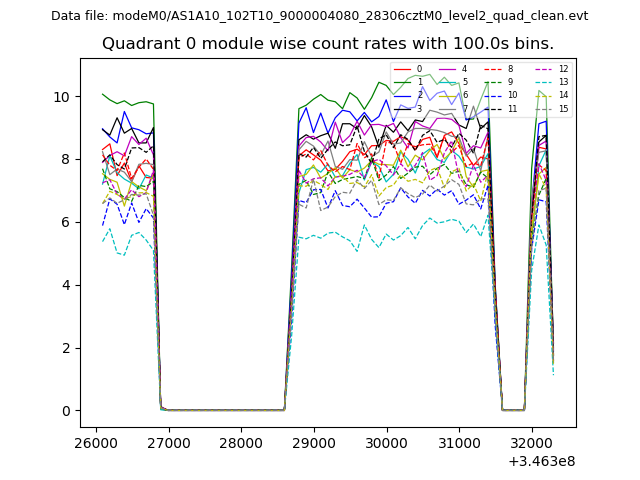 |
 |
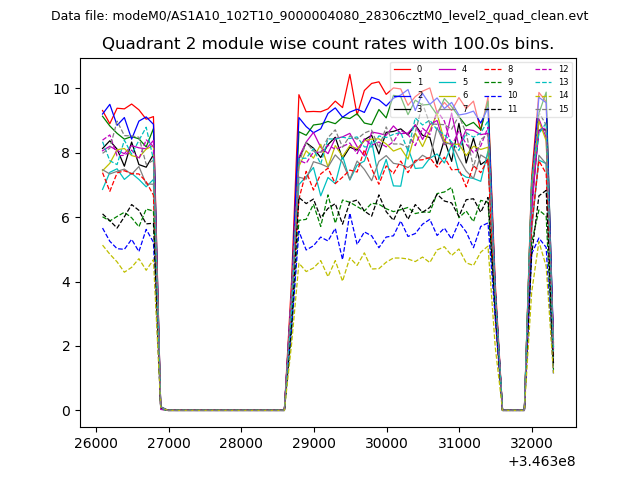
| Module-wise count rates for Quadrant B Data is divided into 100 sec bins |
 |
 |
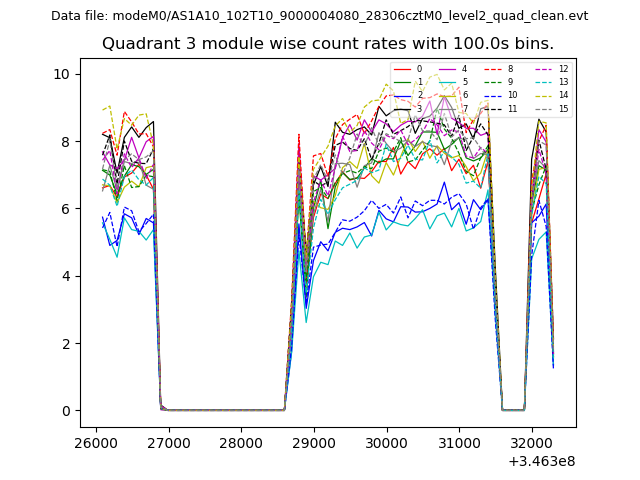
| Module-wise count rates for Quadrant C Data is divided into 100 sec bins |
 |
 |
| Module-wise count rates for Quadrant D Data is divided into 100 sec bins |
 |
 |
| Parameter | Plot |
|---|---|
| CZT HV Monitor | 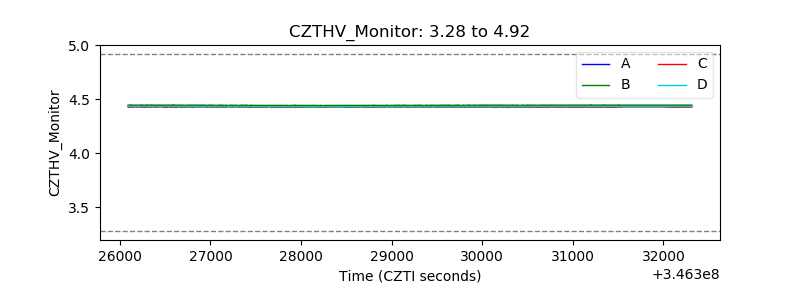 |
| D_VDD | 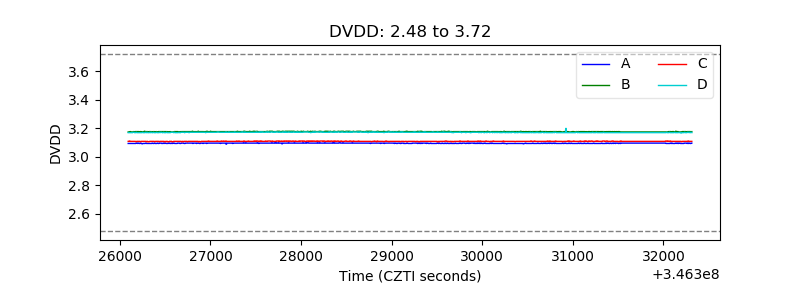 |
| Temperature 1 |  |
| Veto HV Monitor | 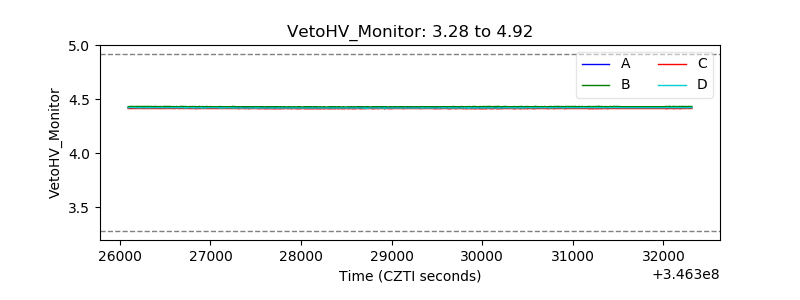 |
| Veto LLD | 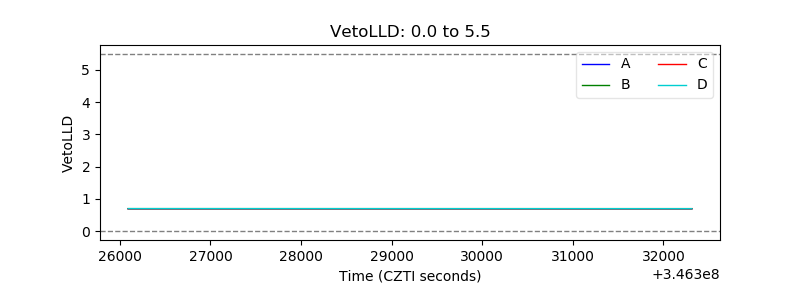 |
| Alpha Counter | 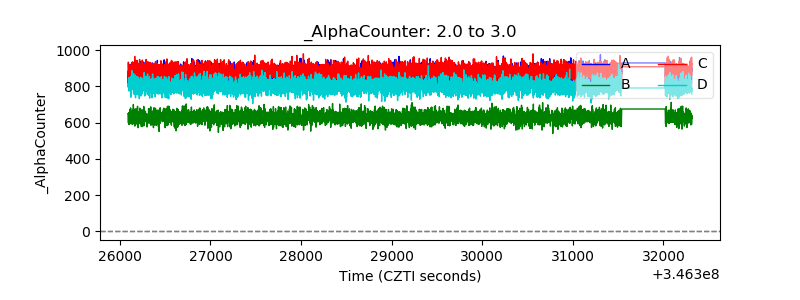 |
| _CPM_Rate | 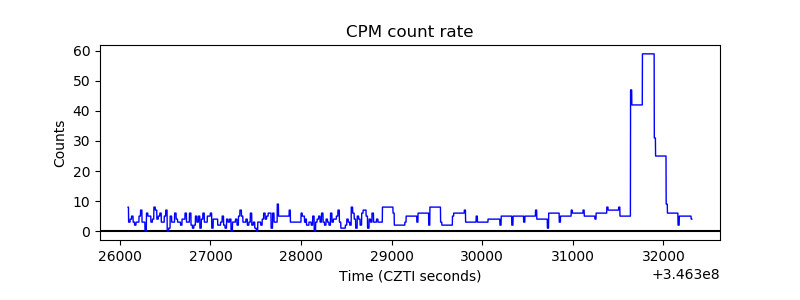 |
| CZT Counter | 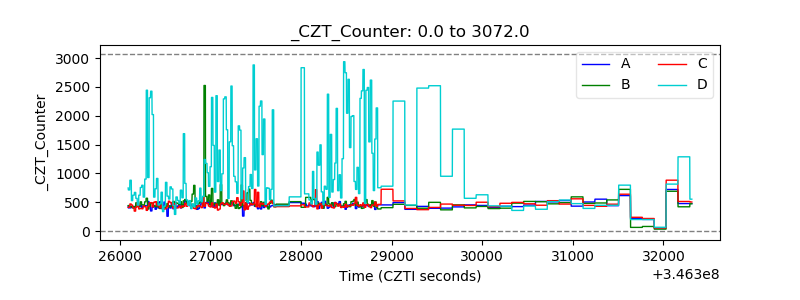 |
| +2.5 Volts monitor |  |
| +5 Volts monitor |  |
| _ROLL_ROT | 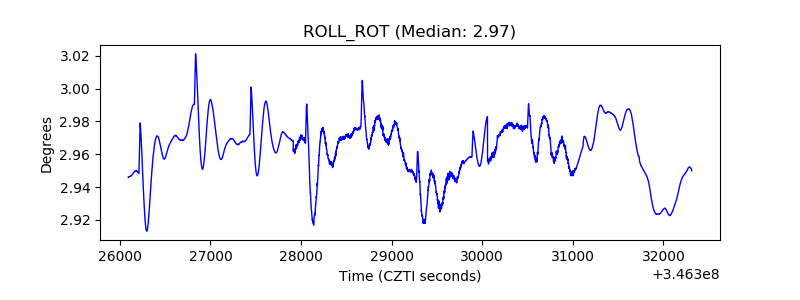 |
| _Roll_DEC | 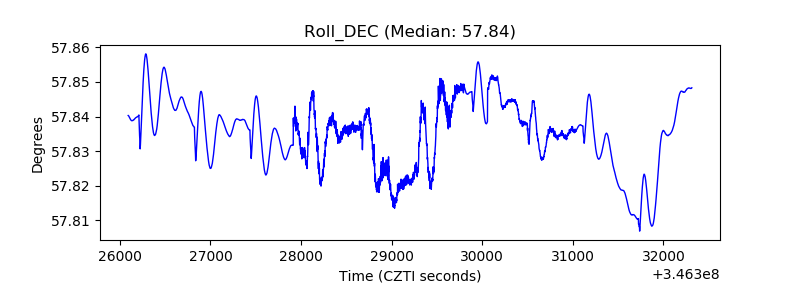 |
| _Roll_RA | 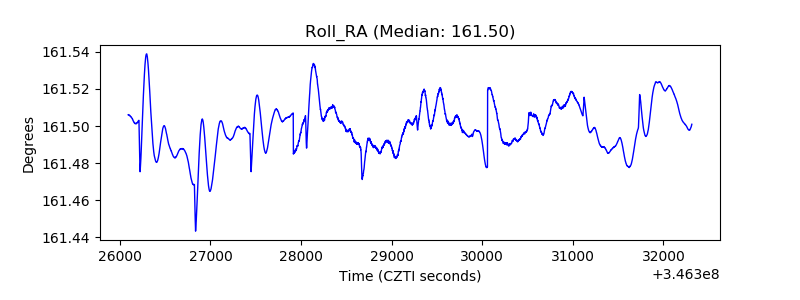 |
| Veto Counter | 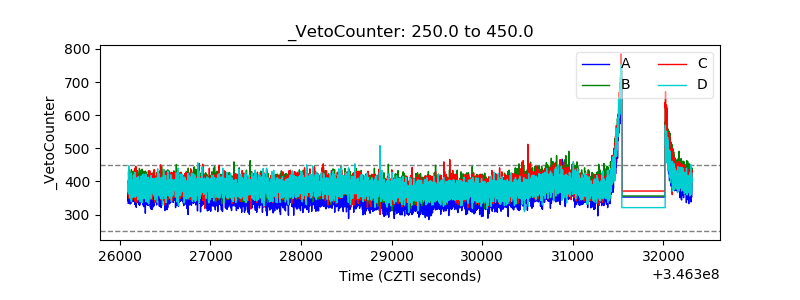 |