| Param | Original file | Final file |
|---|---|---|
| Filename | modeM0/AS1A10_102T10_9000004080_28307cztM0_level2.evt | modeM0/AS1A10_102T10_9000004080_28307cztM0_level2_quad_clean.evt |
| Size (bytes) | 1,019,900,160 | 149,690,880 |
| Size | 972.7 MB | 142.8 MB |
| Events in quadrant A | 5,923,900 | 940,684 |
| Events in quadrant B | 6,493,145 | 946,024 |
| Events in quadrant C | 6,078,014 | 909,959 |
| Events in quadrant D | 11,539,301 | 863,871 |
| Mode M0 | |||
|---|---|---|---|
| Quadrant | BADHDUFLAG | Total packets | Discarded packets |
| A | 0 | 25890 | 0 |
| B | 0 | 27441 | 0 |
| C | 0 | 26166 | 0 |
| D | 0 | 43073 | 0 |
| Mode M9 | |||
|---|---|---|---|
| Quadrant | BADHDUFLAG | Total packets | Discarded packets |
| A | 0 | 20 | 0 |
| B | 0 | 20 | 0 |
| C | 0 | 20 | 0 |
| D | 0 | 20 | 0 |
| Quadrant | Total seconds | Saturated seconds | Saturation percentage |
|---|---|---|---|
| A | 12623 | 193 | 1.528955% |
| B | 12623 | 280 | 2.218173% |
| C | 12623 | 263 | 2.083498% |
| D | 12623 | 1640 | 12.992157% |
Noise dominated data is calculated using 1-second bins in cleaned event files. If a bin has >2000 counts, and if more than 50% of those come from <1% of pixels, then it is considered to be noise-dominated and hence unusable.
| Quadrant | # 1 sec bins | Bins with >0 counts | Bins with >2000 counts | High rate bins dominated by noise | Noise dominated (total time) | Noise dominated (detector-on time) | Marked lightcurve |
|---|---|---|---|---|---|---|---|
| A | 14593 | 12623 | 2 | 2 | 0.01% | 0.02% | 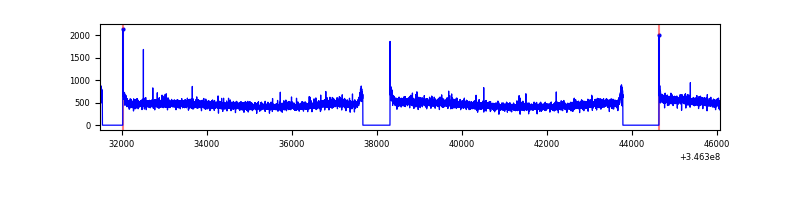 |
| B | 14593 | 12623 | 62 | 62 | 0.42% | 0.49% | 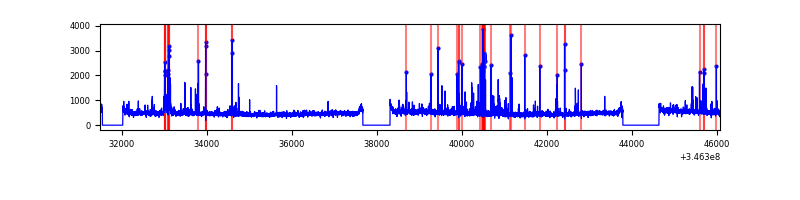 |
| C | 14593 | 12623 | 2 | 2 | 0.01% | 0.02% | 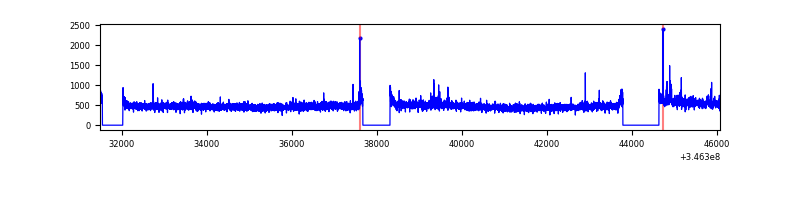 |
| D | 14593 | 12623 | 1249 | 1249 | 8.56% | 9.89% | 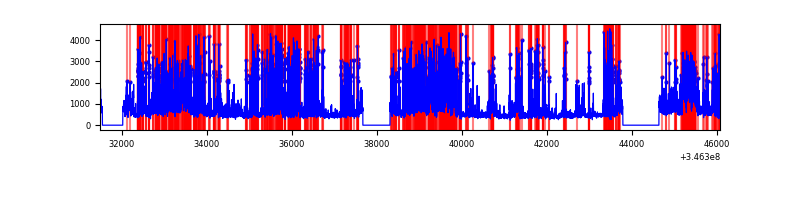 |
Top three noisy pixels from each quadrant. If the there are fewer than three noisy pixels in the level2.evt file, extra rows are filled as -1
| Pixel properties | Quadrant properties | ||||||
|---|---|---|---|---|---|---|---|
| Quadrant | DetID | PixID | Counts | Sigma | Mean | Median | Sigma |
| A | 13 | 254 | 21028 | 63.31 | 1530 | 1494 | 308.5 |
| A | 8 | 192 | 18251 | 54.31 | 1530 | 1494 | 308.5 |
| A | 3 | 137 | 15085 | 44.05 | 1530 | 1494 | 308.5 |
| B | 10 | 246 | 222919 | 764.29 | 1515 | 1474 | 289.7 |
| B | 10 | 245 | 167497 | 573.01 | 1515 | 1474 | 289.7 |
| B | 4 | 200 | 73273 | 247.81 | 1515 | 1474 | 289.7 |
| C | 14 | 238 | 234360 | 682.04 | 1460 | 1466 | 341.5 |
| C | 3 | 233 | 150209 | 435.6 | 1460 | 1466 | 341.5 |
| C | 13 | 61 | 9959 | 24.87 | 1460 | 1466 | 341.5 |
| D | 1 | 52 | 2987955 | 8884.8 | 1418 | 1379 | 336.1 |
| D | 8 | 195 | 1333965 | 3964.33 | 1418 | 1379 | 336.1 |
| D | 12 | 233 | 613584 | 1821.26 | 1418 | 1379 | 336.1 |
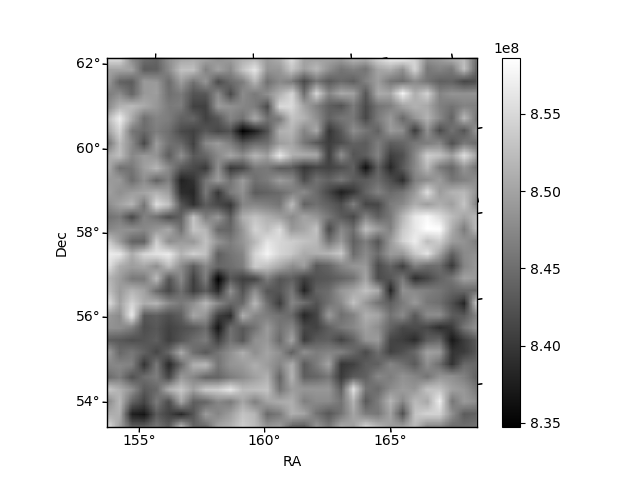
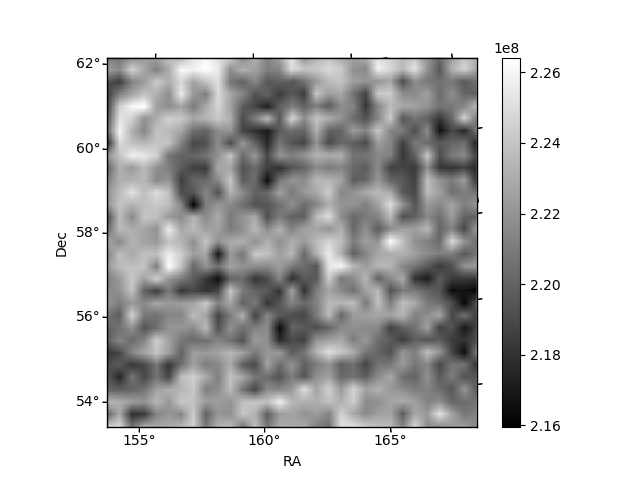
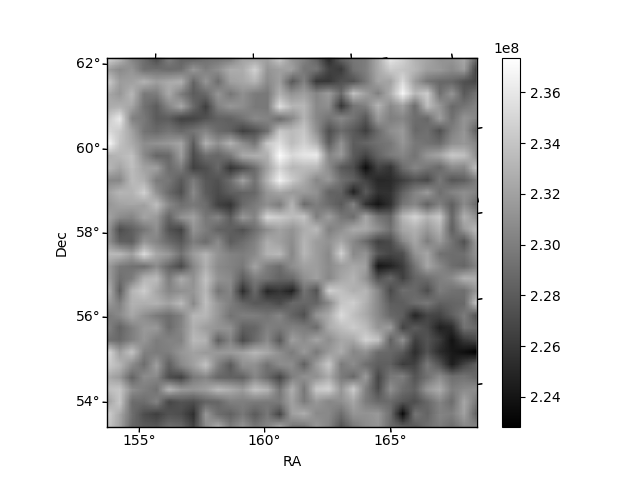
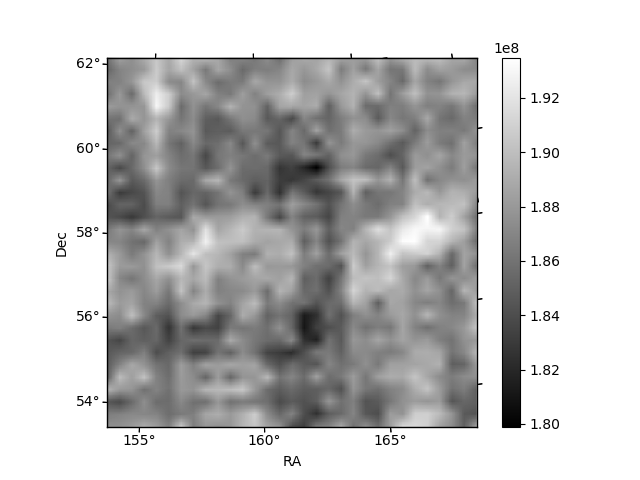
Histogram calculated using DETX and DETY for each event in the final _common_clean file
| Quadrant A | 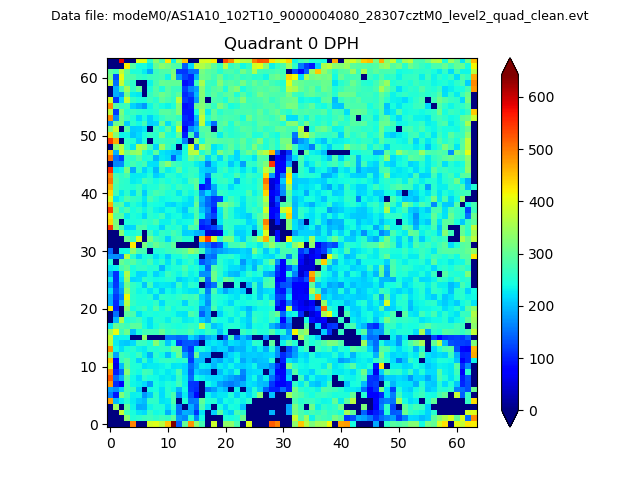 |
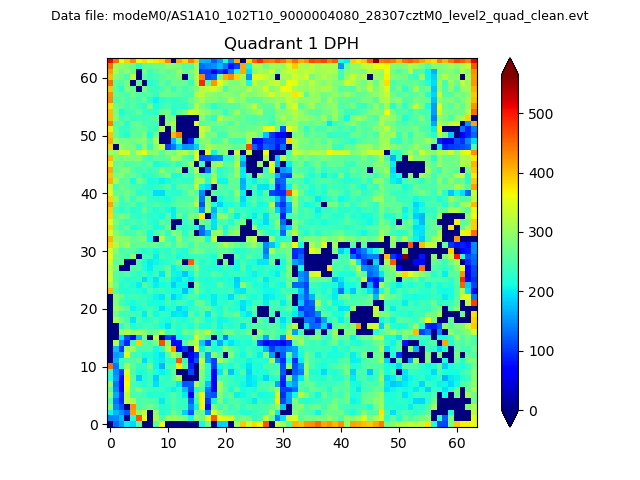 |
Quadrant B |
|---|---|---|---|
| Quadrant D | 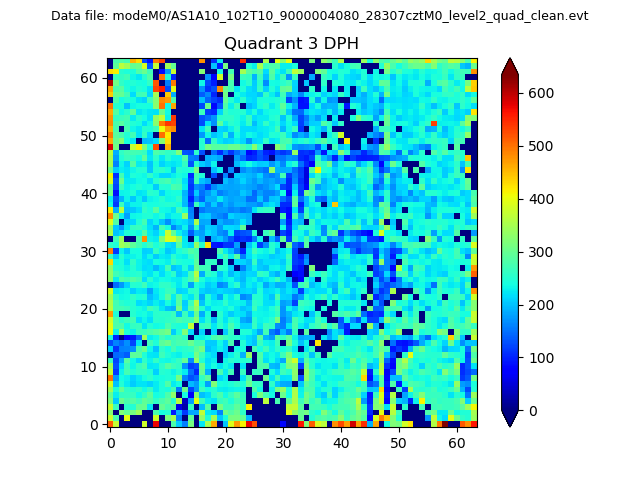 |
 |
Quadrant C |
| Plot type | Count rate plots | Images |
|---|---|---|
| Comparison with Poisson distribution Blue bars denote a histogram of data divided into 1 sec bins. Red curve is a Poisson curve with rate = median count rate of data. |
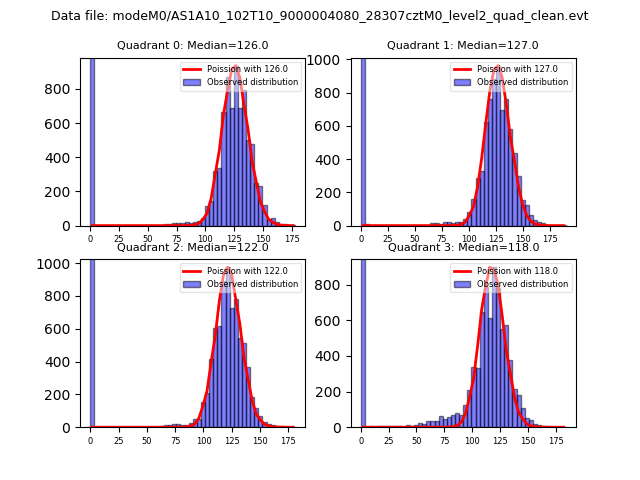 |
 |
| Quadrant-wise count rates Data is divided into 100 sec bins |
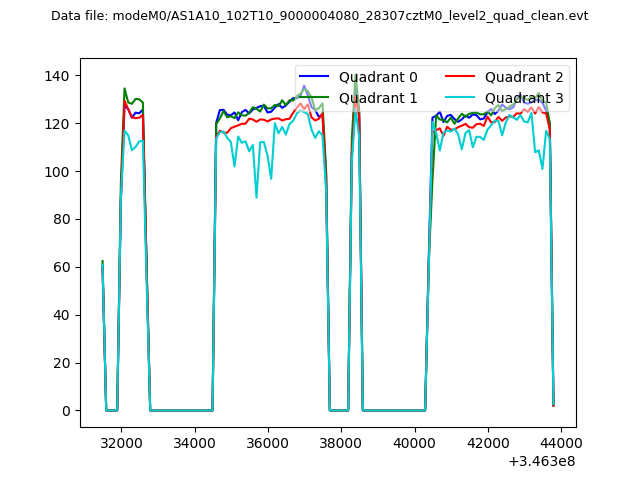 |
|
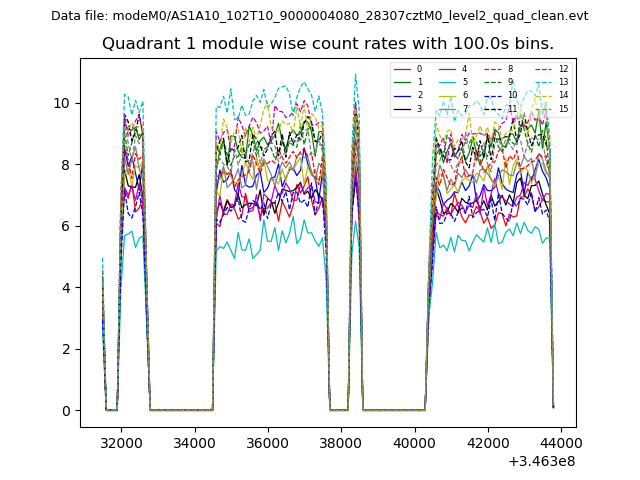
| Module-wise count rates for Quadrant A Data is divided into 100 sec bins |
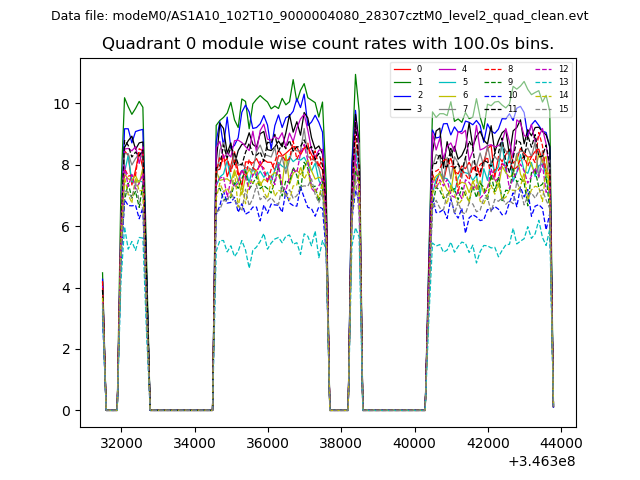 |
 |
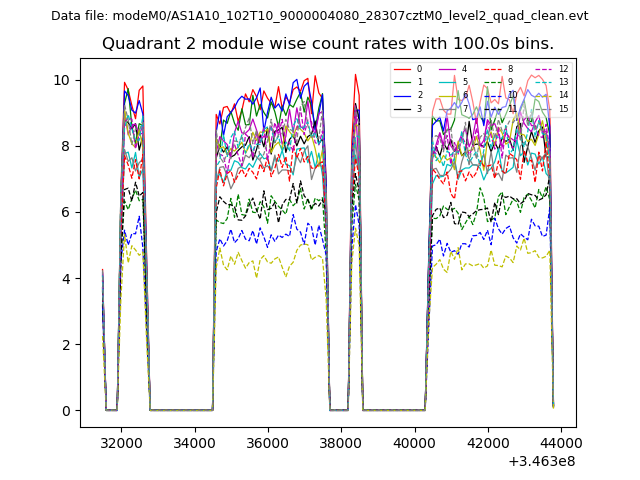
| Module-wise count rates for Quadrant B Data is divided into 100 sec bins |
 |
 |
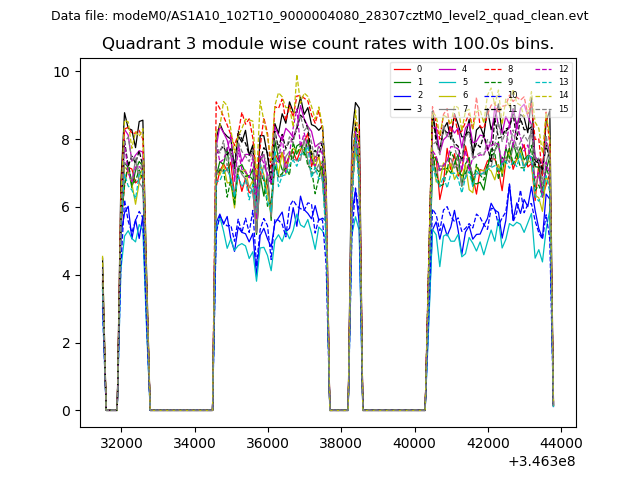
| Module-wise count rates for Quadrant C Data is divided into 100 sec bins |
 |
 |
| Module-wise count rates for Quadrant D Data is divided into 100 sec bins |
 |
 |
| Parameter | Plot |
|---|---|
| CZT HV Monitor | 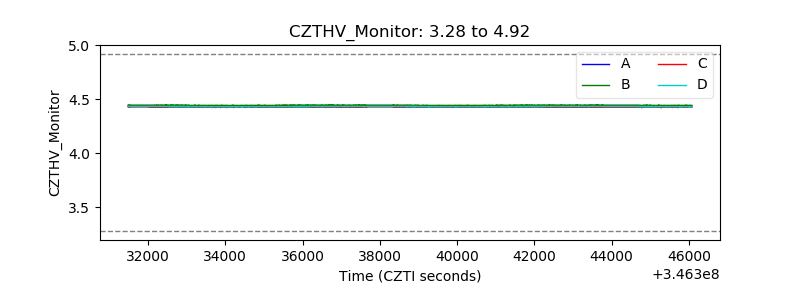 |
| D_VDD | 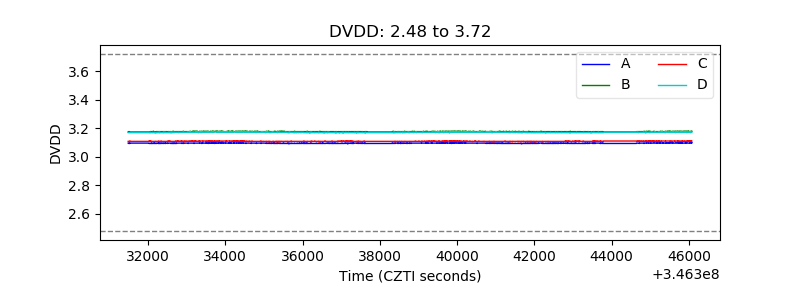 |
| Temperature 1 | 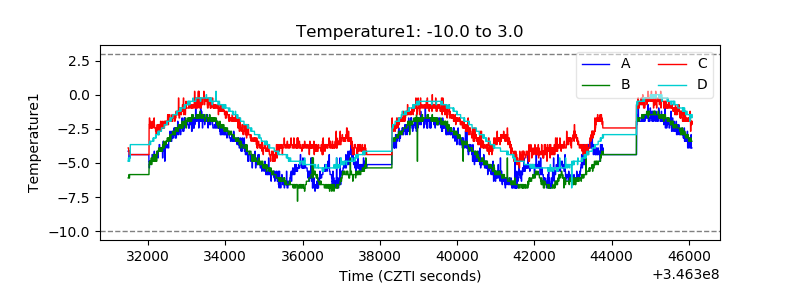 |
| Veto HV Monitor | 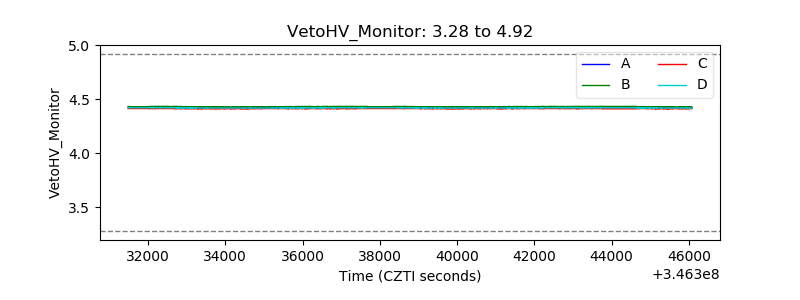 |
| Veto LLD | 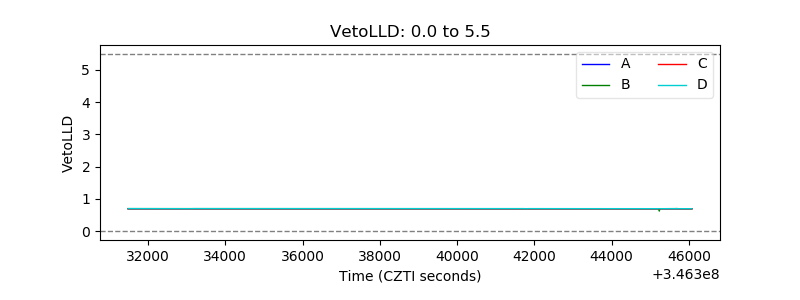 |
| Alpha Counter | 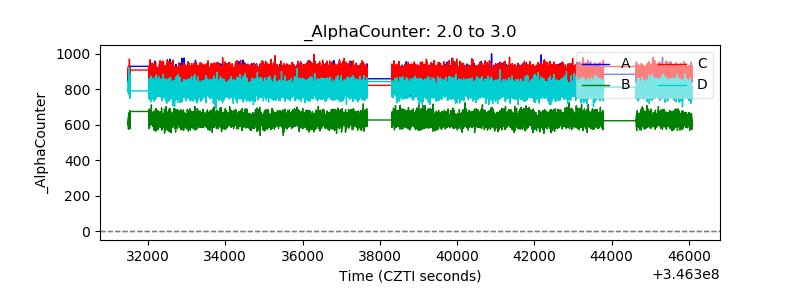 |
| _CPM_Rate | 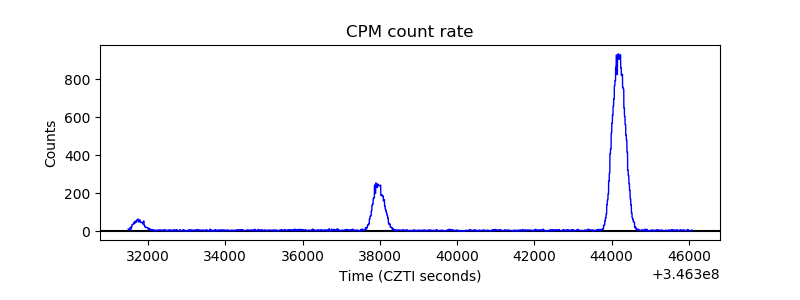 |
| CZT Counter |  |
| +2.5 Volts monitor |  |
| +5 Volts monitor | 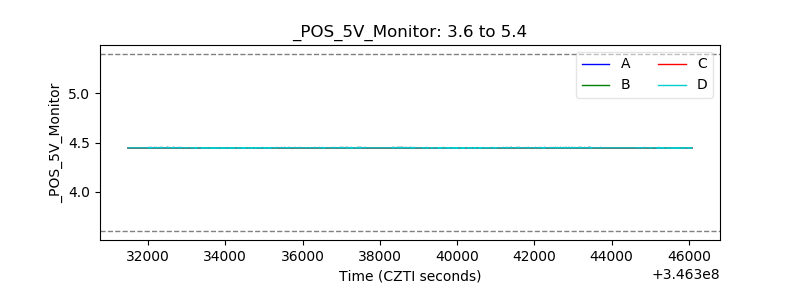 |
| _ROLL_ROT | 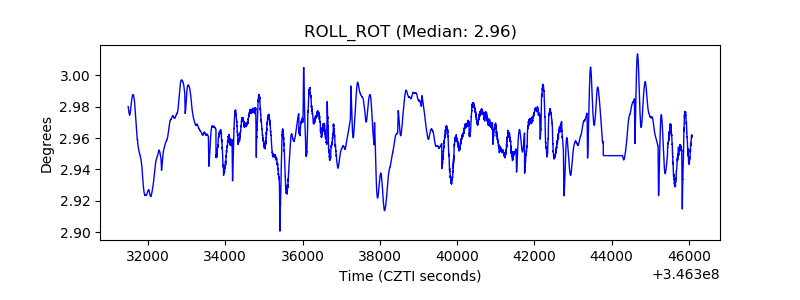 |
| _Roll_DEC | 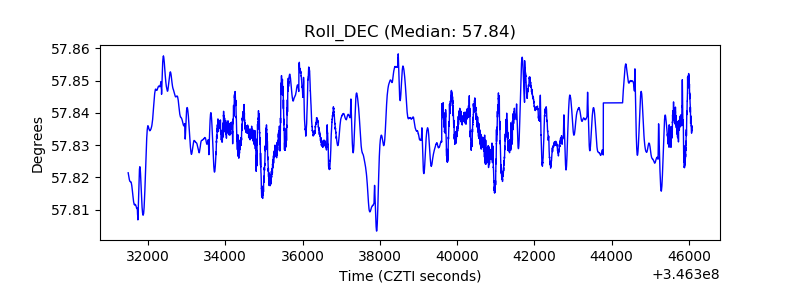 |
| _Roll_RA | 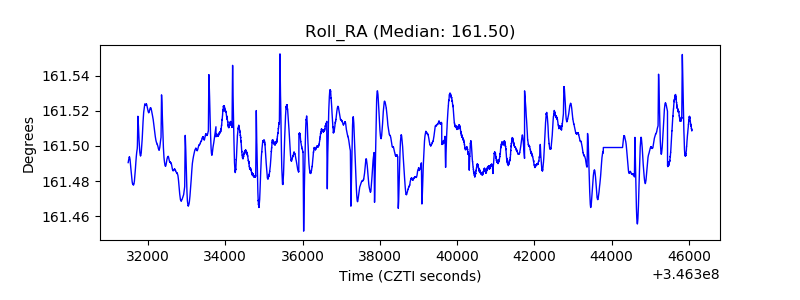 |
| Veto Counter | 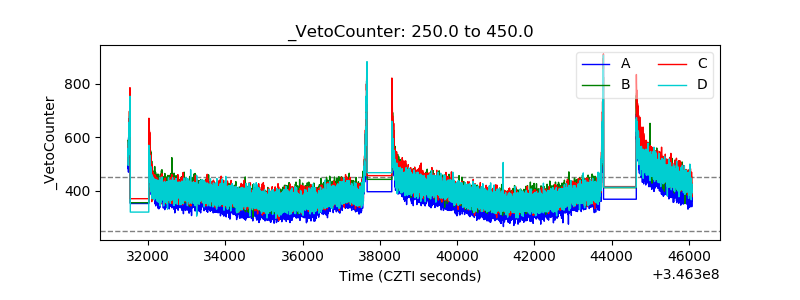 |