| Param | Original file | Final file |
|---|---|---|
| Filename | modeM0/AS1A10_102T10_9000004080_28310cztM0_level2.evt | modeM0/AS1A10_102T10_9000004080_28310cztM0_level2_quad_clean.evt |
| Size (bytes) | 529,470,720 | 93,873,600 |
| Size | 504.9 MB | 89.5 MB |
| Events in quadrant A | 3,473,178 | 605,738 |
| Events in quadrant B | 3,707,179 | 615,067 |
| Events in quadrant C | 3,377,466 | 597,050 |
| Events in quadrant D | 5,040,499 | 575,647 |
| Mode M0 | |||
|---|---|---|---|
| Quadrant | BADHDUFLAG | Total packets | Discarded packets |
| A | 0 | 14762 | 0 |
| B | 0 | 15421 | 0 |
| C | 0 | 14422 | 0 |
| D | 0 | 19575 | 0 |
| Mode M9 | |||
|---|---|---|---|
| Quadrant | BADHDUFLAG | Total packets | Discarded packets |
| A | 0 | 12 | 0 |
| B | 0 | 12 | 0 |
| C | 0 | 12 | 0 |
| D | 0 | 12 | 0 |
| Quadrant | Total seconds | Saturated seconds | Saturation percentage |
|---|---|---|---|
| A | 6445 | 87 | 1.349884% |
| B | 6446 | 106 | 1.644431% |
| C | 6446 | 106 | 1.644431% |
| D | 6445 | 371 | 5.756400% |
Noise dominated data is calculated using 1-second bins in cleaned event files. If a bin has >2000 counts, and if more than 50% of those come from <1% of pixels, then it is considered to be noise-dominated and hence unusable.
| Quadrant | # 1 sec bins | Bins with >0 counts | Bins with >2000 counts | High rate bins dominated by noise | Noise dominated (total time) | Noise dominated (detector-on time) | Marked lightcurve |
|---|---|---|---|---|---|---|---|
| A | 7605 | 6446 | 32 | 32 | 0.42% | 0.50% | 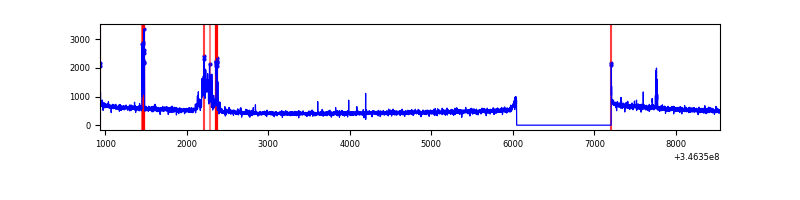 |
| B | 7606 | 6447 | 32 | 32 | 0.42% | 0.50% | 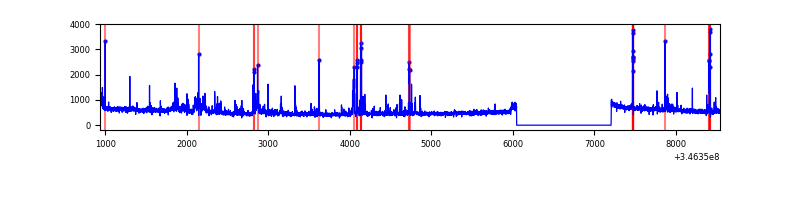 |
| C | 7606 | 6447 | 0 | 0 | 0.00% | 0.00% | 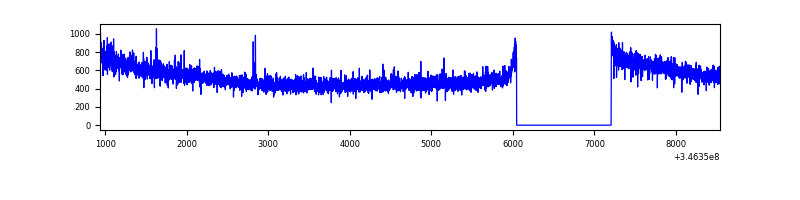 |
| D | 7605 | 6445 | 254 | 254 | 3.34% | 3.94% | 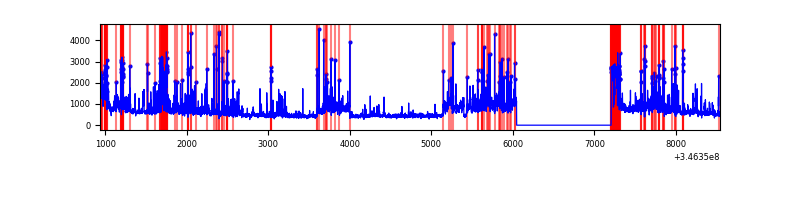 |
Top three noisy pixels from each quadrant. If the there are fewer than three noisy pixels in the level2.evt file, extra rows are filled as -1
| Pixel properties | Quadrant properties | ||||||
|---|---|---|---|---|---|---|---|
| Quadrant | DetID | PixID | Counts | Sigma | Mean | Median | Sigma |
| A | 15 | 174 | 225796 | 1351.79 | 833 | 818 | 166.4 |
| A | 13 | 170 | 20058 | 115.6 | 833 | 818 | 166.4 |
| A | 8 | 192 | 12948 | 72.88 | 833 | 818 | 166.4 |
| B | 10 | 245 | 295241 | 1898.39 | 833 | 813 | 155.1 |
| B | 10 | 246 | 62145 | 395.45 | 833 | 813 | 155.1 |
| B | 4 | 200 | 52546 | 333.56 | 833 | 813 | 155.1 |
| C | 14 | 238 | 133137 | 696.86 | 817 | 823 | 189.9 |
| C | 3 | 233 | 53149 | 275.59 | 817 | 823 | 189.9 |
| C | 13 | 61 | 5739 | 25.89 | 817 | 823 | 189.9 |
| D | 1 | 52 | 1153222 | 6141.15 | 794 | 771 | 187.7 |
| D | 8 | 195 | 626497 | 3334.35 | 794 | 771 | 187.7 |
| D | 12 | 233 | 91732 | 484.71 | 794 | 771 | 187.7 |
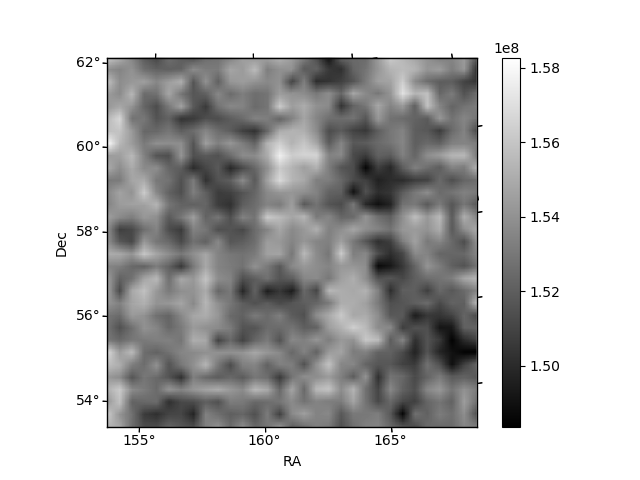
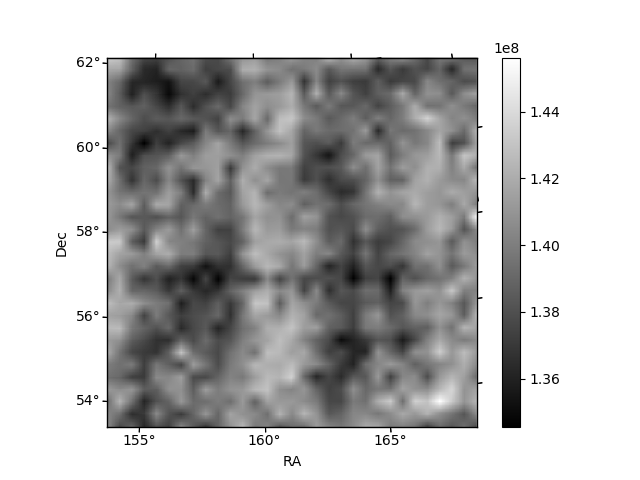
Histogram calculated using DETX and DETY for each event in the final _common_clean file
| Quadrant A | 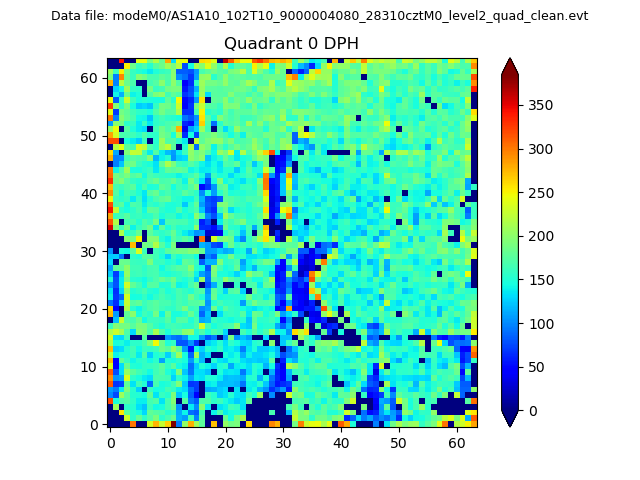 |
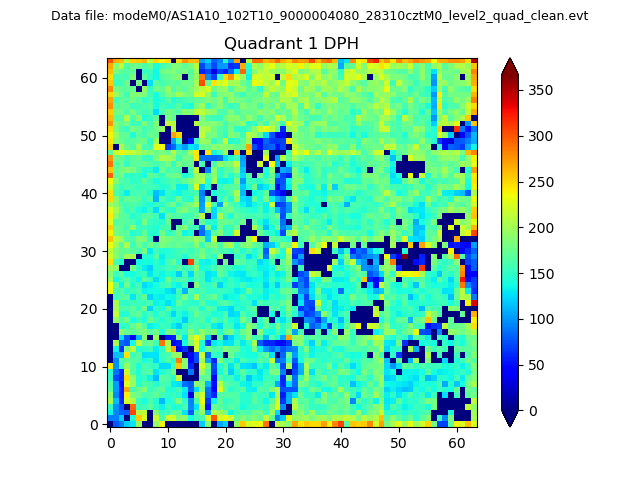 |
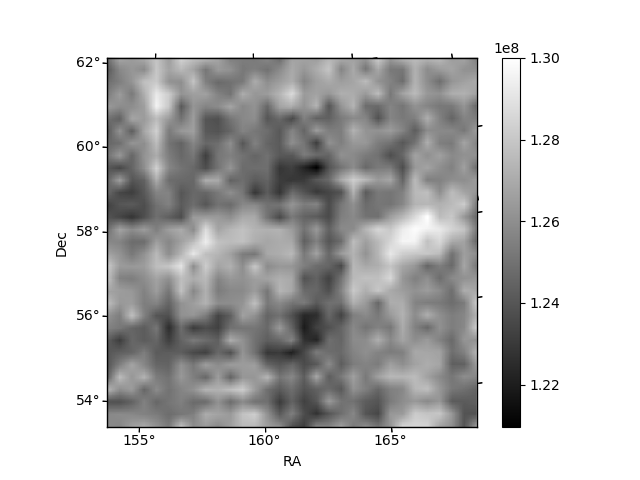
Quadrant B |
|---|---|---|---|
| Quadrant D | 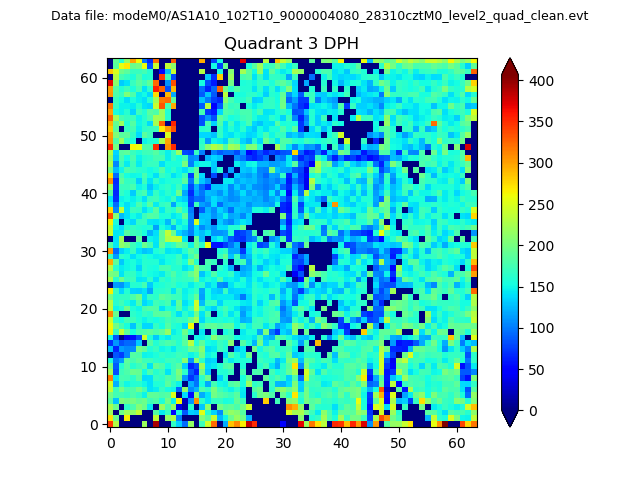 |
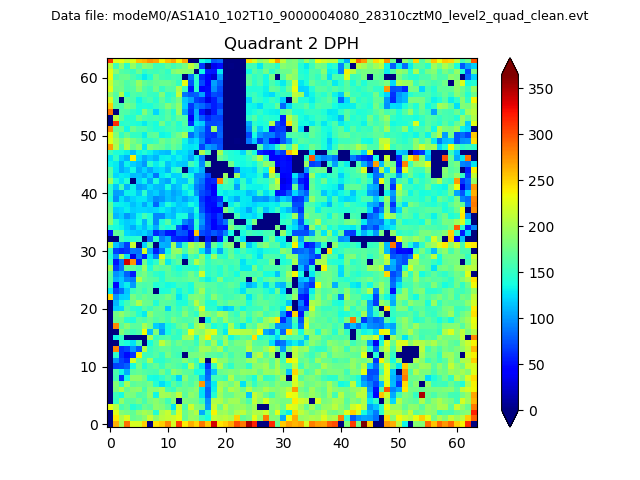 |
Quadrant C |
| Plot type | Count rate plots | Images |
|---|---|---|
| Comparison with Poisson distribution Blue bars denote a histogram of data divided into 1 sec bins. Red curve is a Poisson curve with rate = median count rate of data. |
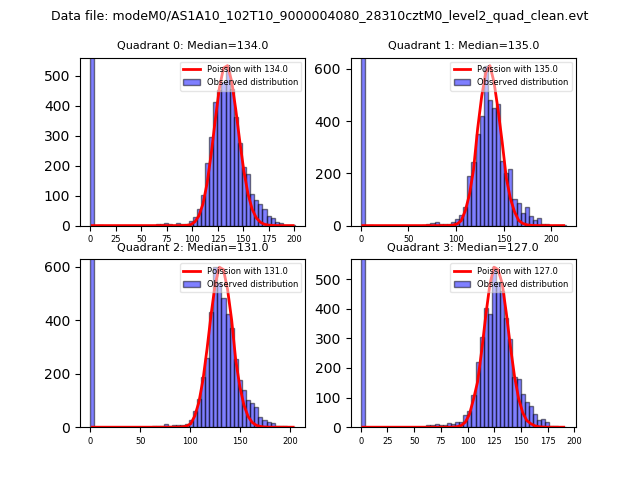 |
 |
| Quadrant-wise count rates Data is divided into 100 sec bins |
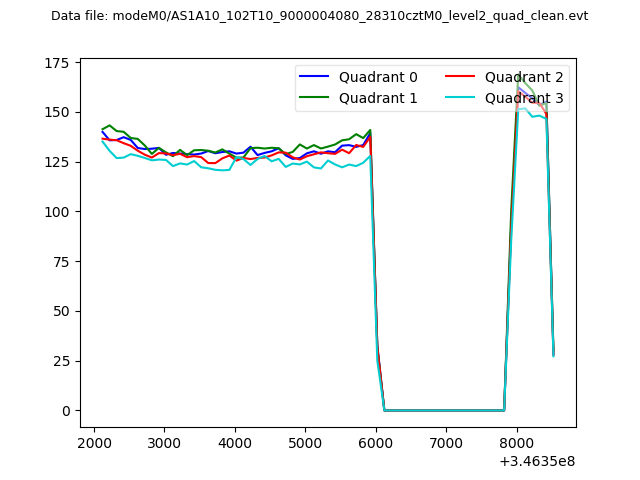 |
|
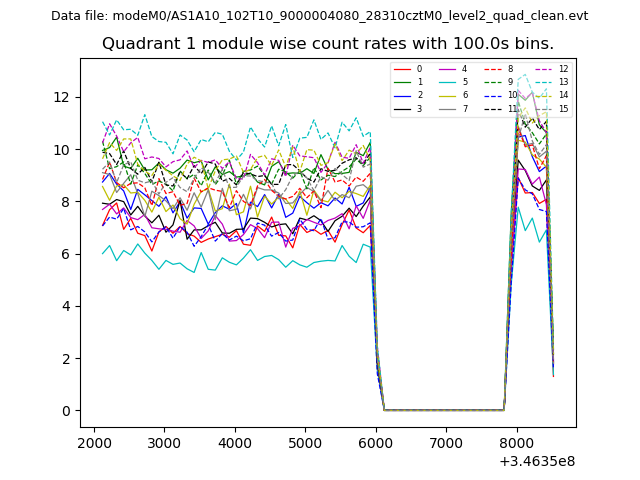
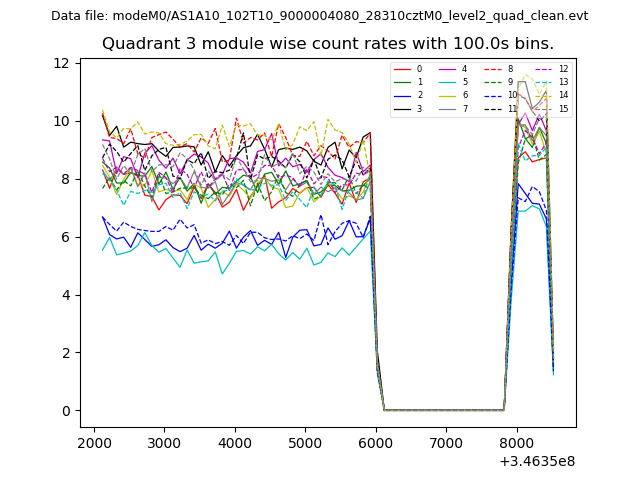
| Module-wise count rates for Quadrant A Data is divided into 100 sec bins |
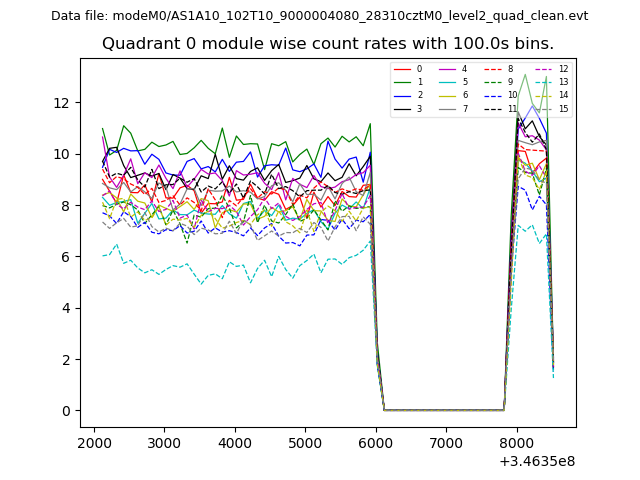 |
 |
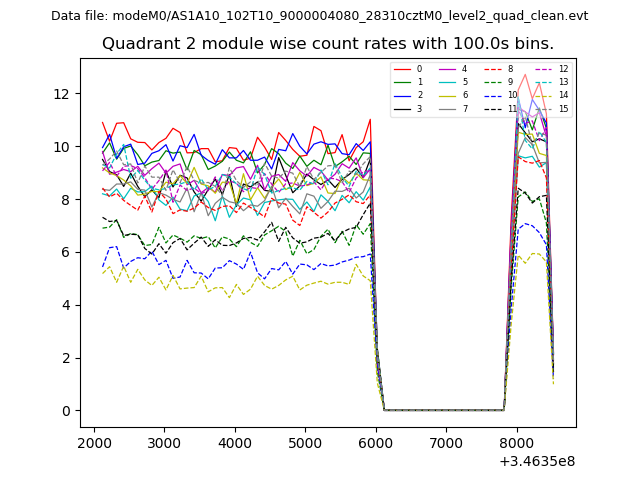
| Module-wise count rates for Quadrant B Data is divided into 100 sec bins |
 |
 |
| Module-wise count rates for Quadrant C Data is divided into 100 sec bins |
 |
 |
| Module-wise count rates for Quadrant D Data is divided into 100 sec bins |
 |
 |
| Parameter | Plot |
|---|---|
| CZT HV Monitor | 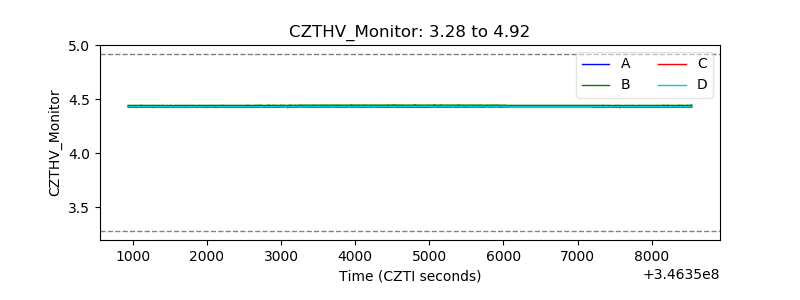 |
| D_VDD | 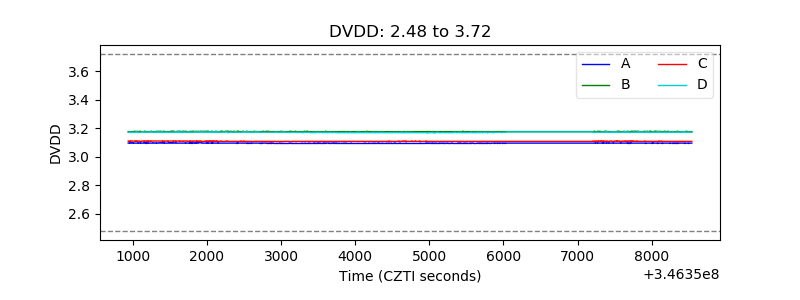 |
| Temperature 1 | 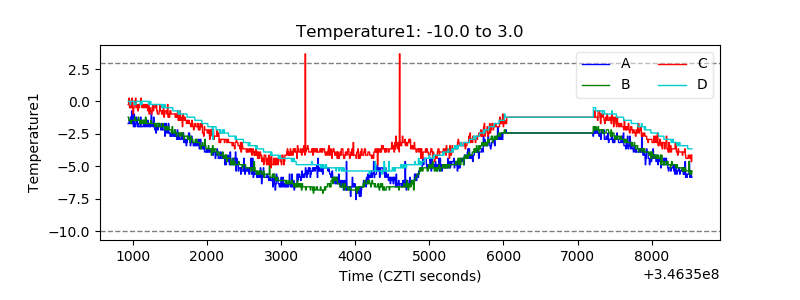 |
| Veto HV Monitor | 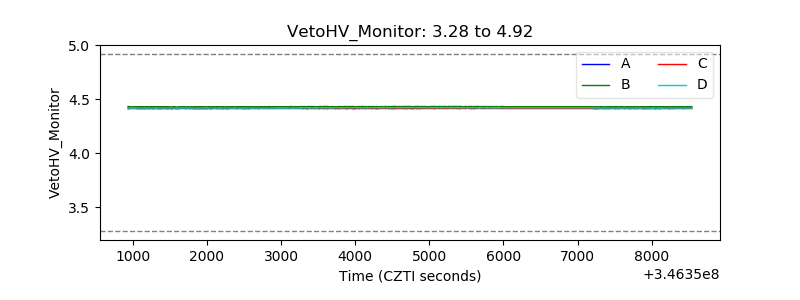 |
| Veto LLD | 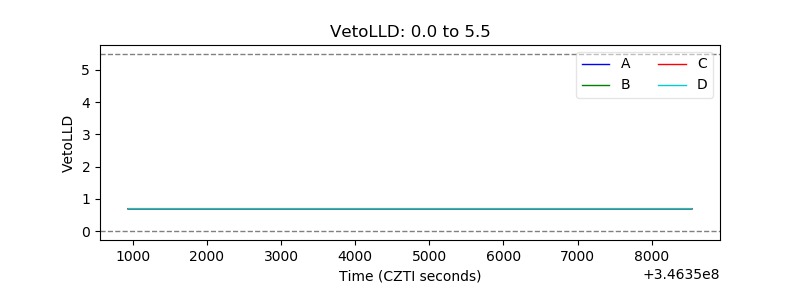 |
| Alpha Counter | 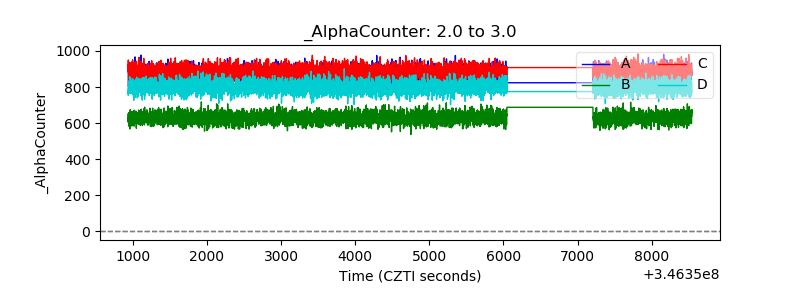 |
| _CPM_Rate | 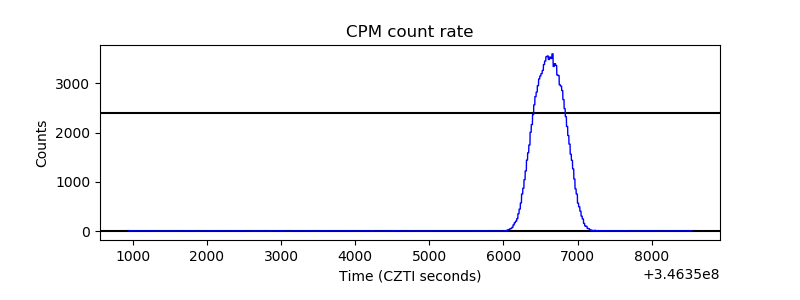 |
| CZT Counter | 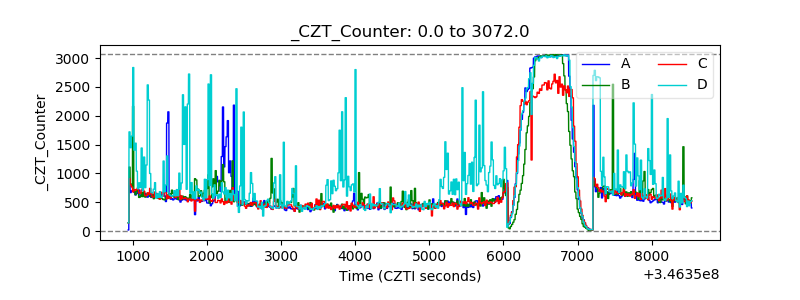 |
| +2.5 Volts monitor |  |
| +5 Volts monitor |  |
| _ROLL_ROT | 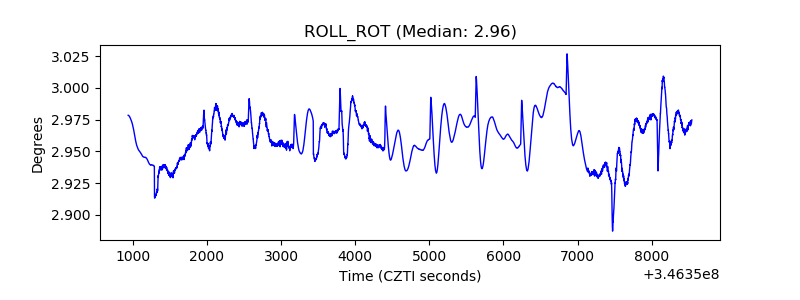 |
| _Roll_DEC | 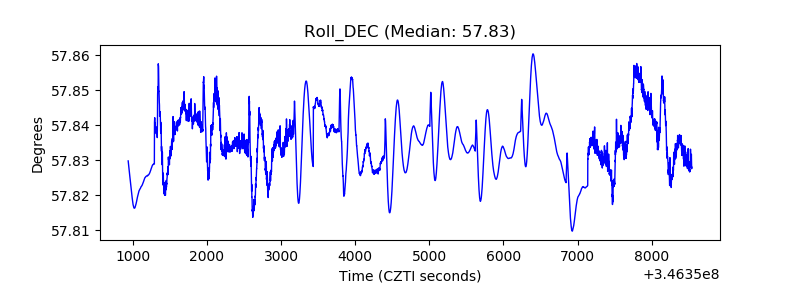 |
| _Roll_RA | 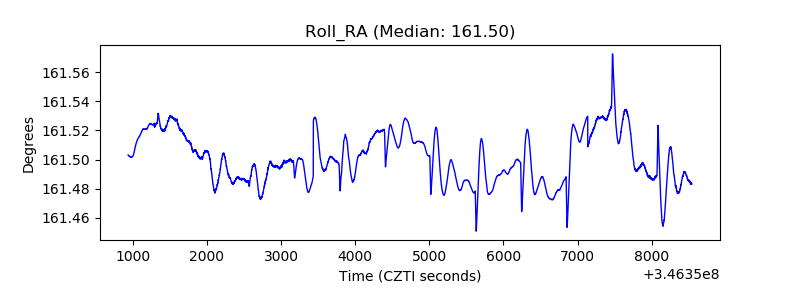 |
| Veto Counter | 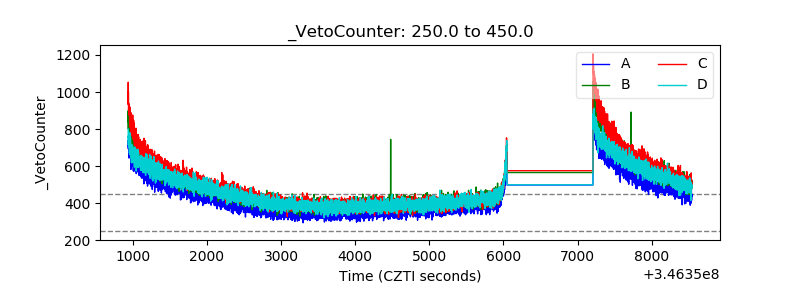 |