| Param | Original file | Final file |
|---|---|---|
| Filename | modeM0/AS1A10_102T10_9000004080_28311cztM0_level2.evt | modeM0/AS1A10_102T10_9000004080_28311cztM0_level2_quad_clean.evt |
| Size (bytes) | 542,090,880 | 108,331,200 |
| Size | 517.0 MB | 103.3 MB |
| Events in quadrant A | 3,274,050 | 718,866 |
| Events in quadrant B | 3,686,534 | 737,620 |
| Events in quadrant C | 3,379,537 | 716,405 |
| Events in quadrant D | 5,652,381 | 670,684 |
| Mode M0 | |||
|---|---|---|---|
| Quadrant | BADHDUFLAG | Total packets | Discarded packets |
| A | 0 | 13918 | 0 |
| B | 0 | 15167 | 0 |
| C | 0 | 14270 | 0 |
| D | 0 | 21183 | 0 |
| Mode M9 | |||
|---|---|---|---|
| Quadrant | BADHDUFLAG | Total packets | Discarded packets |
| A | 0 | 25 | 0 |
| B | 0 | 25 | 0 |
| C | 0 | 25 | 0 |
| D | 0 | 25 | 0 |
| Quadrant | Total seconds | Saturated seconds | Saturation percentage |
|---|---|---|---|
| A | 6272 | 92 | 1.466837% |
| B | 6273 | 170 | 2.710027% |
| C | 6273 | 156 | 2.486848% |
| D | 6272 | 543 | 8.657526% |
Noise dominated data is calculated using 1-second bins in cleaned event files. If a bin has >2000 counts, and if more than 50% of those come from <1% of pixels, then it is considered to be noise-dominated and hence unusable.
| Quadrant | # 1 sec bins | Bins with >0 counts | Bins with >2000 counts | High rate bins dominated by noise | Noise dominated (total time) | Noise dominated (detector-on time) | Marked lightcurve |
|---|---|---|---|---|---|---|---|
| A | 8712 | 6273 | 5 | 5 | 0.06% | 0.08% | 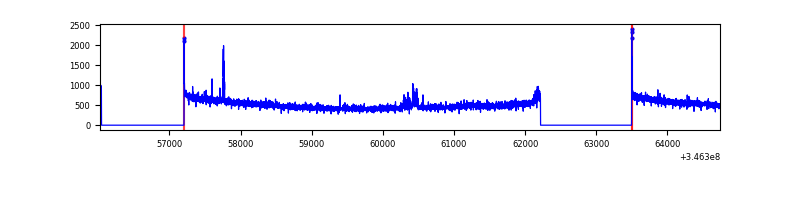 |
| B | 8713 | 6274 | 46 | 46 | 0.53% | 0.73% | 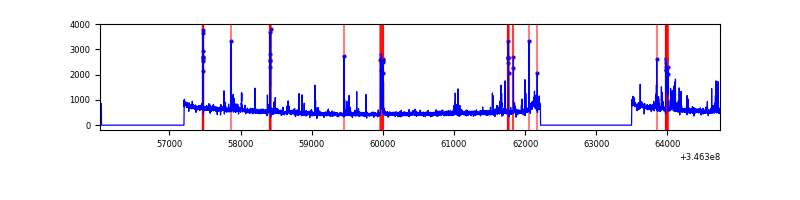 |
| C | 8713 | 6274 | 0 | 0 | 0.00% | 0.00% | 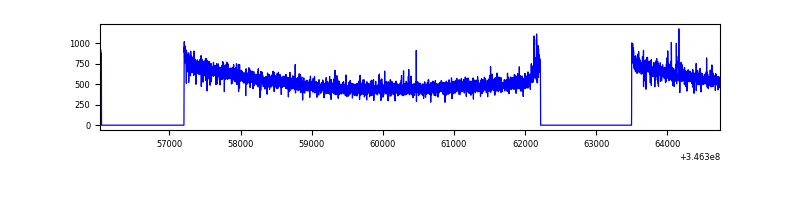 |
| D | 8712 | 6272 | 416 | 416 | 4.78% | 6.63% |  |
Top three noisy pixels from each quadrant. If the there are fewer than three noisy pixels in the level2.evt file, extra rows are filled as -1
| Pixel properties | Quadrant properties | ||||||
|---|---|---|---|---|---|---|---|
| Quadrant | DetID | PixID | Counts | Sigma | Mean | Median | Sigma |
| A | 15 | 174 | 33606 | 200.7 | 831 | 817 | 163.4 |
| A | 13 | 170 | 20029 | 117.6 | 831 | 817 | 163.4 |
| A | 8 | 192 | 14838 | 85.82 | 831 | 817 | 163.4 |
| B | 10 | 245 | 228653 | 1490.4 | 835 | 817 | 152.9 |
| B | 10 | 246 | 103761 | 673.41 | 835 | 817 | 152.9 |
| B | 4 | 200 | 55733 | 359.24 | 835 | 817 | 152.9 |
| C | 14 | 238 | 133573 | 706.85 | 820 | 829 | 187.8 |
| C | 3 | 233 | 35544 | 184.85 | 820 | 829 | 187.8 |
| C | 2 | 16 | 6539 | 30.41 | 820 | 829 | 187.8 |
| D | 1 | 52 | 1137040 | 6046.49 | 789 | 768 | 187.9 |
| D | 8 | 195 | 896226 | 4765.03 | 789 | 768 | 187.9 |
| D | 7 | 238 | 477262 | 2535.58 | 789 | 768 | 187.9 |
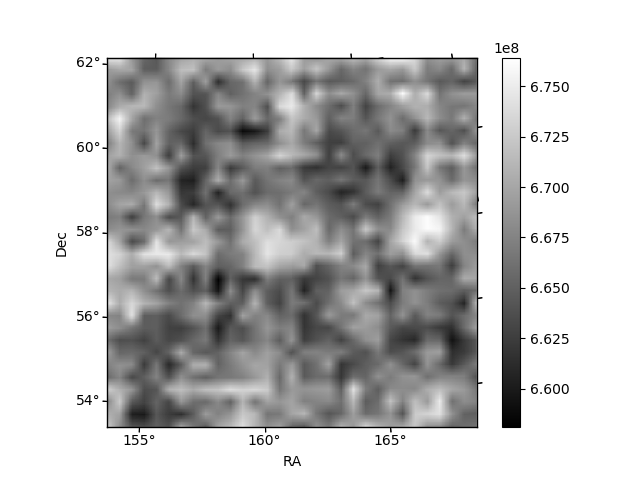
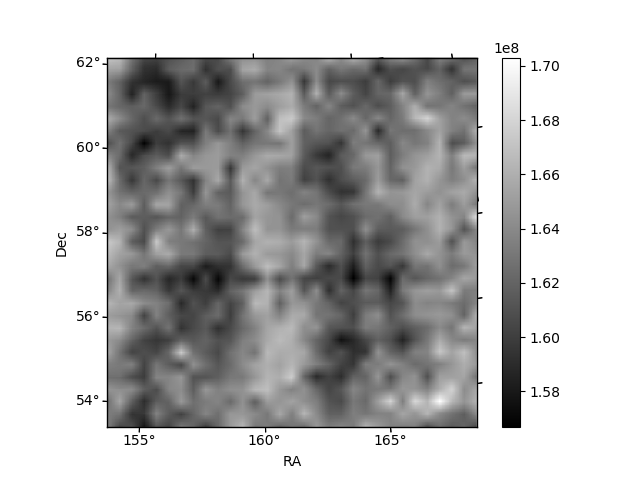
Histogram calculated using DETX and DETY for each event in the final _common_clean file
| Quadrant A |  |
 |
Quadrant B |
|---|---|---|---|
| Quadrant D |  |
 |
Quadrant C |
| Plot type | Count rate plots | Images |
|---|---|---|
| Comparison with Poisson distribution Blue bars denote a histogram of data divided into 1 sec bins. Red curve is a Poisson curve with rate = median count rate of data. |
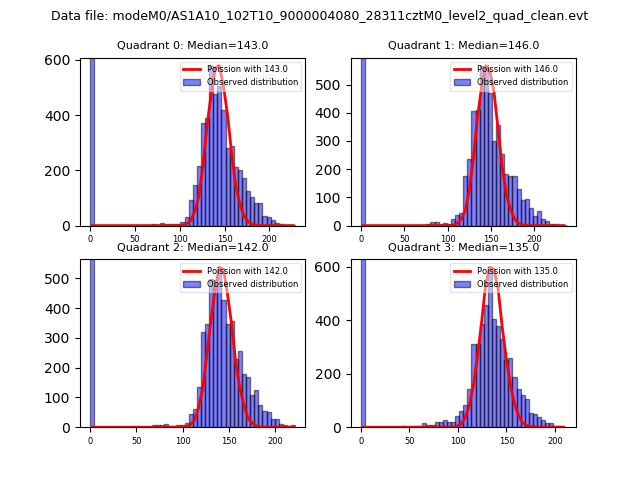 |
 |
| Quadrant-wise count rates Data is divided into 100 sec bins |
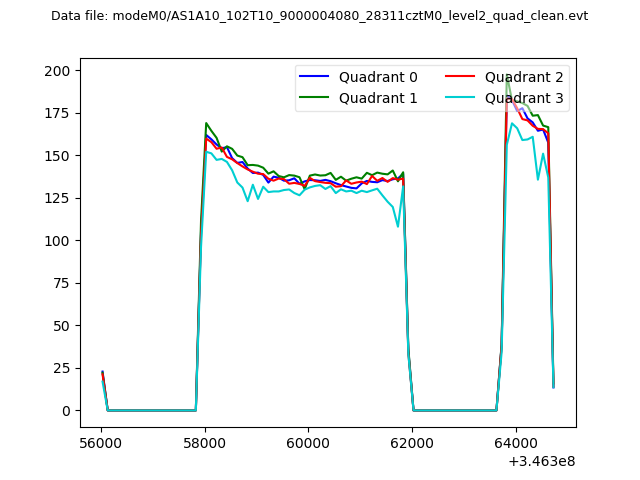 |
|
| Module-wise count rates for Quadrant A Data is divided into 100 sec bins |
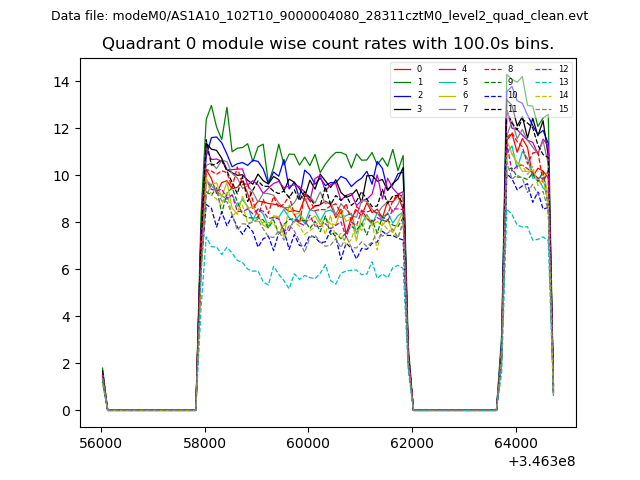 |
 |
| Module-wise count rates for Quadrant B Data is divided into 100 sec bins |
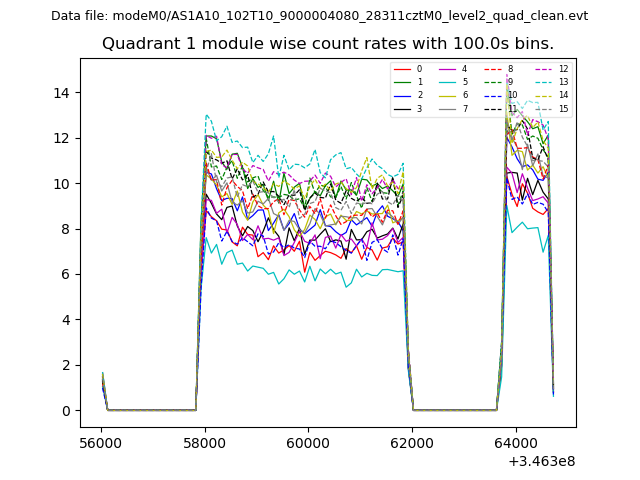 |
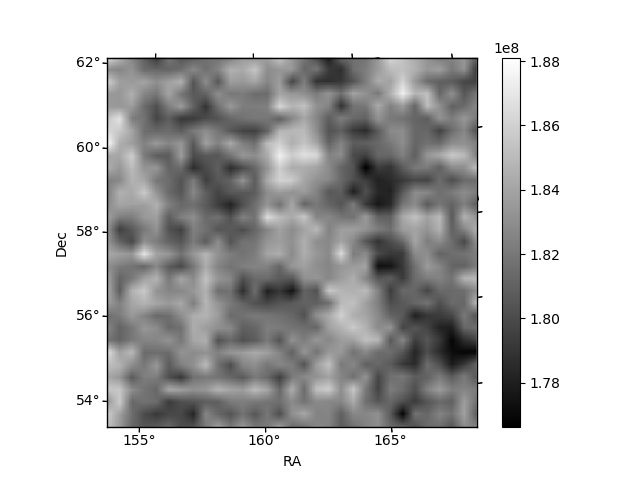 |
| Module-wise count rates for Quadrant C Data is divided into 100 sec bins |
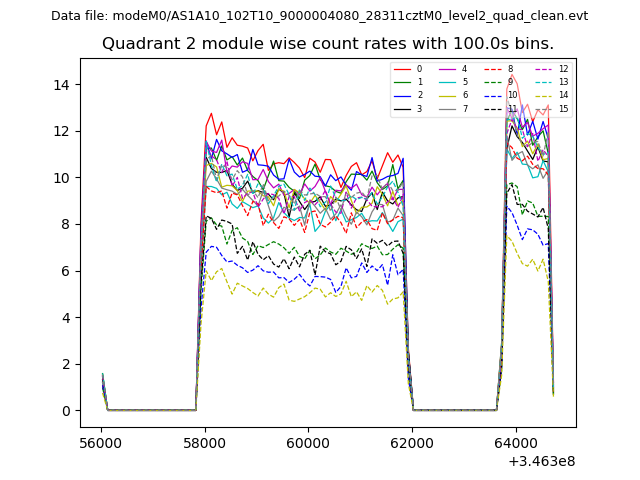 |
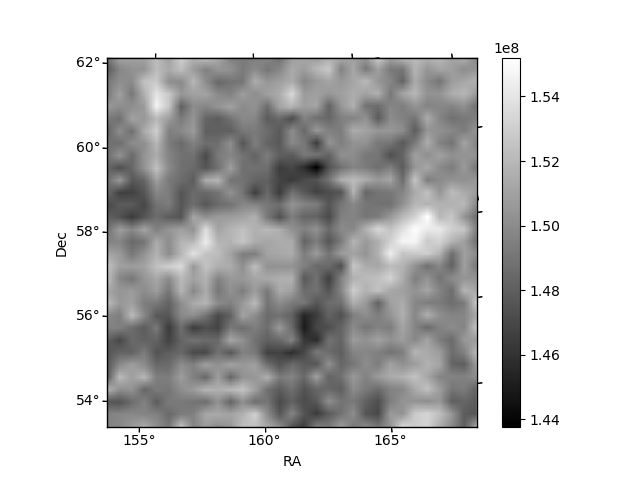 |
| Module-wise count rates for Quadrant D Data is divided into 100 sec bins |
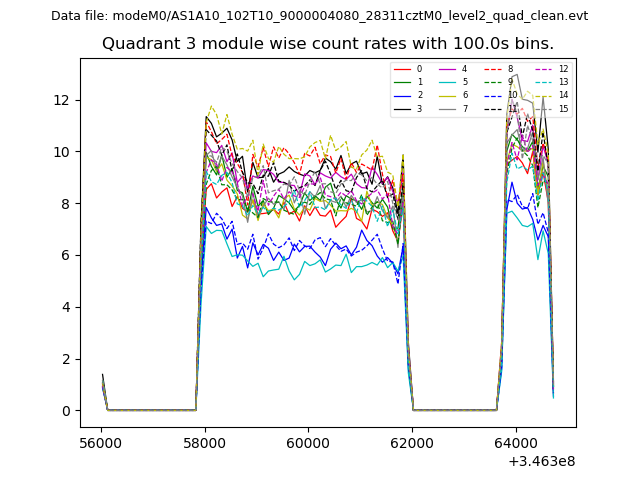 |
 |
| Parameter | Plot |
|---|---|
| CZT HV Monitor | 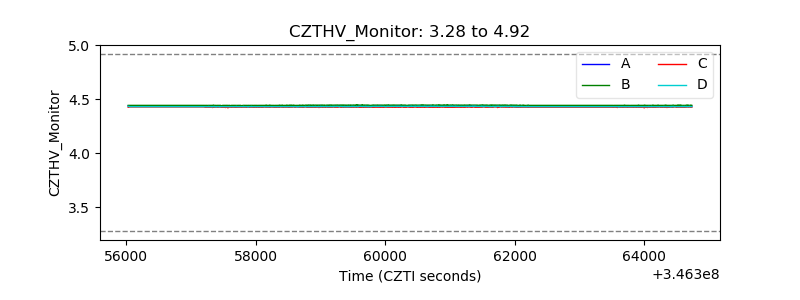 |
| D_VDD | 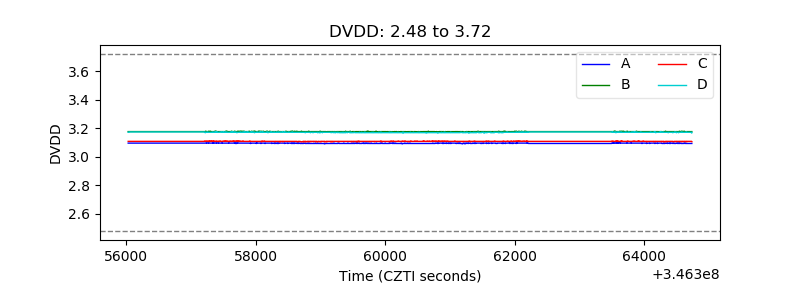 |
| Temperature 1 | 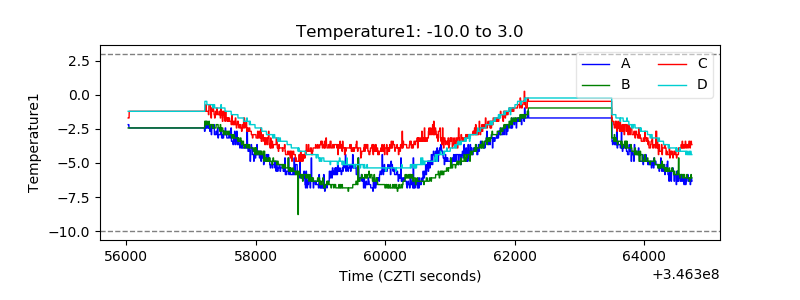 |
| Veto HV Monitor | 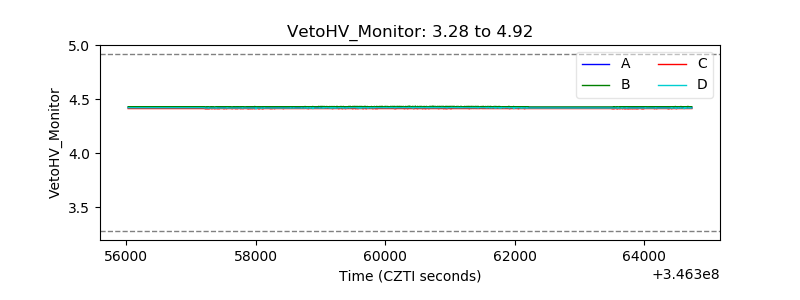 |
| Veto LLD | 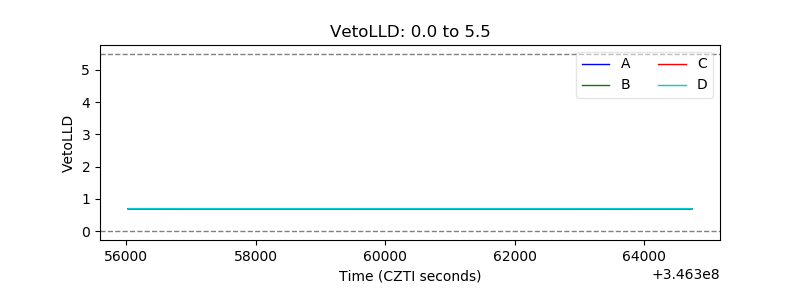 |
| Alpha Counter | 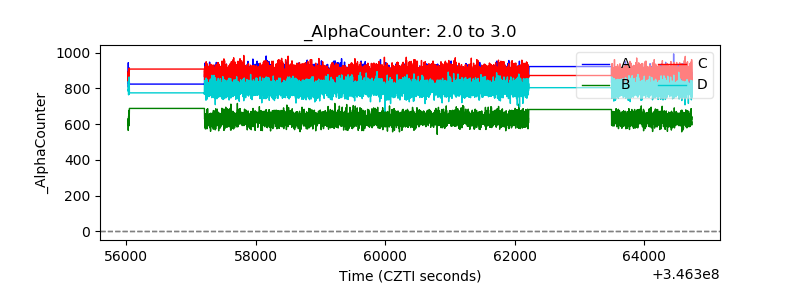 |
| _CPM_Rate | 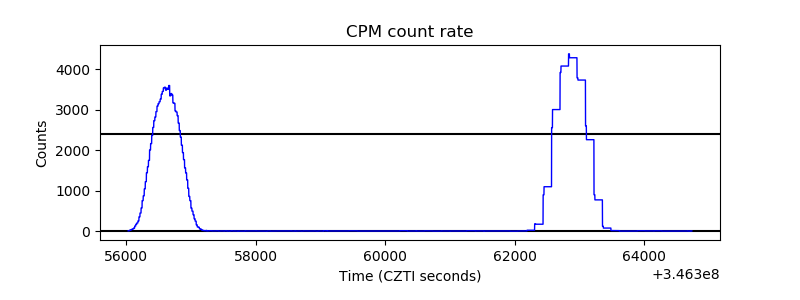 |
| CZT Counter |  |
| +2.5 Volts monitor |  |
| +5 Volts monitor |  |
| _ROLL_ROT | 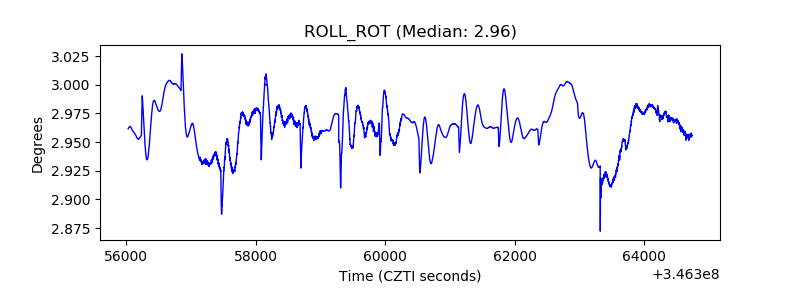 |
| _Roll_DEC | 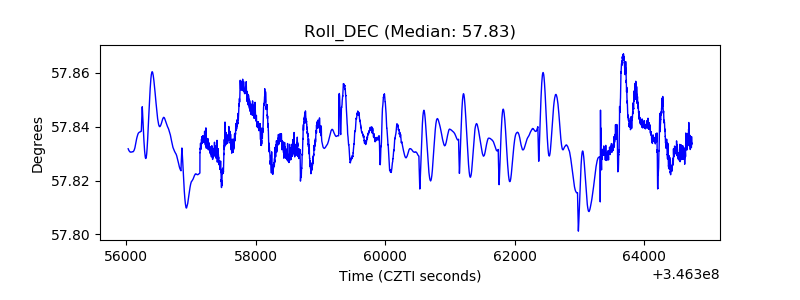 |
| _Roll_RA | 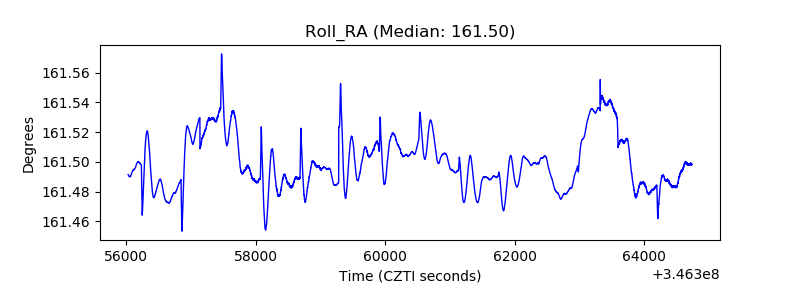 |
| Veto Counter | 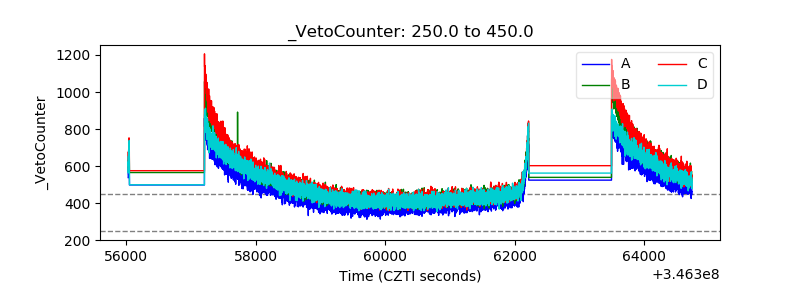 |