| Param | Original file | Final file |
|---|---|---|
| Filename | modeM0/AS1A10_102T10_9000004080_28312cztM0_level2.evt | modeM0/AS1A10_102T10_9000004080_28312cztM0_level2_quad_clean.evt |
| Size (bytes) | 575,403,840 | 121,417,920 |
| Size | 548.7 MB | 115.8 MB |
| Events in quadrant A | 3,208,956 | 826,326 |
| Events in quadrant B | 3,979,073 | 850,407 |
| Events in quadrant C | 3,348,031 | 824,110 |
| Events in quadrant D | 6,470,798 | 744,033 |
| Mode M0 | |||
|---|---|---|---|
| Quadrant | BADHDUFLAG | Total packets | Discarded packets |
| A | 0 | 13512 | 0 |
| B | 0 | 16046 | 0 |
| C | 0 | 13944 | 0 |
| D | 0 | 23583 | 0 |
| Mode M9 | |||
|---|---|---|---|
| Quadrant | BADHDUFLAG | Total packets | Discarded packets |
| A | 0 | 17 | 0 |
| B | 0 | 18 | 0 |
| C | 0 | 18 | 0 |
| D | 0 | 18 | 0 |
| Quadrant | Total seconds | Saturated seconds | Saturation percentage |
|---|---|---|---|
| A | 6201 | 44 | 0.709563% |
| B | 6201 | 160 | 2.580229% |
| C | 6201 | 101 | 1.628770% |
| D | 6201 | 737 | 11.885180% |
Noise dominated data is calculated using 1-second bins in cleaned event files. If a bin has >2000 counts, and if more than 50% of those come from <1% of pixels, then it is considered to be noise-dominated and hence unusable.
| Quadrant | # 1 sec bins | Bins with >0 counts | Bins with >2000 counts | High rate bins dominated by noise | Noise dominated (total time) | Noise dominated (detector-on time) | Marked lightcurve |
|---|---|---|---|---|---|---|---|
| A | 7536 | 6202 | 3 | 3 | 0.04% | 0.05% | 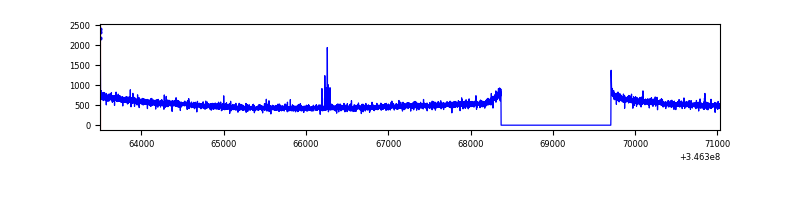 |
| B | 7536 | 6202 | 60 | 60 | 0.80% | 0.97% | 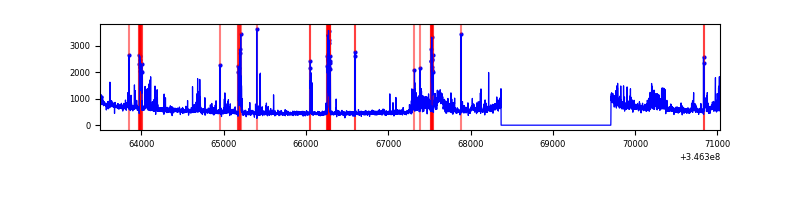 |
| C | 7536 | 6201 | 0 | 0 | 0.00% | 0.00% | 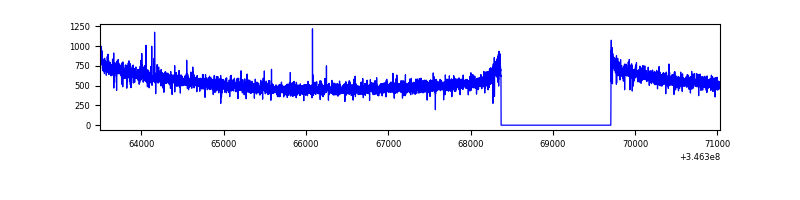 |
| D | 7536 | 6202 | 593 | 593 | 7.87% | 9.56% | 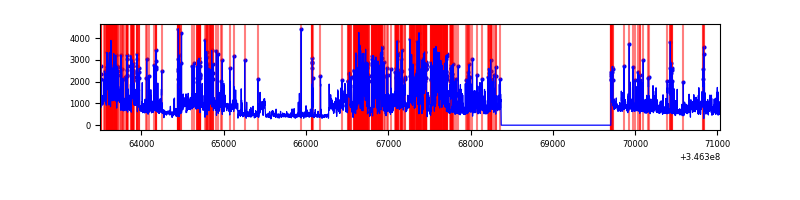 |
Top three noisy pixels from each quadrant. If the there are fewer than three noisy pixels in the level2.evt file, extra rows are filled as -1
| Pixel properties | Quadrant properties | ||||||
|---|---|---|---|---|---|---|---|
| Quadrant | DetID | PixID | Counts | Sigma | Mean | Median | Sigma |
| A | 1 | 113 | 12859 | 74.12 | 826 | 811 | 162.5 |
| A | 8 | 192 | 11809 | 67.66 | 826 | 811 | 162.5 |
| A | 13 | 254 | 11008 | 62.73 | 826 | 811 | 162.5 |
| B | 10 | 245 | 607450 | 3983.7 | 832 | 813 | 152.3 |
| B | 10 | 246 | 81771 | 531.64 | 832 | 813 | 152.3 |
| B | 4 | 200 | 18682 | 117.34 | 832 | 813 | 152.3 |
| C | 14 | 238 | 135361 | 717.59 | 818 | 826 | 187.5 |
| C | 3 | 233 | 19825 | 101.34 | 818 | 826 | 187.5 |
| C | 13 | 61 | 5673 | 25.85 | 818 | 826 | 187.5 |
| D | 1 | 52 | 1821077 | 10067.24 | 774 | 757 | 180.8 |
| D | 7 | 238 | 888223 | 4908.11 | 774 | 757 | 180.8 |
| D | 8 | 195 | 526027 | 2905.0 | 774 | 757 | 180.8 |
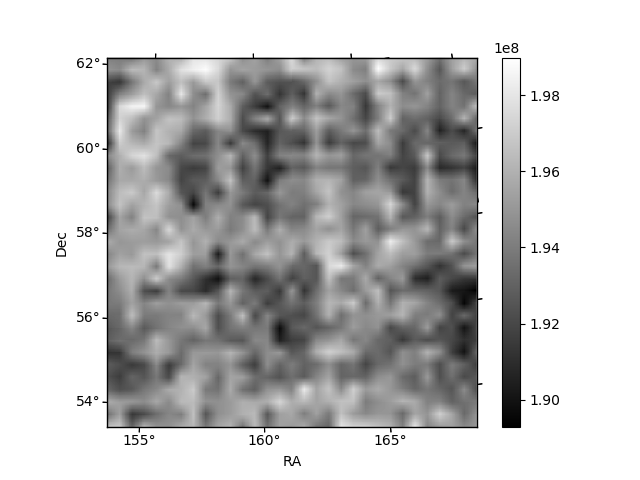
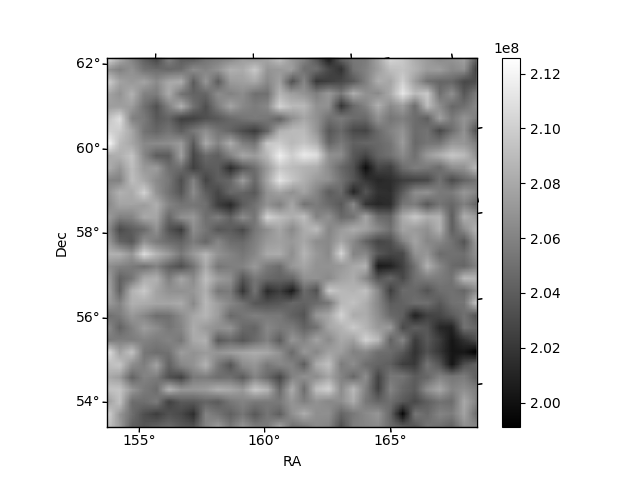
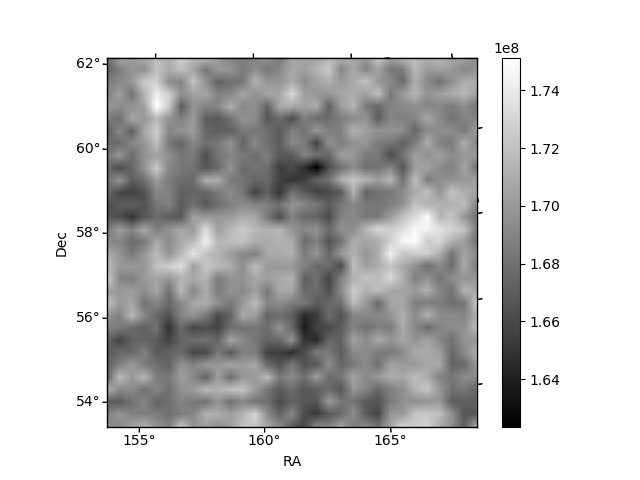
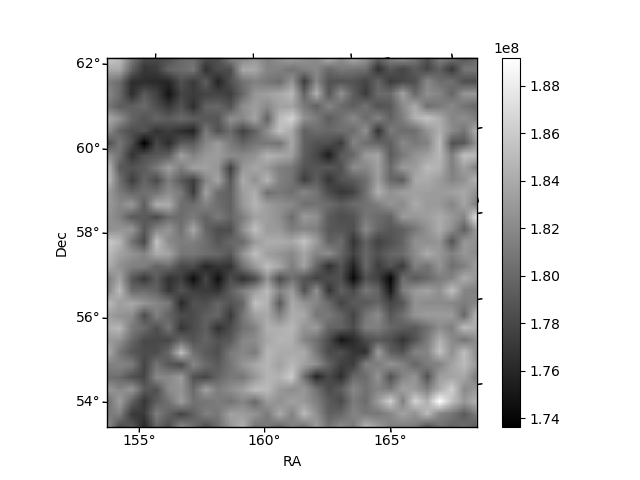
Histogram calculated using DETX and DETY for each event in the final _common_clean file
| Quadrant A |  |
 |
Quadrant B |
|---|---|---|---|
| Quadrant D |  |
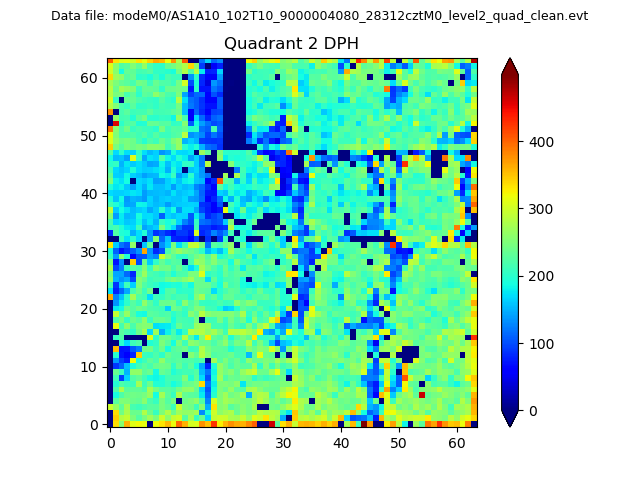 |
Quadrant C |
| Plot type | Count rate plots | Images |
|---|---|---|
| Comparison with Poisson distribution Blue bars denote a histogram of data divided into 1 sec bins. Red curve is a Poisson curve with rate = median count rate of data. |
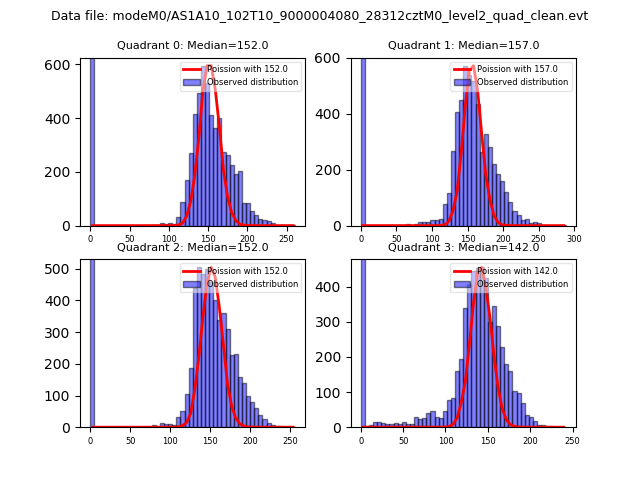 |
 |
| Quadrant-wise count rates Data is divided into 100 sec bins |
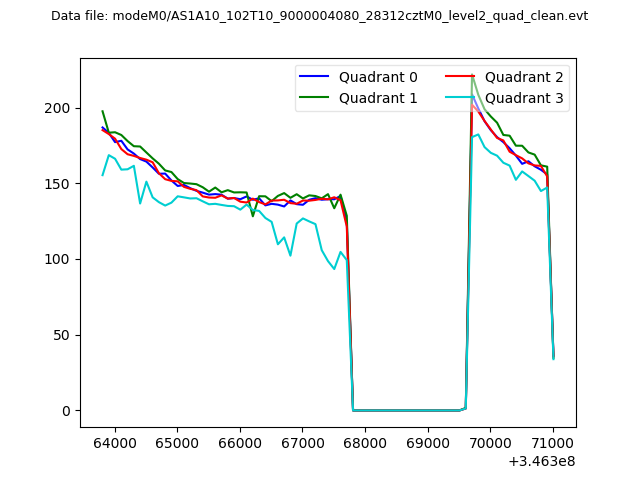 |
|
| Module-wise count rates for Quadrant A Data is divided into 100 sec bins |
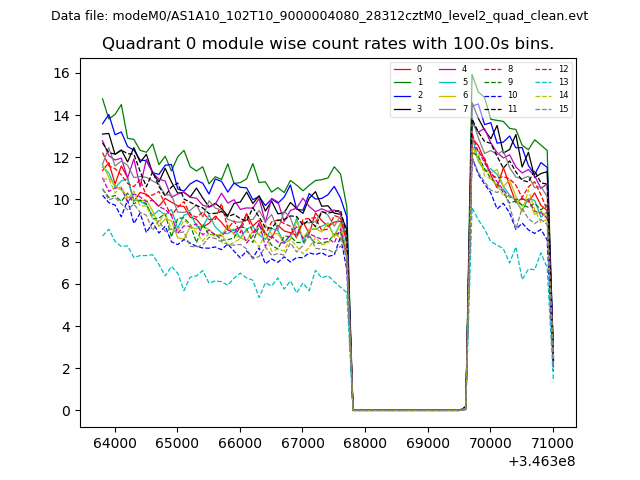 |
 |
| Module-wise count rates for Quadrant B Data is divided into 100 sec bins |
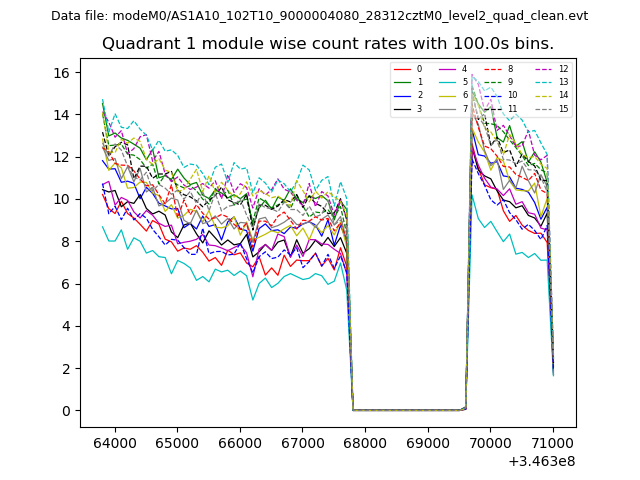 |
 |
| Module-wise count rates for Quadrant C Data is divided into 100 sec bins |
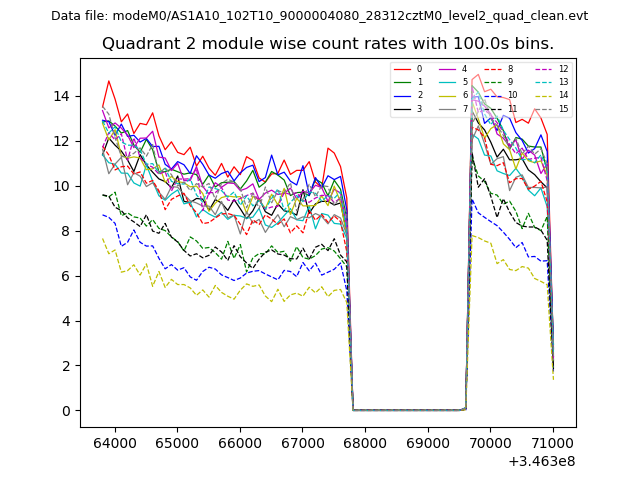 |
 |
| Module-wise count rates for Quadrant D Data is divided into 100 sec bins |
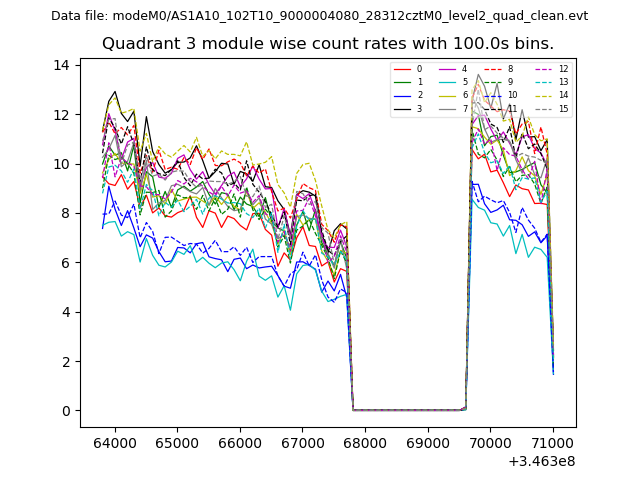 |
 |
| Parameter | Plot |
|---|---|
| CZT HV Monitor | 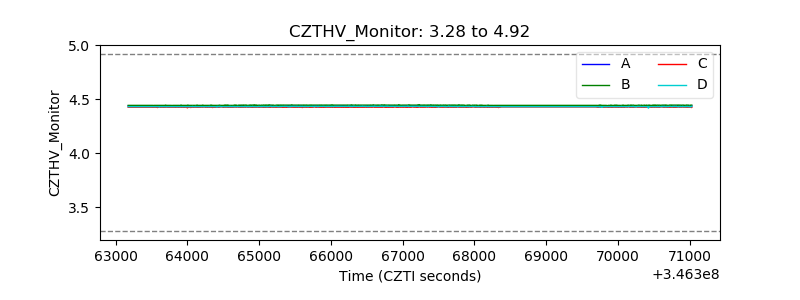 |
| D_VDD | 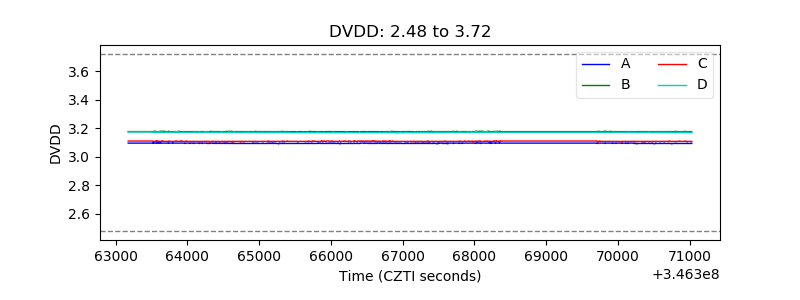 |
| Temperature 1 | 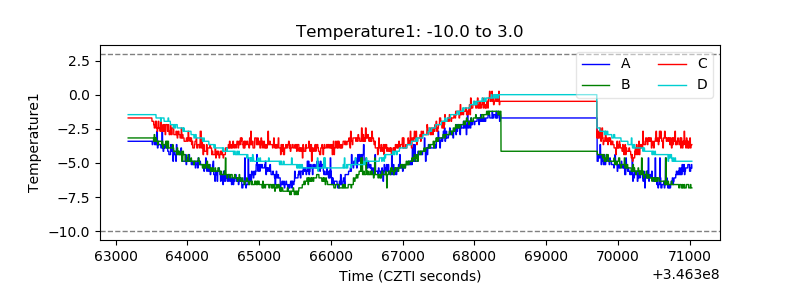 |
| Veto HV Monitor | 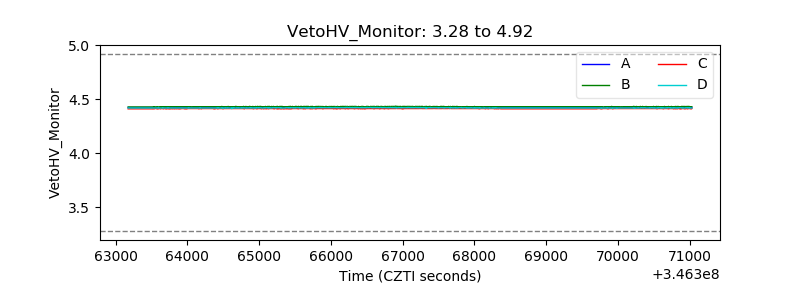 |
| Veto LLD |  |
| Alpha Counter | 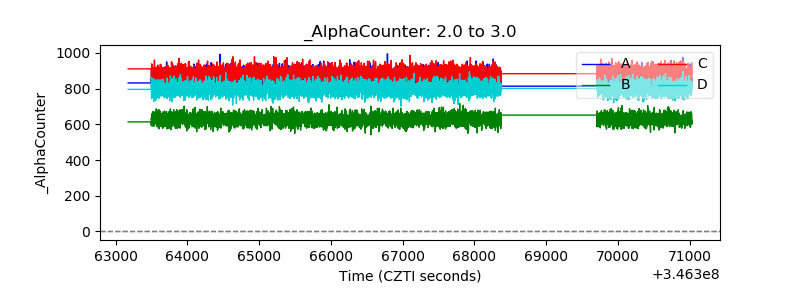 |
| _CPM_Rate | 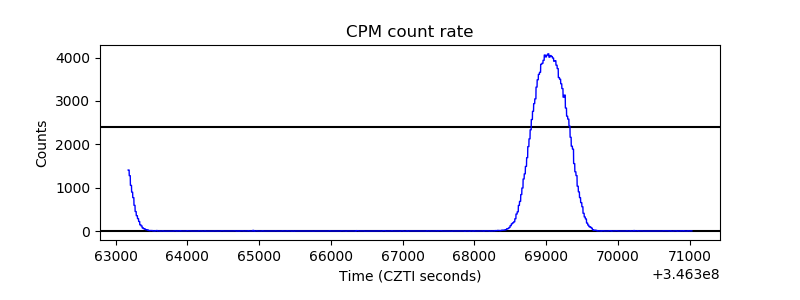 |
| CZT Counter | 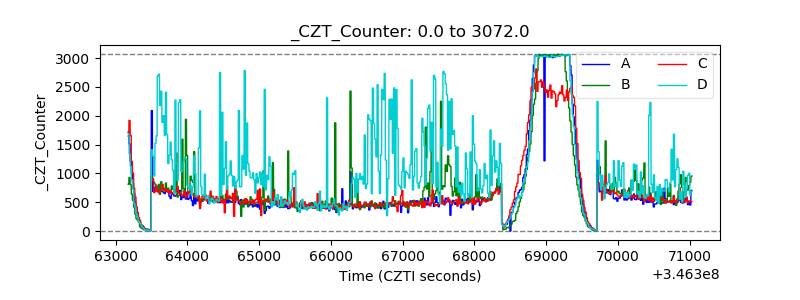 |
| +2.5 Volts monitor |  |
| +5 Volts monitor | 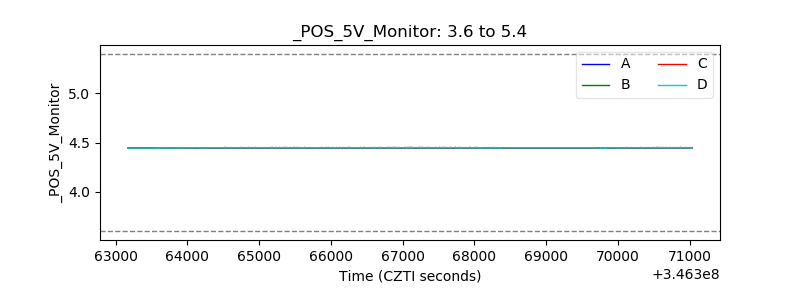 |
| _ROLL_ROT | 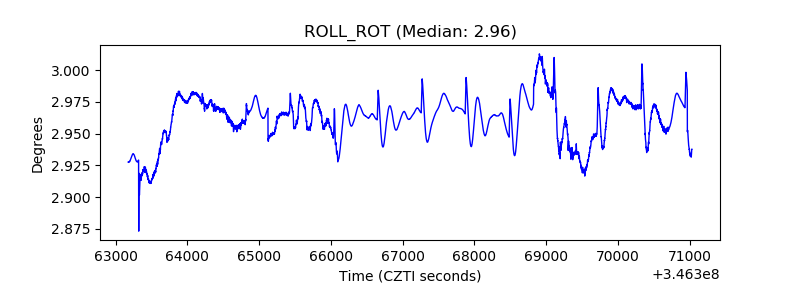 |
| _Roll_DEC | 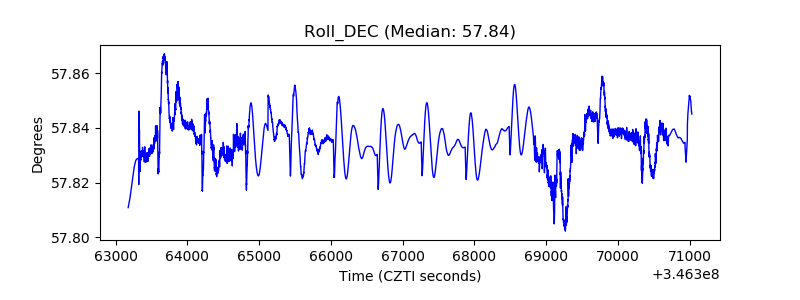 |
| _Roll_RA | 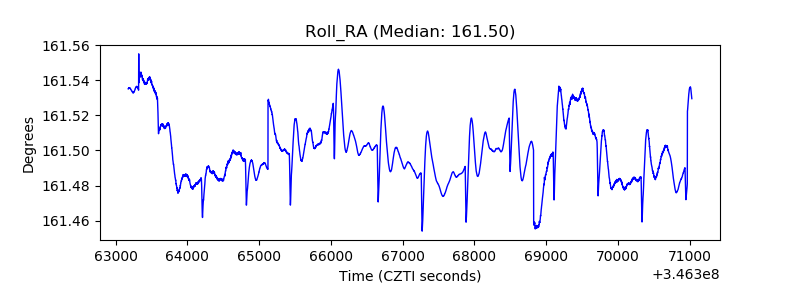 |
| Veto Counter | 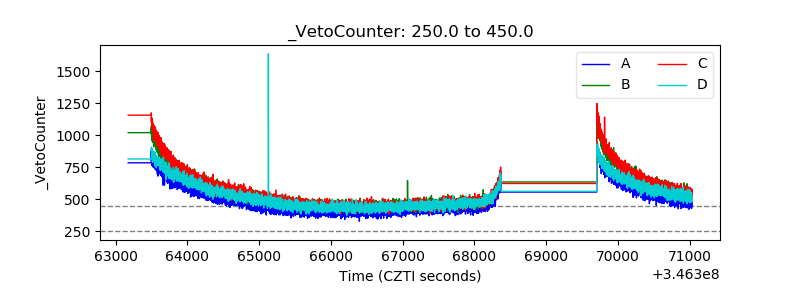 |