| Param | Original file | Final file |
|---|---|---|
| Filename | modeM0/AS1A10_102T10_9000004080_28313cztM0_level2.evt | modeM0/AS1A10_102T10_9000004080_28313cztM0_level2_quad_clean.evt |
| Size (bytes) | 500,097,600 | 117,996,480 |
| Size | 476.9 MB | 112.5 MB |
| Events in quadrant A | 3,082,004 | 793,275 |
| Events in quadrant B | 3,679,071 | 824,492 |
| Events in quadrant C | 3,167,175 | 794,944 |
| Events in quadrant D | 4,806,928 | 738,425 |
| Mode M0 | |||
|---|---|---|---|
| Quadrant | BADHDUFLAG | Total packets | Discarded packets |
| A | 0 | 12972 | 0 |
| B | 0 | 14859 | 0 |
| C | 0 | 13257 | 0 |
| D | 0 | 18436 | 0 |
| Mode M9 | |||
|---|---|---|---|
| Quadrant | BADHDUFLAG | Total packets | Discarded packets |
| A | 0 | 16 | 0 |
| B | 0 | 17 | 0 |
| C | 0 | 17 | 0 |
| D | 0 | 17 | 0 |
| Quadrant | Total seconds | Saturated seconds | Saturation percentage |
|---|---|---|---|
| A | 6057 | 29 | 0.478785% |
| B | 6057 | 101 | 1.667492% |
| C | 6056 | 84 | 1.387054% |
| D | 6056 | 252 | 4.161162% |
Noise dominated data is calculated using 1-second bins in cleaned event files. If a bin has >2000 counts, and if more than 50% of those come from <1% of pixels, then it is considered to be noise-dominated and hence unusable.
| Quadrant | # 1 sec bins | Bins with >0 counts | Bins with >2000 counts | High rate bins dominated by noise | Noise dominated (total time) | Noise dominated (detector-on time) | Marked lightcurve |
|---|---|---|---|---|---|---|---|
| A | 7437 | 6058 | 2 | 2 | 0.03% | 0.03% | 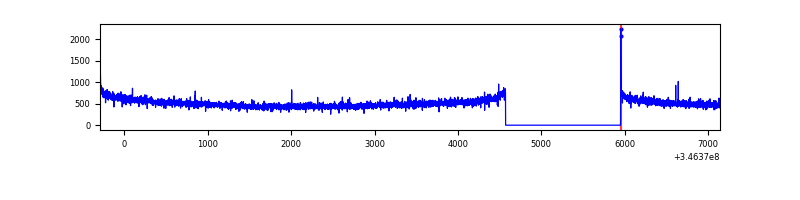 |
| B | 7437 | 6058 | 28 | 28 | 0.38% | 0.46% | 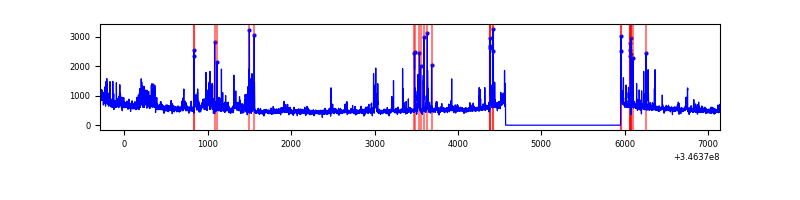 |
| C | 7436 | 6057 | 0 | 0 | 0.00% | 0.00% | 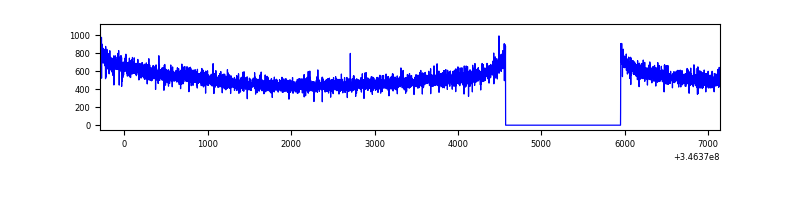 |
| D | 7435 | 6056 | 180 | 180 | 2.42% | 2.97% | 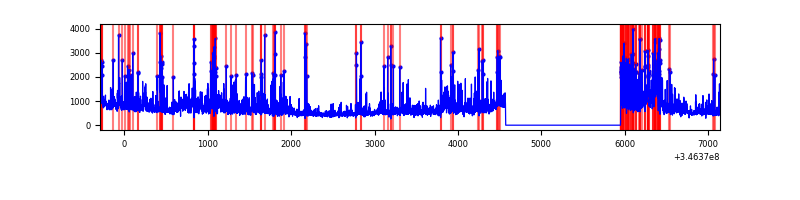 |
Top three noisy pixels from each quadrant. If the there are fewer than three noisy pixels in the level2.evt file, extra rows are filled as -1
| Pixel properties | Quadrant properties | ||||||
|---|---|---|---|---|---|---|---|
| Quadrant | DetID | PixID | Counts | Sigma | Mean | Median | Sigma |
| A | 13 | 254 | 10309 | 60.89 | 795 | 782 | 156.5 |
| A | 8 | 192 | 10153 | 59.9 | 795 | 782 | 156.5 |
| A | 3 | 137 | 7109 | 40.44 | 795 | 782 | 156.5 |
| B | 10 | 245 | 370271 | 2526.38 | 799 | 782 | 146.3 |
| B | 10 | 246 | 159933 | 1088.2 | 799 | 782 | 146.3 |
| B | 12 | 111 | 17197 | 112.24 | 799 | 782 | 146.3 |
| C | 14 | 238 | 128778 | 716.72 | 778 | 785 | 178.6 |
| C | 13 | 61 | 5302 | 25.29 | 778 | 785 | 178.6 |
| C | 3 | 233 | 3529 | 15.37 | 778 | 785 | 178.6 |
| D | 1 | 52 | 1524045 | 8562.05 | 760 | 740 | 177.9 |
| D | 2 | 250 | 171162 | 957.89 | 760 | 740 | 177.9 |
| D | 7 | 238 | 111838 | 624.45 | 760 | 740 | 177.9 |
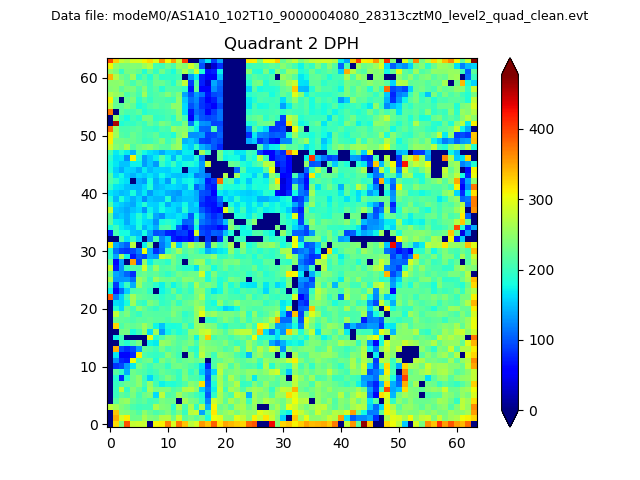
Histogram calculated using DETX and DETY for each event in the final _common_clean file
| Quadrant A | 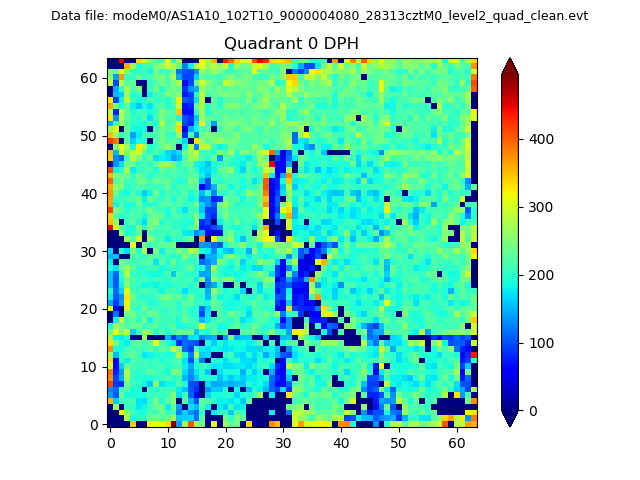 |
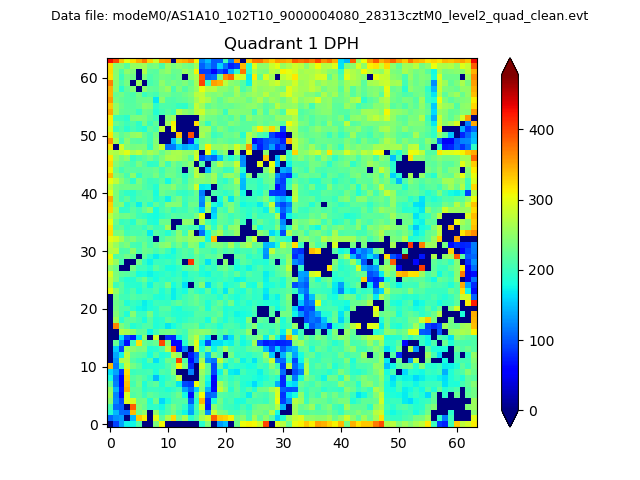 |
Quadrant B |
|---|---|---|---|
| Quadrant D | 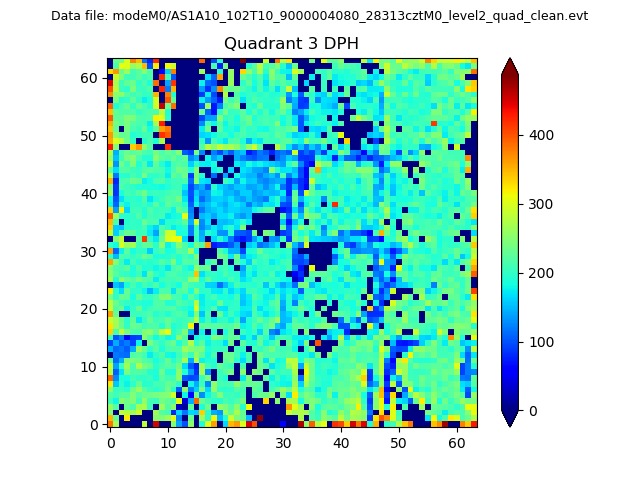 |
 |
Quadrant C |
| Plot type | Count rate plots | Images |
|---|---|---|
| Comparison with Poisson distribution Blue bars denote a histogram of data divided into 1 sec bins. Red curve is a Poisson curve with rate = median count rate of data. |
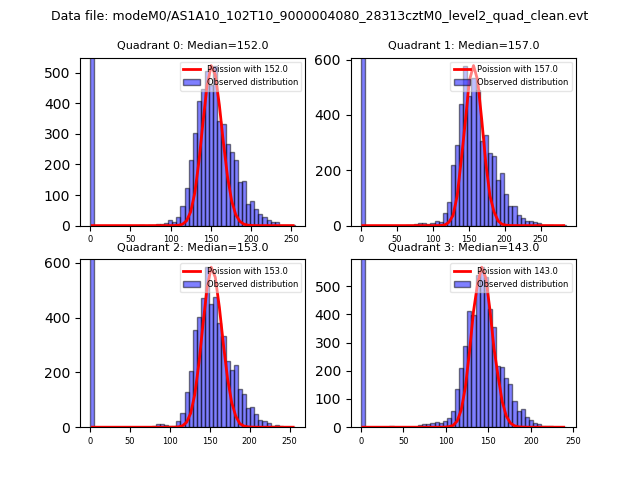 |
 |
| Quadrant-wise count rates Data is divided into 100 sec bins |
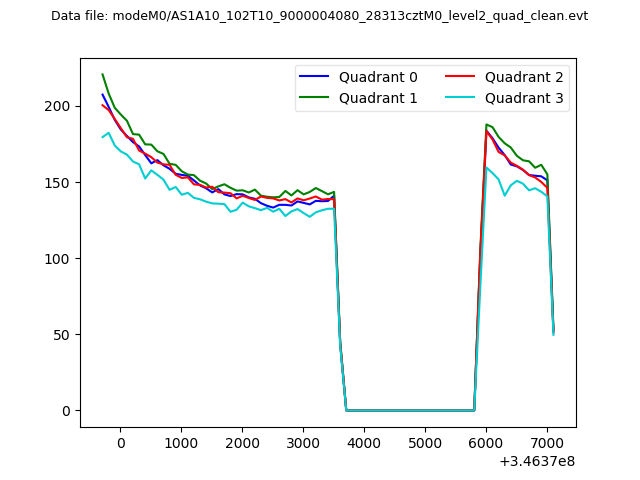 |
|
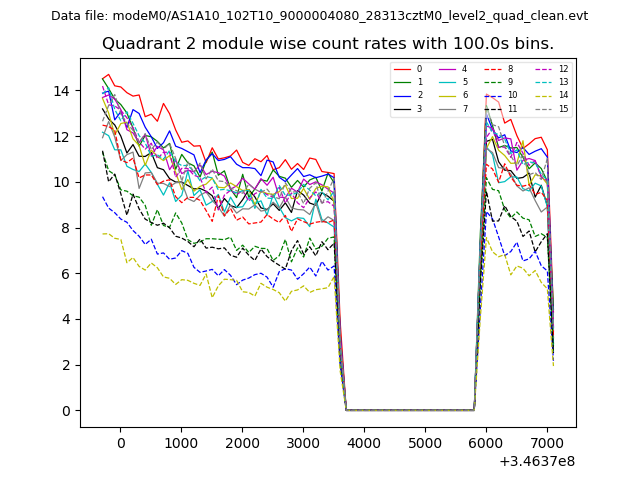
| Module-wise count rates for Quadrant A Data is divided into 100 sec bins |
 |
 |
| Module-wise count rates for Quadrant B Data is divided into 100 sec bins |
 |
 |
| Module-wise count rates for Quadrant C Data is divided into 100 sec bins |
 |
 |
| Module-wise count rates for Quadrant D Data is divided into 100 sec bins |
 |
 |
| Parameter | Plot |
|---|---|
| CZT HV Monitor | 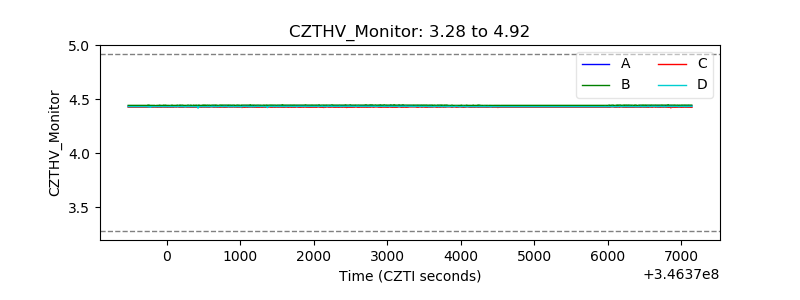 |
| D_VDD |  |
| Temperature 1 | 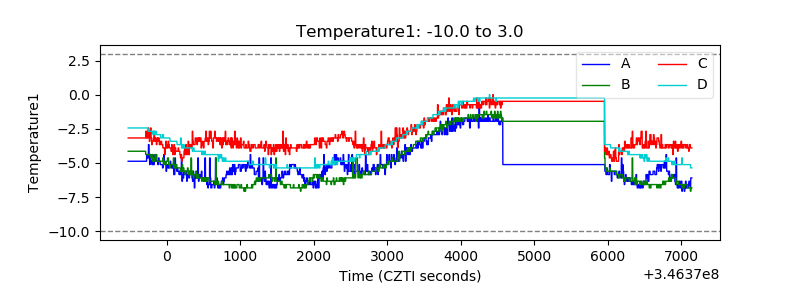 |
| Veto HV Monitor | 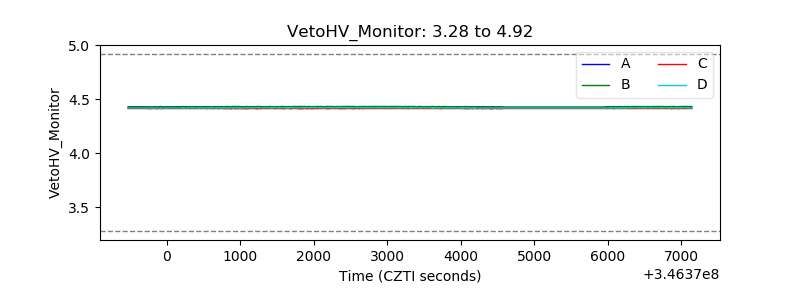 |
| Veto LLD |  |
| Alpha Counter | 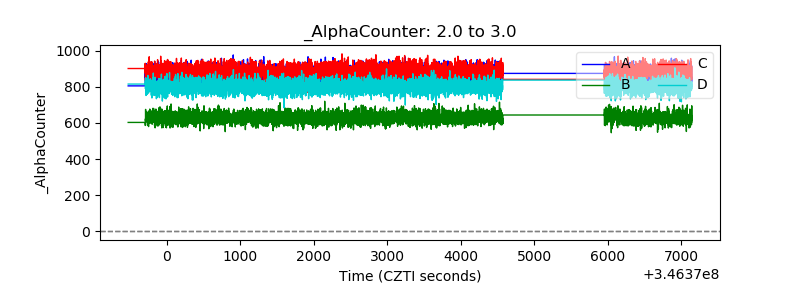 |
| _CPM_Rate | 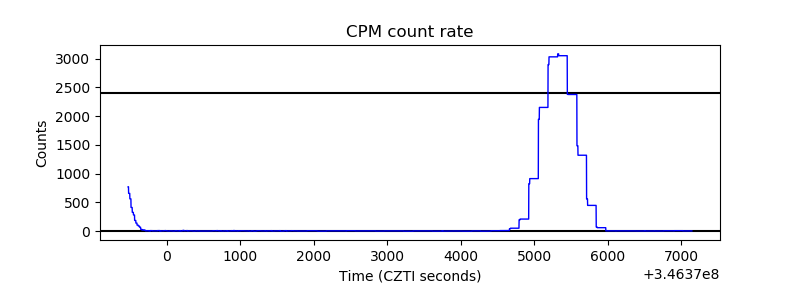 |
| CZT Counter | 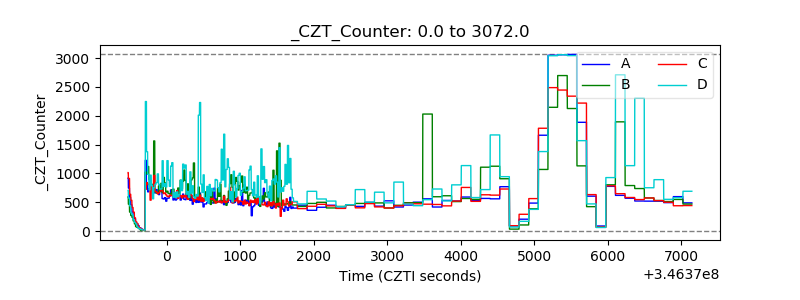 |
| +2.5 Volts monitor |  |
| +5 Volts monitor |  |
| _ROLL_ROT | 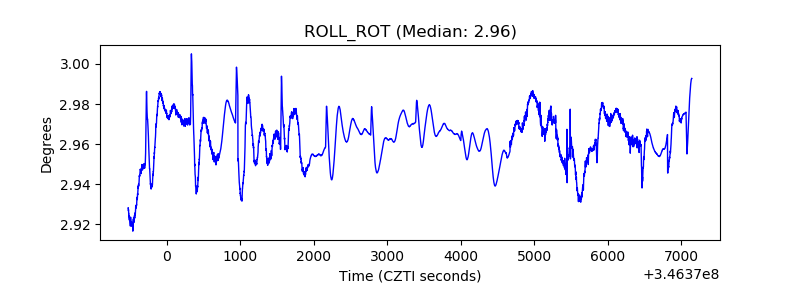 |
| _Roll_DEC | 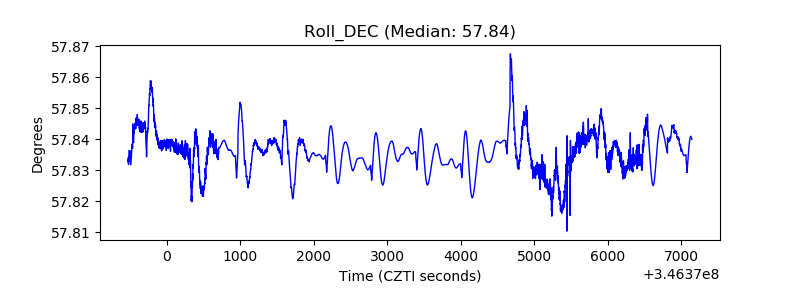 |
| _Roll_RA | 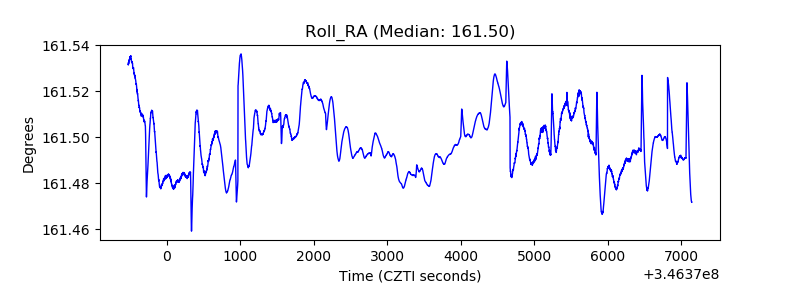 |
| Veto Counter |  |