| Param | Original file | Final file |
|---|---|---|
| Filename | modeM0/AS1A10_102T10_9000004080_28314cztM0_level2.evt | modeM0/AS1A10_102T10_9000004080_28314cztM0_level2_quad_clean.evt |
| Size (bytes) | 517,806,720 | 108,889,920 |
| Size | 493.8 MB | 103.8 MB |
| Events in quadrant A | 3,130,567 | 722,856 |
| Events in quadrant B | 3,650,792 | 747,052 |
| Events in quadrant C | 3,210,301 | 718,671 |
| Events in quadrant D | 5,257,094 | 663,799 |
| Mode M0 | |||
|---|---|---|---|
| Quadrant | BADHDUFLAG | Total packets | Discarded packets |
| A | 0 | 13369 | 0 |
| B | 0 | 14828 | 0 |
| C | 0 | 13546 | 0 |
| D | 0 | 19960 | 0 |
| Mode M9 | |||
|---|---|---|---|
| Quadrant | BADHDUFLAG | Total packets | Discarded packets |
| A | 0 | 26 | 0 |
| B | 0 | 26 | 0 |
| C | 0 | 26 | 0 |
| D | 0 | 26 | 0 |
| Quadrant | Total seconds | Saturated seconds | Saturation percentage |
|---|---|---|---|
| A | 6377 | 47 | 0.737024% |
| B | 6377 | 124 | 1.944488% |
| C | 6377 | 106 | 1.662224% |
| D | 6377 | 434 | 6.805708% |
Noise dominated data is calculated using 1-second bins in cleaned event files. If a bin has >2000 counts, and if more than 50% of those come from <1% of pixels, then it is considered to be noise-dominated and hence unusable.
| Quadrant | # 1 sec bins | Bins with >0 counts | Bins with >2000 counts | High rate bins dominated by noise | Noise dominated (total time) | Noise dominated (detector-on time) | Marked lightcurve |
|---|---|---|---|---|---|---|---|
| A | 9007 | 6379 | 3 | 3 | 0.03% | 0.05% | 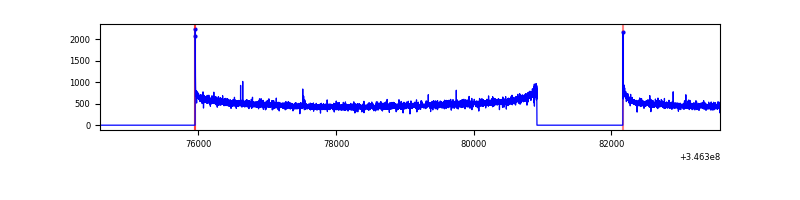 |
| B | 9007 | 6379 | 42 | 42 | 0.47% | 0.66% | 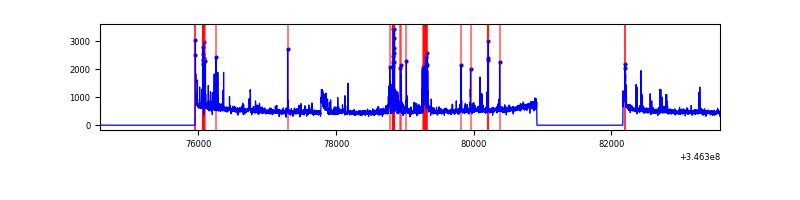 |
| C | 9007 | 6379 | 0 | 0 | 0.00% | 0.00% | 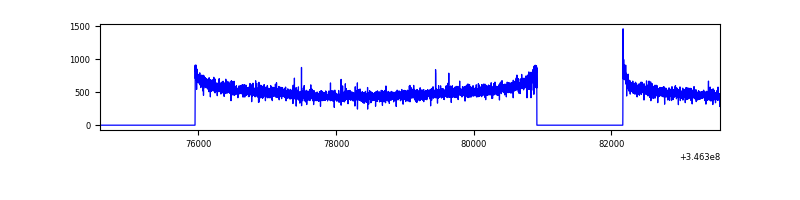 |
| D | 9007 | 6379 | 297 | 297 | 3.30% | 4.66% | 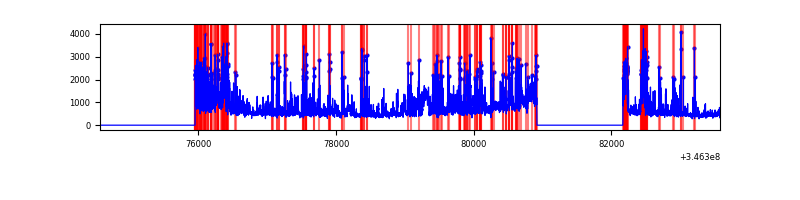 |
Top three noisy pixels from each quadrant. If the there are fewer than three noisy pixels in the level2.evt file, extra rows are filled as -1
| Pixel properties | Quadrant properties | ||||||
|---|---|---|---|---|---|---|---|
| Quadrant | DetID | PixID | Counts | Sigma | Mean | Median | Sigma |
| A | 8 | 192 | 11588 | 67.87 | 806 | 792 | 159.1 |
| A | 13 | 254 | 11108 | 64.85 | 806 | 792 | 159.1 |
| A | 3 | 137 | 7447 | 41.84 | 806 | 792 | 159.1 |
| B | 10 | 245 | 353470 | 2330.18 | 812 | 793 | 151.4 |
| B | 10 | 246 | 101730 | 666.9 | 812 | 793 | 151.4 |
| B | 12 | 111 | 18283 | 115.56 | 812 | 793 | 151.4 |
| C | 14 | 238 | 130795 | 717.41 | 786 | 792 | 181.2 |
| C | 3 | 233 | 16223 | 85.15 | 786 | 792 | 181.2 |
| C | 13 | 61 | 5658 | 26.85 | 786 | 792 | 181.2 |
| D | 1 | 52 | 1678586 | 9407.87 | 756 | 735 | 178.3 |
| D | 2 | 250 | 216714 | 1211.01 | 756 | 735 | 178.3 |
| D | 13 | 104 | 145614 | 812.35 | 756 | 735 | 178.3 |
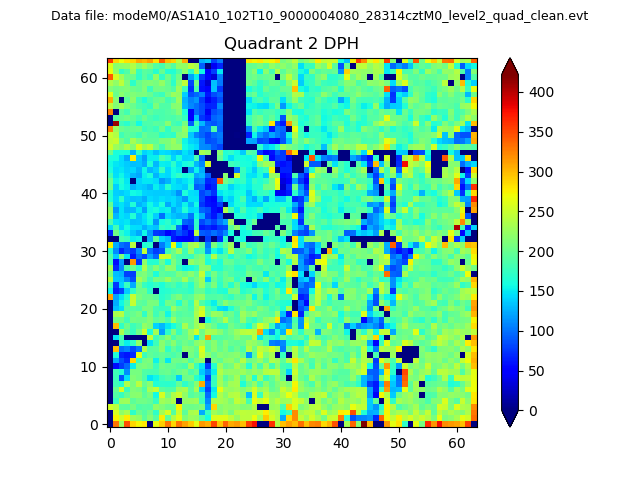
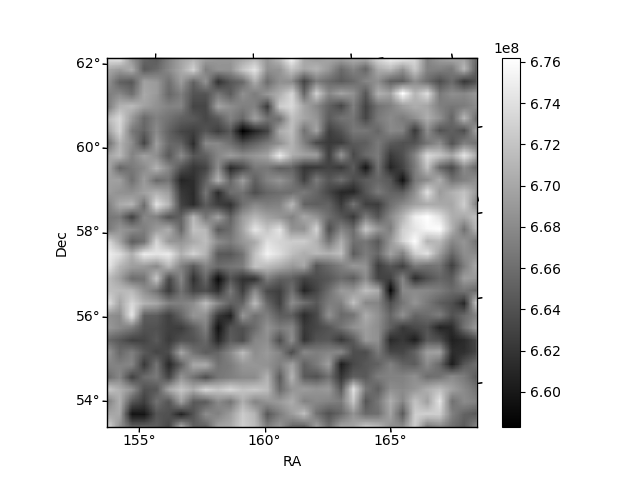
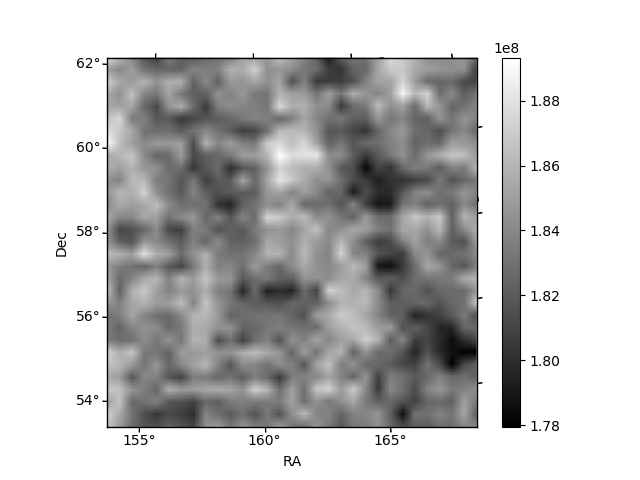
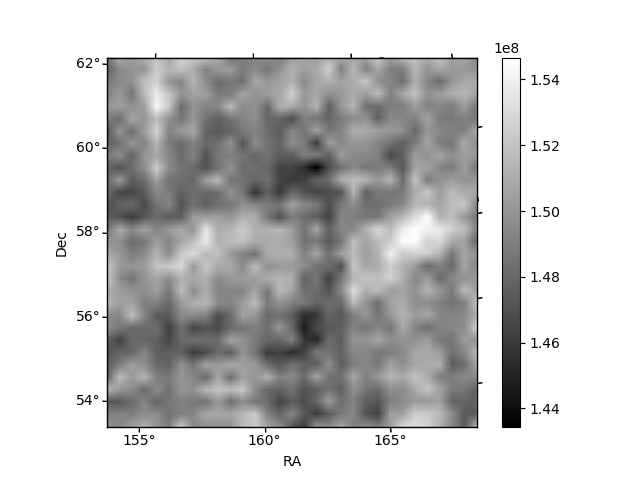
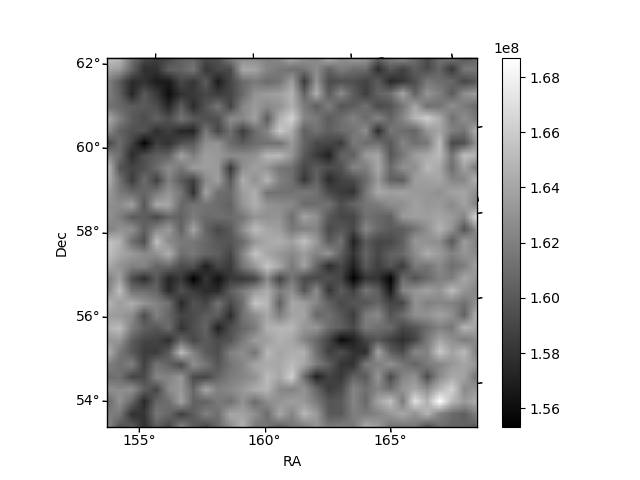
Histogram calculated using DETX and DETY for each event in the final _common_clean file
| Quadrant A | 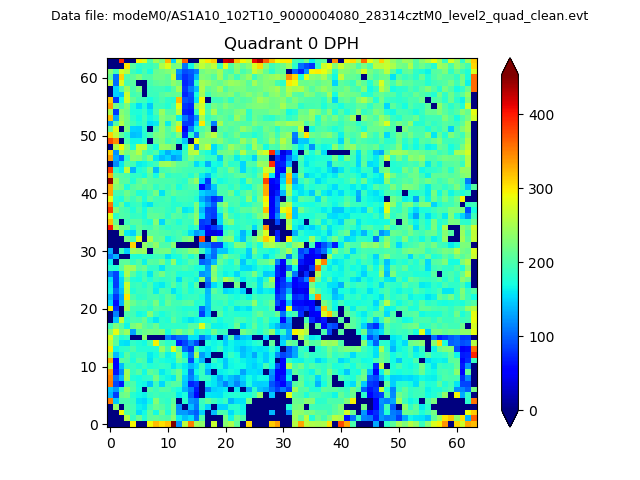 |
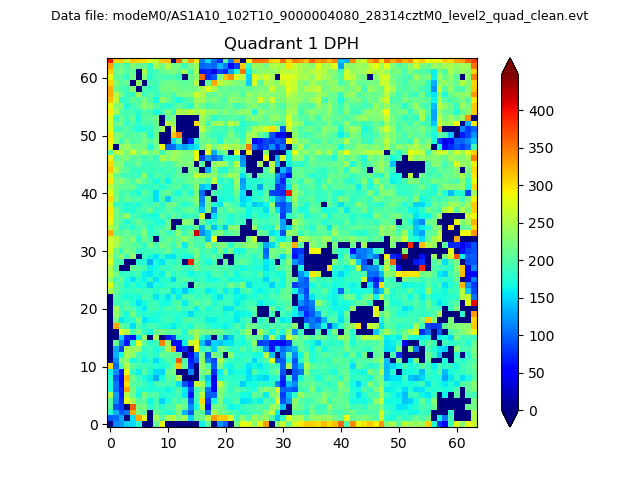 |
Quadrant B |
|---|---|---|---|
| Quadrant D | 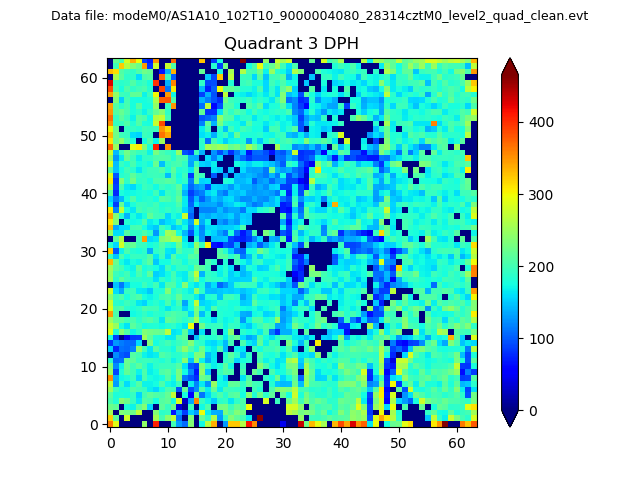 |
 |
Quadrant C |
| Plot type | Count rate plots | Images |
|---|---|---|
| Comparison with Poisson distribution Blue bars denote a histogram of data divided into 1 sec bins. Red curve is a Poisson curve with rate = median count rate of data. |
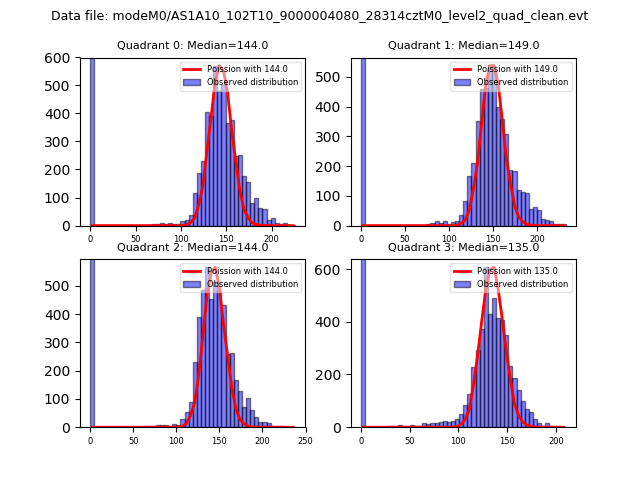 |
 |
| Quadrant-wise count rates Data is divided into 100 sec bins |
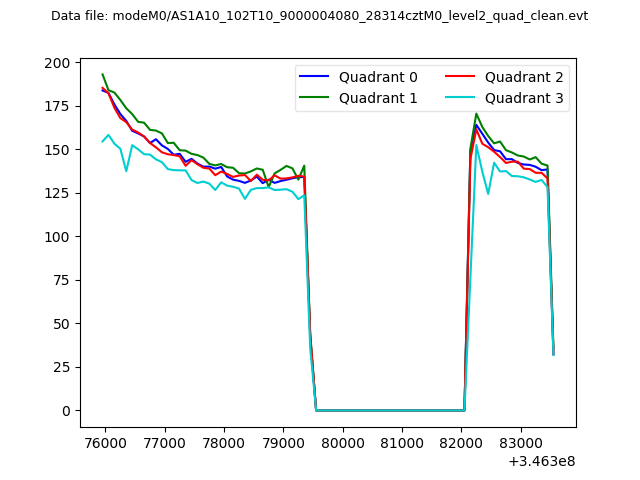 |
|
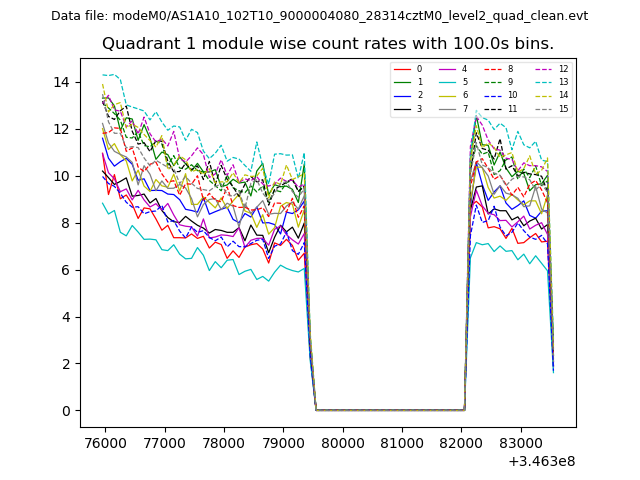
| Module-wise count rates for Quadrant A Data is divided into 100 sec bins |
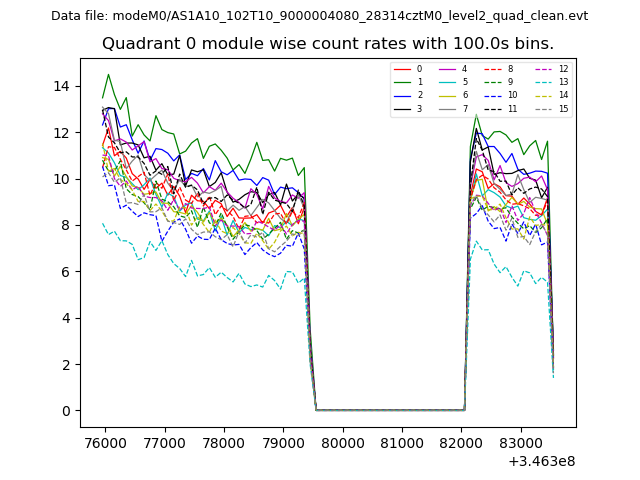 |
 |
| Module-wise count rates for Quadrant B Data is divided into 100 sec bins |
 |
 |
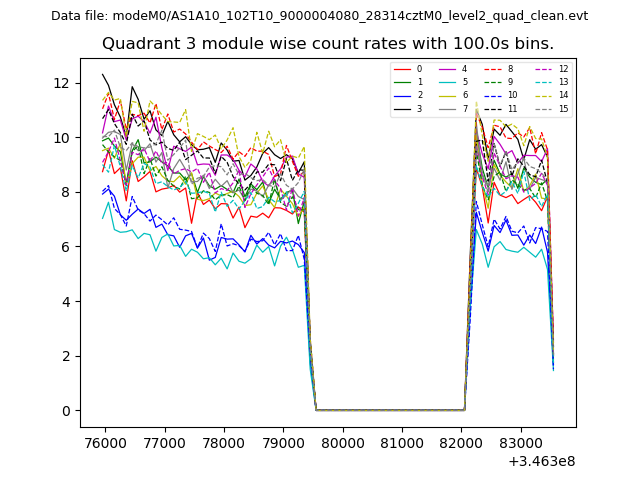
| Module-wise count rates for Quadrant C Data is divided into 100 sec bins |
 |
 |
| Module-wise count rates for Quadrant D Data is divided into 100 sec bins |
 |
 |
| Parameter | Plot |
|---|---|
| CZT HV Monitor | 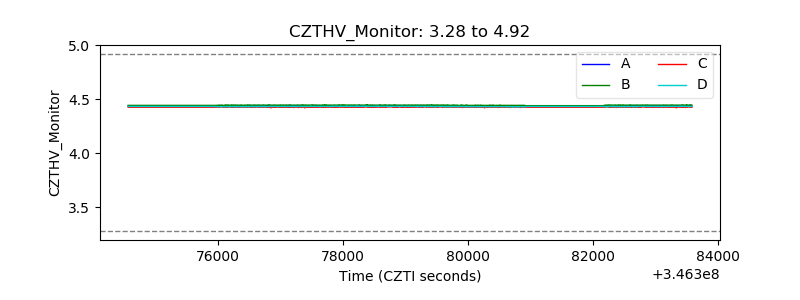 |
| D_VDD |  |
| Temperature 1 | 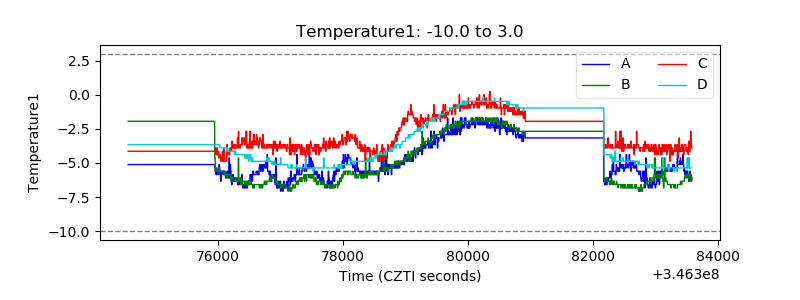 |
| Veto HV Monitor | 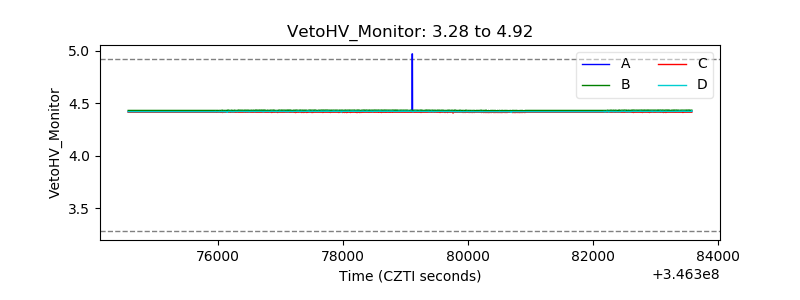 |
| Veto LLD | 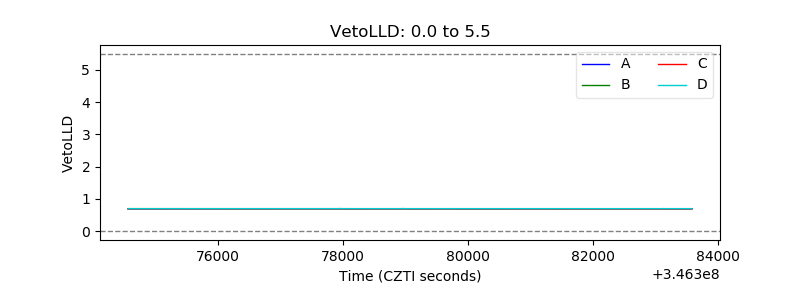 |
| Alpha Counter | 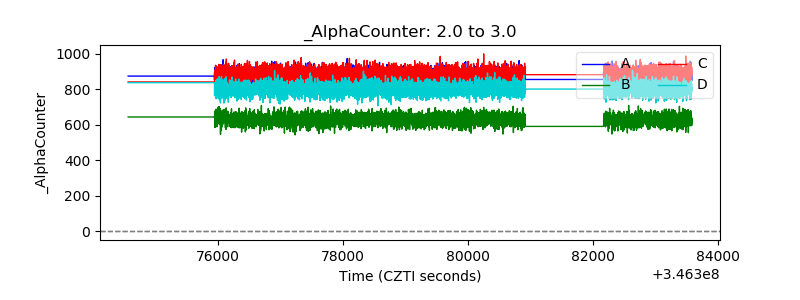 |
| _CPM_Rate | 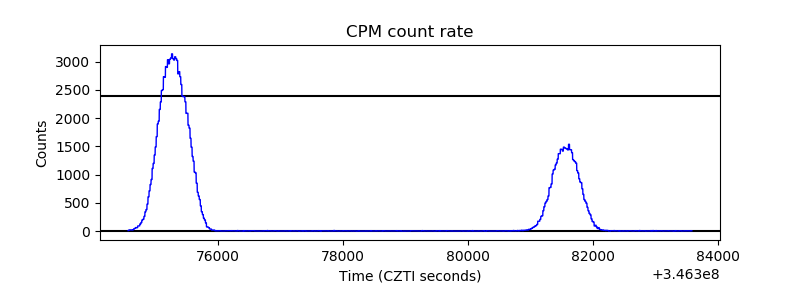 |
| CZT Counter | 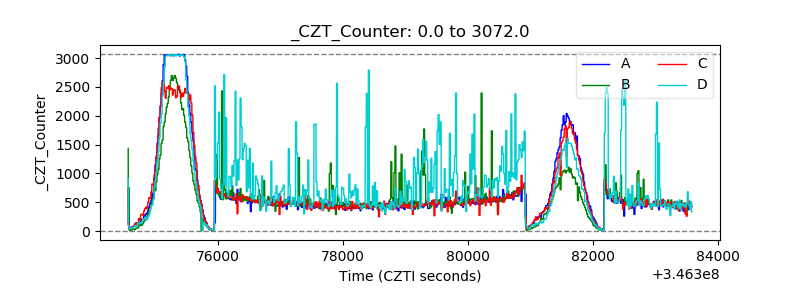 |
| +2.5 Volts monitor |  |
| +5 Volts monitor |  |
| _ROLL_ROT | 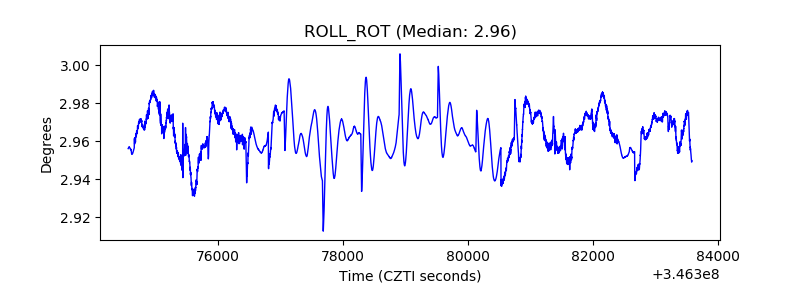 |
| _Roll_DEC | 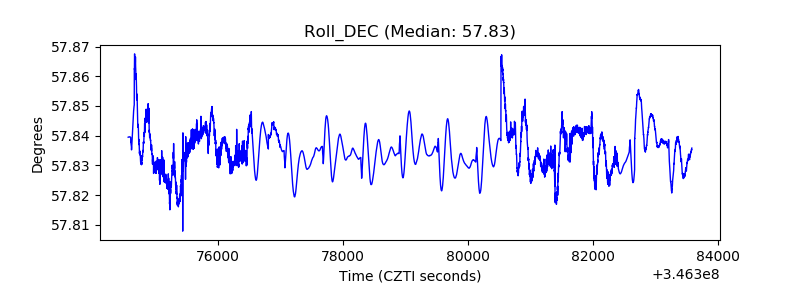 |
| _Roll_RA | 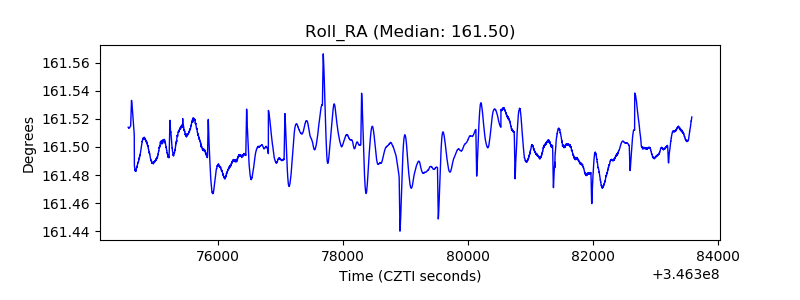 |
| Veto Counter | 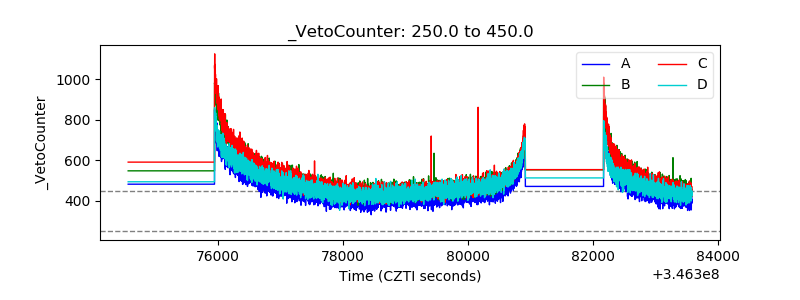 |