| Param | Original file | Final file |
|---|---|---|
| Filename | modeM0/AS1A10_102T10_9000004080_28316cztM0_level2.evt | modeM0/AS1A10_102T10_9000004080_28316cztM0_level2_quad_clean.evt |
| Size (bytes) | 395,415,360 | 82,356,480 |
| Size | 377.1 MB | 78.5 MB |
| Events in quadrant A | 2,691,923 | 522,001 |
| Events in quadrant B | 2,805,924 | 540,838 |
| Events in quadrant C | 2,729,260 | 519,924 |
| Events in quadrant D | 3,344,922 | 497,957 |
| Mode M0 | |||
|---|---|---|---|
| Quadrant | BADHDUFLAG | Total packets | Discarded packets |
| A | 0 | 11919 | 0 |
| B | 0 | 12134 | 0 |
| C | 0 | 11981 | 0 |
| D | 0 | 13959 | 0 |
| Mode M9 | |||
|---|---|---|---|
| Quadrant | BADHDUFLAG | Total packets | Discarded packets |
| A | 0 | 6 | 1 |
| B | 0 | 6 | 0 |
| C | 0 | 6 | 0 |
| D | 0 | 6 | 0 |
| Quadrant | Total seconds | Saturated seconds | Saturation percentage |
|---|---|---|---|
| A | 5831 | 47 | 0.806037% |
| B | 5826 | 79 | 1.355990% |
| C | 5838 | 76 | 1.301816% |
| D | 5795 | 74 | 1.276963% |
Noise dominated data is calculated using 1-second bins in cleaned event files. If a bin has >2000 counts, and if more than 50% of those come from <1% of pixels, then it is considered to be noise-dominated and hence unusable.
| Quadrant | # 1 sec bins | Bins with >0 counts | Bins with >2000 counts | High rate bins dominated by noise | Noise dominated (total time) | Noise dominated (detector-on time) | Marked lightcurve |
|---|---|---|---|---|---|---|---|
| A | 7564 | 6459 | 0 | 0 | 0.00% | 0.00% | 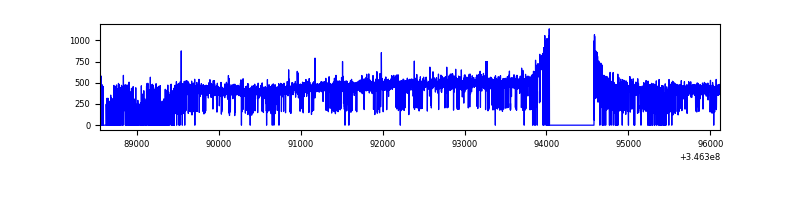 |
| B | 7566 | 6501 | 4 | 4 | 0.05% | 0.06% | 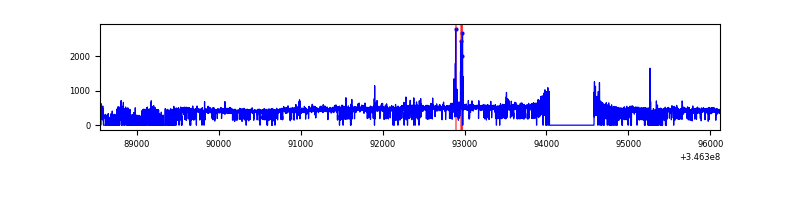 |
| C | 7566 | 6499 | 0 | 0 | 0.00% | 0.00% | 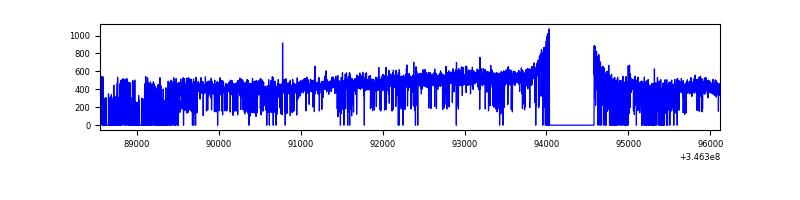 |
| D | 7567 | 6508 | 44 | 44 | 0.58% | 0.68% |  |
Top three noisy pixels from each quadrant. If the there are fewer than three noisy pixels in the level2.evt file, extra rows are filled as -1
| Pixel properties | Quadrant properties | ||||||
|---|---|---|---|---|---|---|---|
| Quadrant | DetID | PixID | Counts | Sigma | Mean | Median | Sigma |
| A | 13 | 254 | 9857 | 65.6 | 696 | 682 | 139.9 |
| A | 3 | 137 | 7051 | 45.54 | 696 | 682 | 139.9 |
| A | 0 | 226 | 5704 | 35.91 | 696 | 682 | 139.9 |
| B | 4 | 200 | 40924 | 302.2 | 693 | 674 | 133.2 |
| B | 10 | 246 | 20302 | 147.37 | 693 | 674 | 133.2 |
| B | 0 | 230 | 19891 | 144.28 | 693 | 674 | 133.2 |
| C | 14 | 238 | 109695 | 694.24 | 670 | 672 | 157.0 |
| C | 3 | 233 | 9398 | 55.57 | 670 | 672 | 157.0 |
| C | 13 | 61 | 4749 | 25.96 | 670 | 672 | 157.0 |
| D | 1 | 52 | 520210 | 3292.04 | 665 | 645 | 157.8 |
| D | 13 | 104 | 85315 | 536.48 | 665 | 645 | 157.8 |
| D | 8 | 195 | 81368 | 511.47 | 665 | 645 | 157.8 |
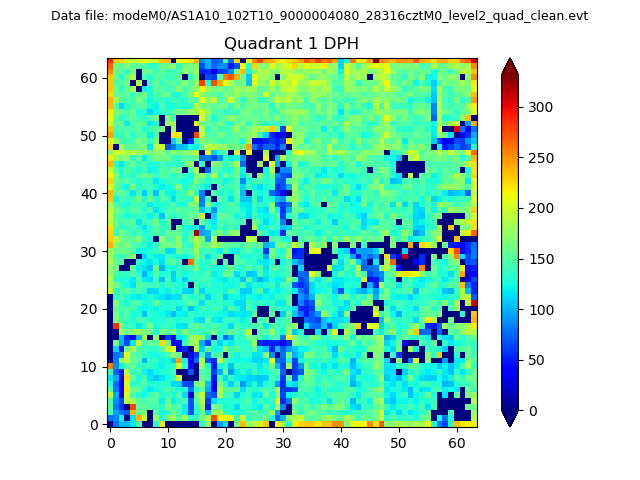
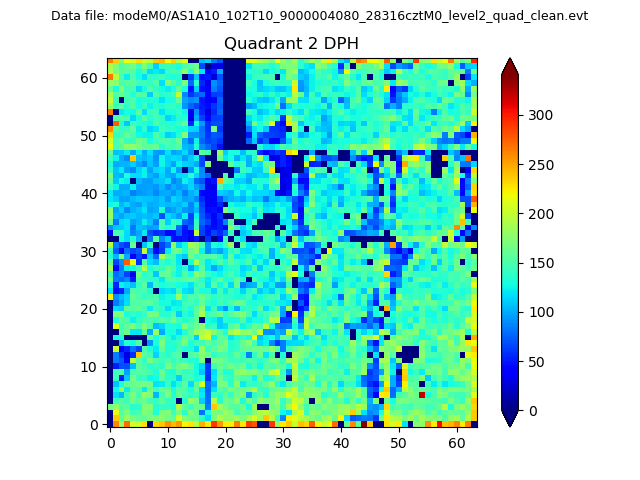
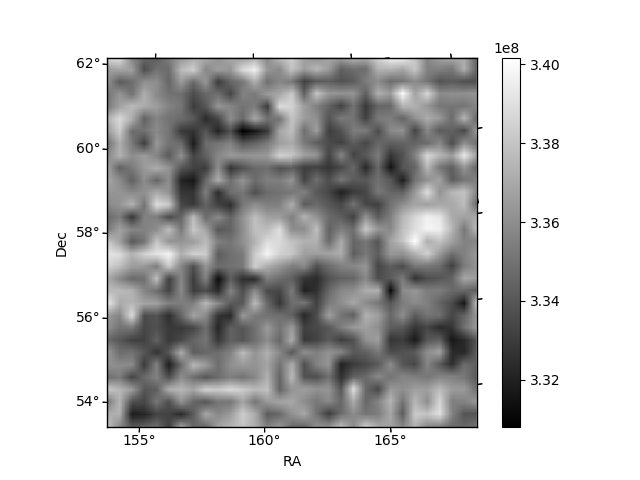
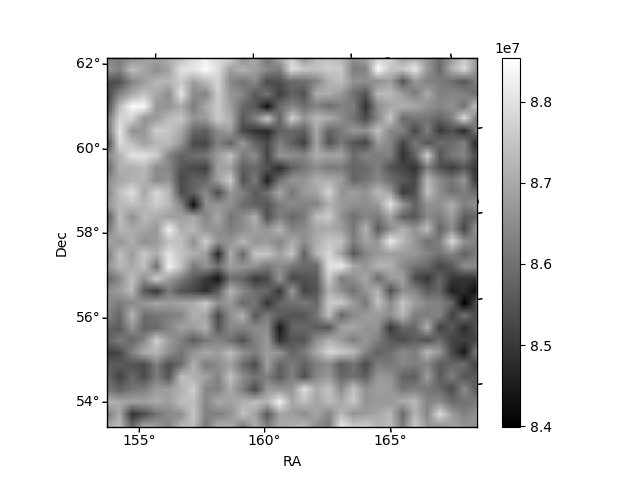
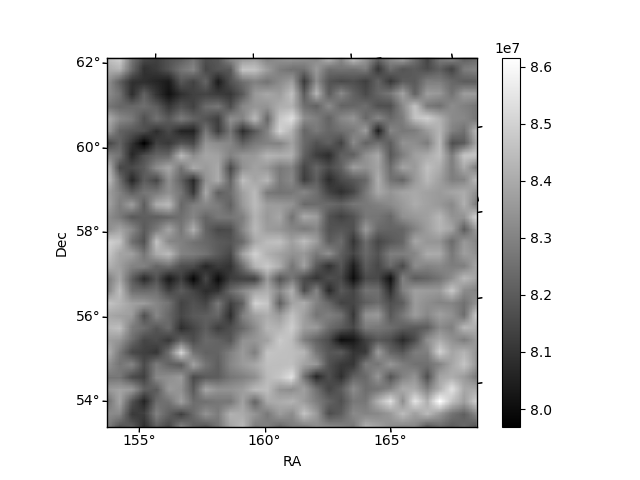
Histogram calculated using DETX and DETY for each event in the final _common_clean file
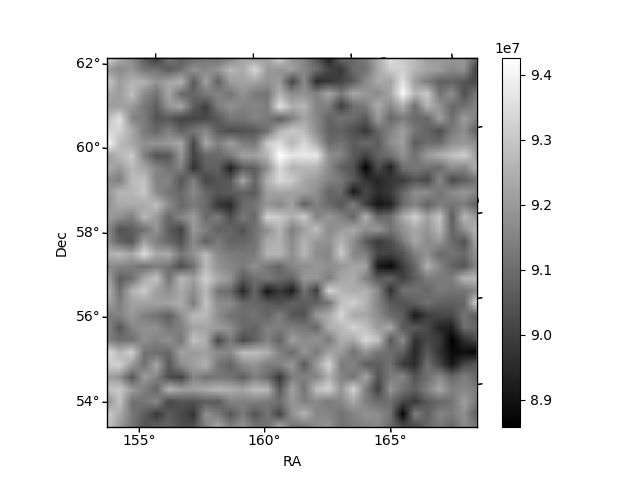
| Quadrant A | 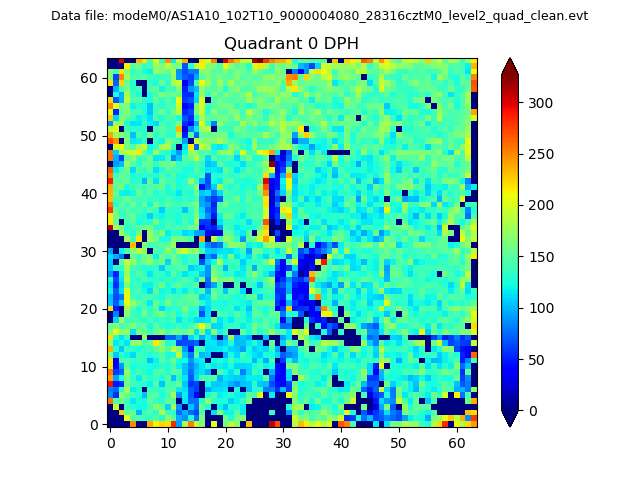 |
 |
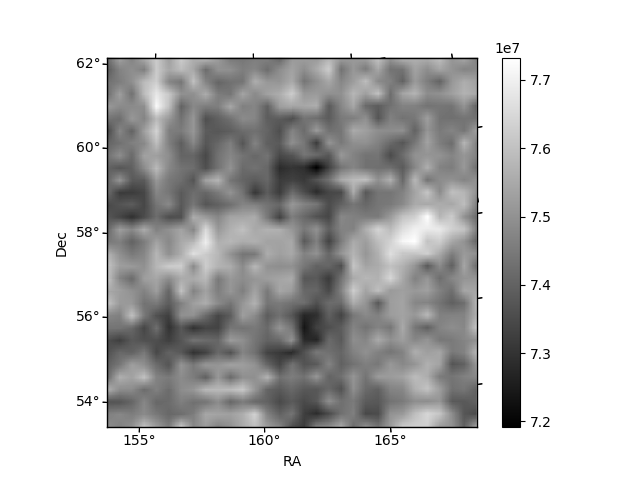
Quadrant B |
|---|---|---|---|
| Quadrant D | 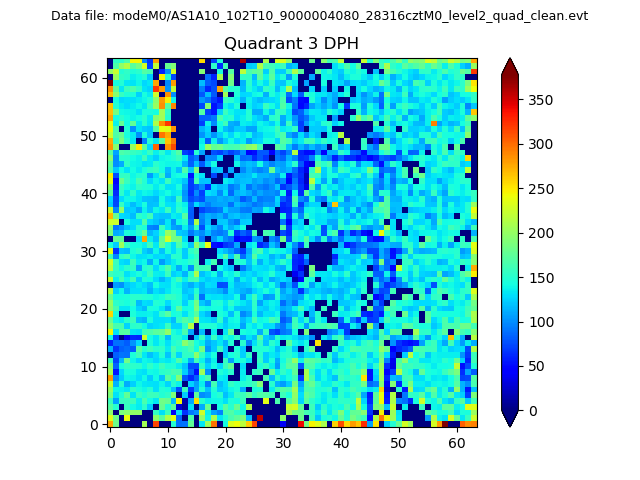 |
 |
Quadrant C |
| Plot type | Count rate plots | Images |
|---|---|---|
| Comparison with Poisson distribution Blue bars denote a histogram of data divided into 1 sec bins. Red curve is a Poisson curve with rate = median count rate of data. |
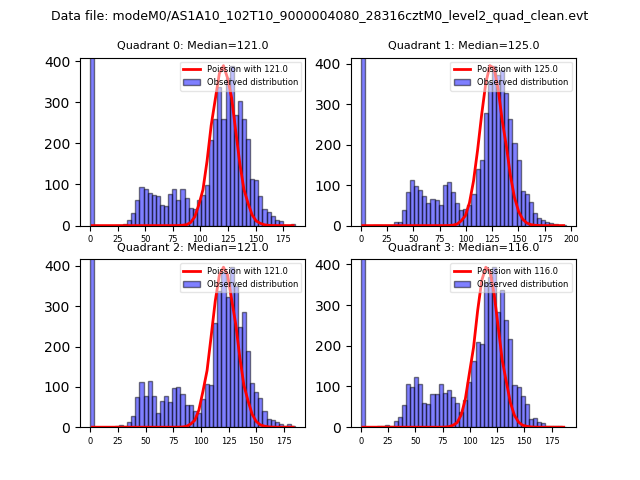 |
 |
| Quadrant-wise count rates Data is divided into 100 sec bins |
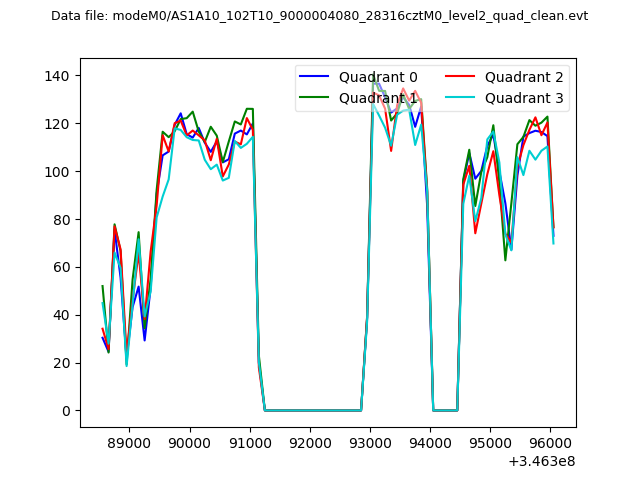 |
|
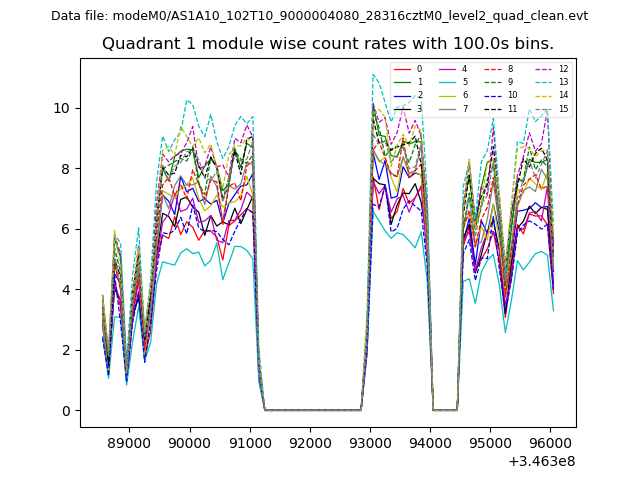
| Module-wise count rates for Quadrant A Data is divided into 100 sec bins |
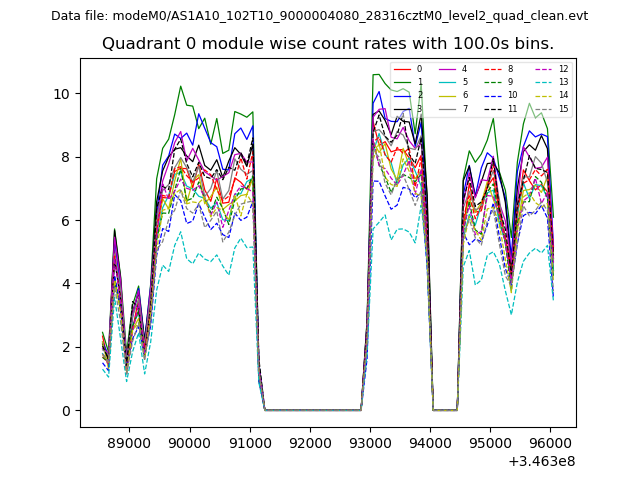 |
 |
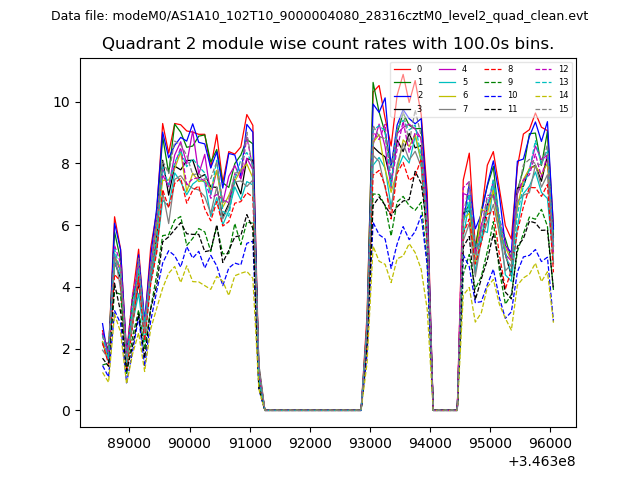
| Module-wise count rates for Quadrant B Data is divided into 100 sec bins |
 |
 |
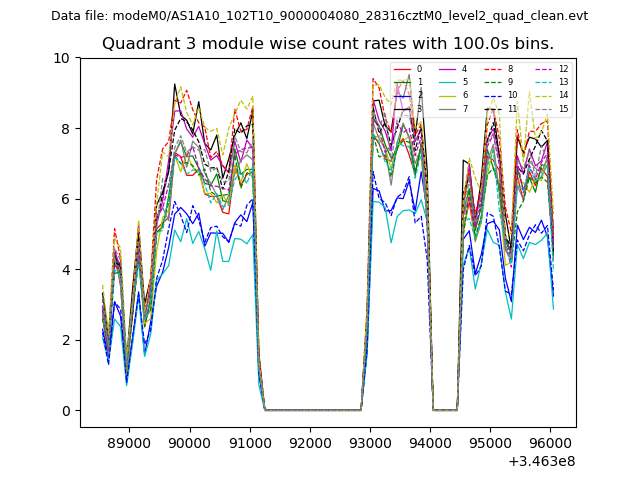
| Module-wise count rates for Quadrant C Data is divided into 100 sec bins |
 |
 |
| Module-wise count rates for Quadrant D Data is divided into 100 sec bins |
 |
 |
| Parameter | Plot |
|---|---|
| CZT HV Monitor | 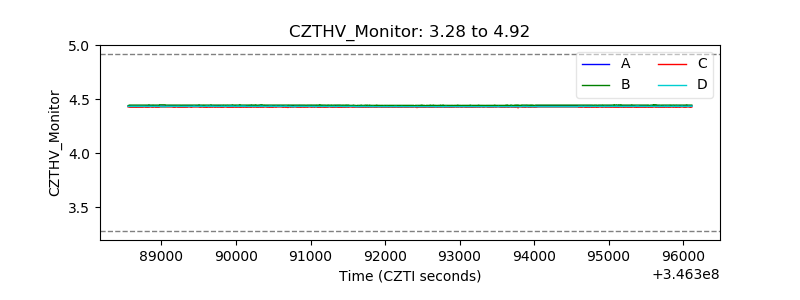 |
| D_VDD | 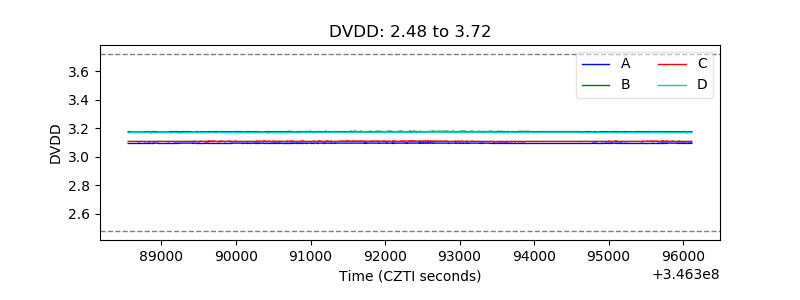 |
| Temperature 1 | 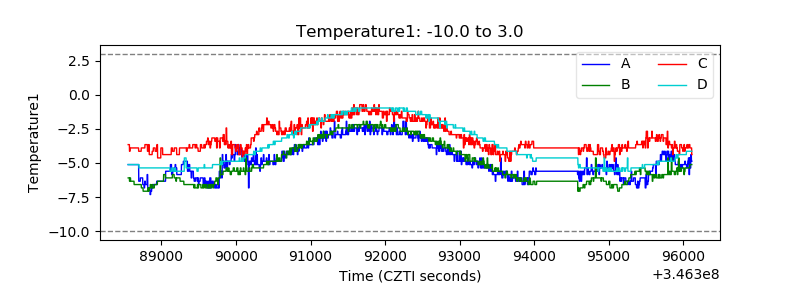 |
| Veto HV Monitor | 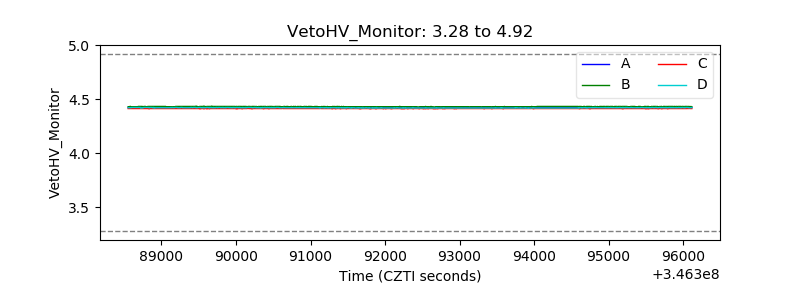 |
| Veto LLD | 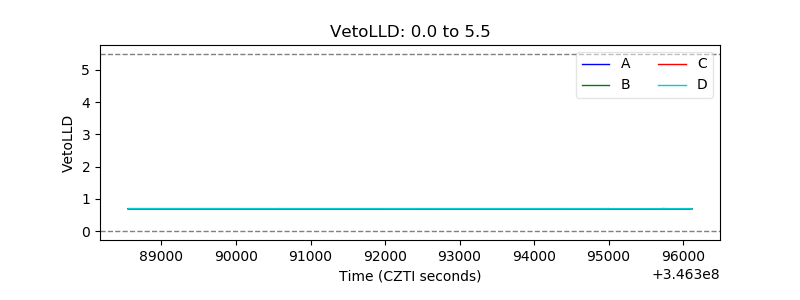 |
| Alpha Counter | 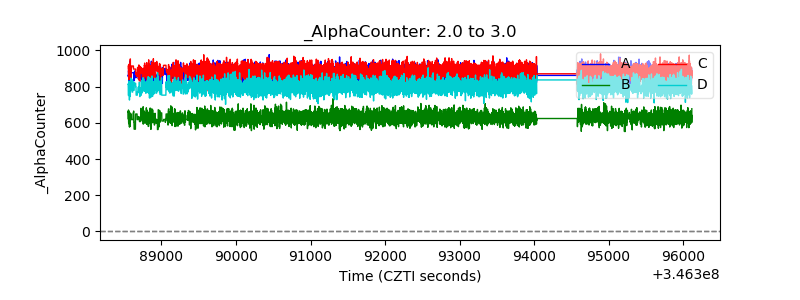 |
| _CPM_Rate | 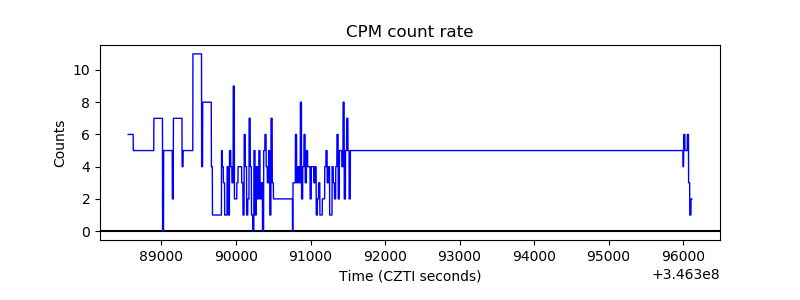 |
| CZT Counter | 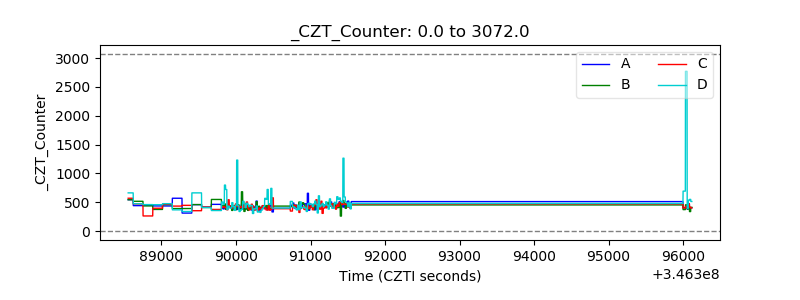 |
| +2.5 Volts monitor |  |
| +5 Volts monitor |  |
| _ROLL_ROT | 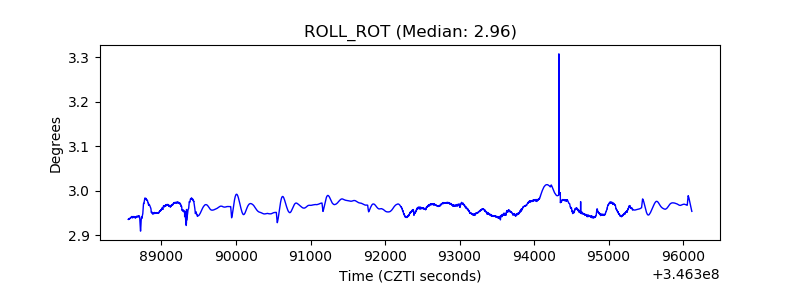 |
| _Roll_DEC | 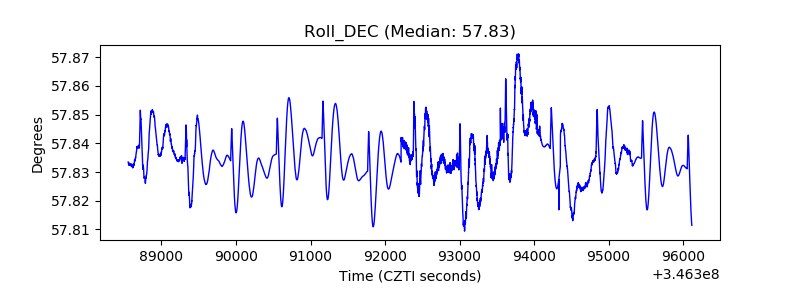 |
| _Roll_RA | 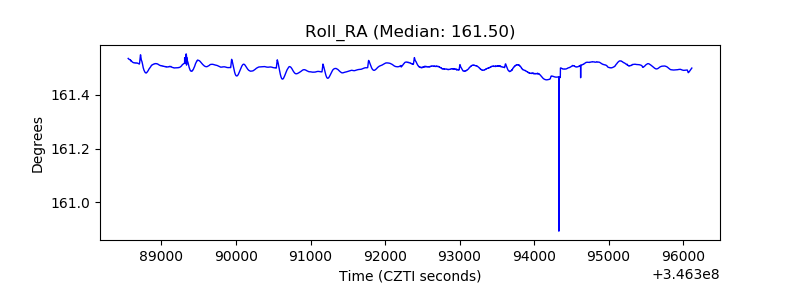 |
| Veto Counter | 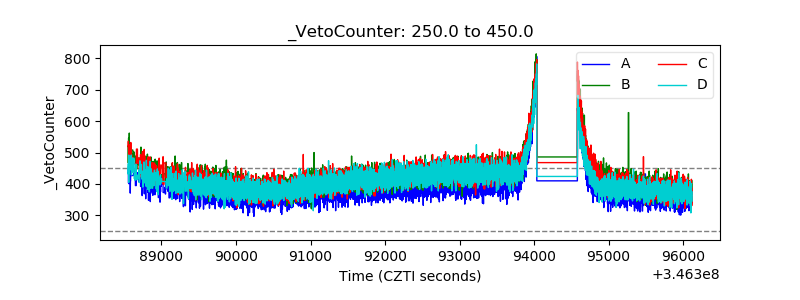 |