| Param | Original file | Final file |
|---|---|---|
| Filename | modeM0/AS1A10_102T10_9000004080_28318cztM0_level2.evt | modeM0/AS1A10_102T10_9000004080_28318cztM0_level2_quad_clean.evt |
| Size (bytes) | 1,793,453,760 | 325,589,760 |
| Size | 1.7 GB | 310.5 MB |
| Events in quadrant A | 11,089,970 | 2,090,818 |
| Events in quadrant B | 12,499,650 | 2,133,707 |
| Events in quadrant C | 11,199,662 | 2,059,405 |
| Events in quadrant D | 17,923,931 | 1,944,648 |
| Mode M0 | |||
|---|---|---|---|
| Quadrant | BADHDUFLAG | Total packets | Discarded packets |
| A | 0 | 48906 | 0 |
| B | 0 | 52632 | 0 |
| C | 0 | 48976 | 0 |
| D | 0 | 69780 | 0 |
| Mode M9 | |||
|---|---|---|---|
| Quadrant | BADHDUFLAG | Total packets | Discarded packets |
| A | 0 | 19 | 0 |
| B | 0 | 19 | 0 |
| C | 0 | 19 | 0 |
| D | 0 | 19 | 0 |
| Quadrant | Total seconds | Saturated seconds | Saturation percentage |
|---|---|---|---|
| A | 23738 | 435 | 1.832505% |
| B | 23738 | 666 | 2.805628% |
| C | 23738 | 484 | 2.038925% |
| D | 23739 | 1590 | 6.697839% |
Noise dominated data is calculated using 1-second bins in cleaned event files. If a bin has >2000 counts, and if more than 50% of those come from <1% of pixels, then it is considered to be noise-dominated and hence unusable.
| Quadrant | # 1 sec bins | Bins with >0 counts | Bins with >2000 counts | High rate bins dominated by noise | Noise dominated (total time) | Noise dominated (detector-on time) | Marked lightcurve |
|---|---|---|---|---|---|---|---|
| A | 25398 | 23742 | 0 | 0 | 0.00% | 0.00% |  |
| B | 25398 | 23742 | 123 | 123 | 0.48% | 0.52% | 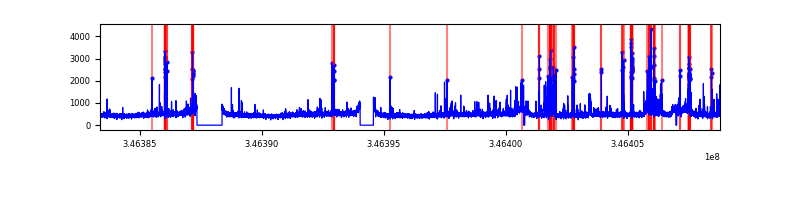 |
| C | 25398 | 23742 | 0 | 0 | 0.00% | 0.00% | 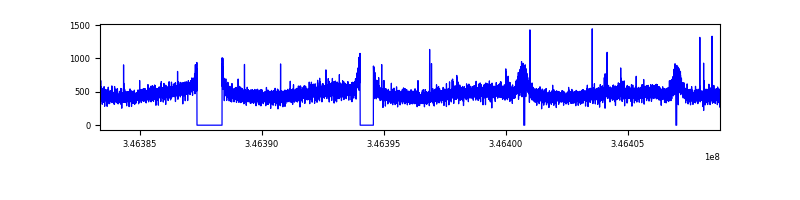 |
| D | 25399 | 23742 | 1126 | 1126 | 4.43% | 4.74% |  |
Top three noisy pixels from each quadrant. If the there are fewer than three noisy pixels in the level2.evt file, extra rows are filled as -1
| Pixel properties | Quadrant properties | ||||||
|---|---|---|---|---|---|---|---|
| Quadrant | DetID | PixID | Counts | Sigma | Mean | Median | Sigma |
| A | 13 | 254 | 39959 | 64.96 | 2869 | 2807 | 571.9 |
| A | 3 | 137 | 28369 | 44.69 | 2869 | 2807 | 571.9 |
| A | 0 | 226 | 24343 | 37.66 | 2869 | 2807 | 571.9 |
| B | 10 | 245 | 731933 | 1348.94 | 2842 | 2766 | 540.5 |
| B | 10 | 246 | 218680 | 399.43 | 2842 | 2766 | 540.5 |
| B | 15 | 222 | 144572 | 262.34 | 2842 | 2766 | 540.5 |
| C | 14 | 238 | 447488 | 698.15 | 2743 | 2756 | 637.0 |
| C | 3 | 233 | 60957 | 91.36 | 2743 | 2756 | 637.0 |
| C | 13 | 61 | 18957 | 25.43 | 2743 | 2756 | 637.0 |
| D | 1 | 52 | 6022048 | 9470.46 | 2700 | 2627 | 635.6 |
| D | 8 | 195 | 638901 | 1001.06 | 2700 | 2627 | 635.6 |
| D | 2 | 250 | 537808 | 842.01 | 2700 | 2627 | 635.6 |
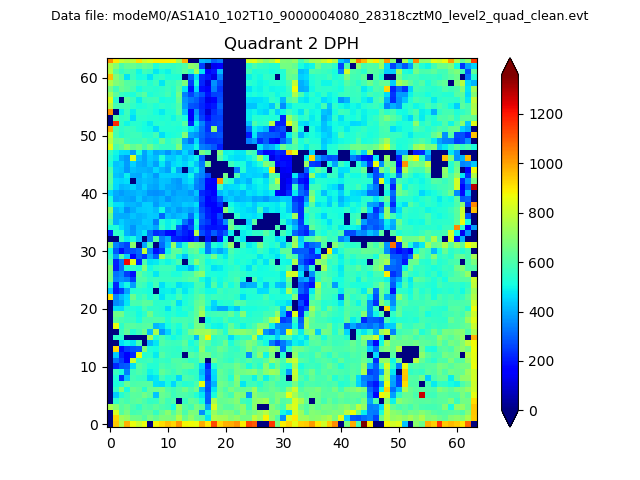
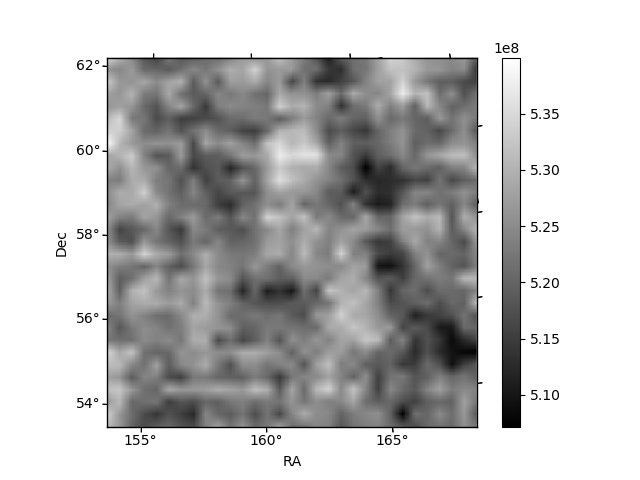
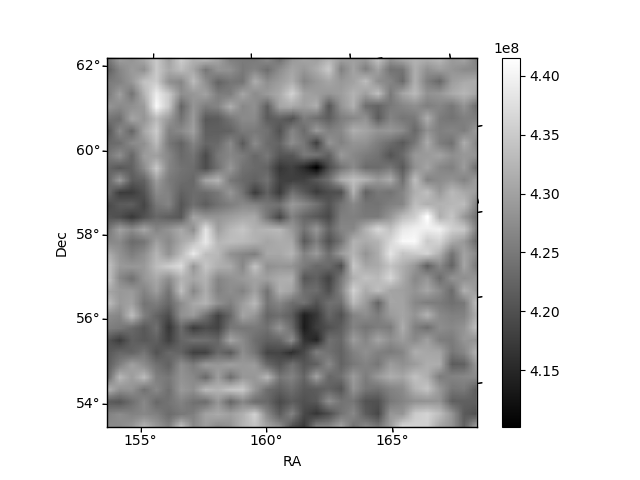
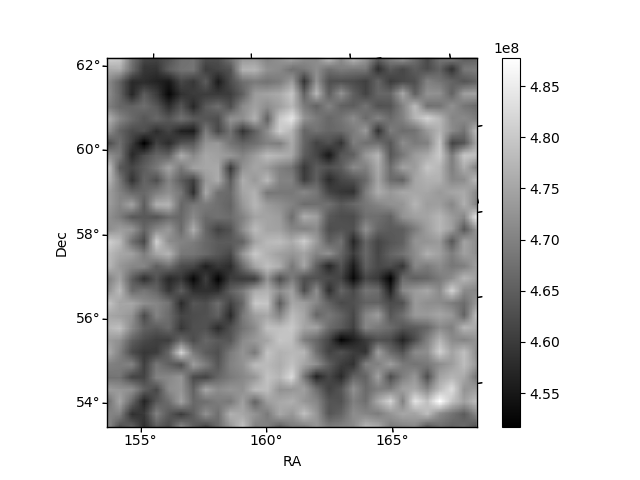
Histogram calculated using DETX and DETY for each event in the final _common_clean file
| Quadrant A | 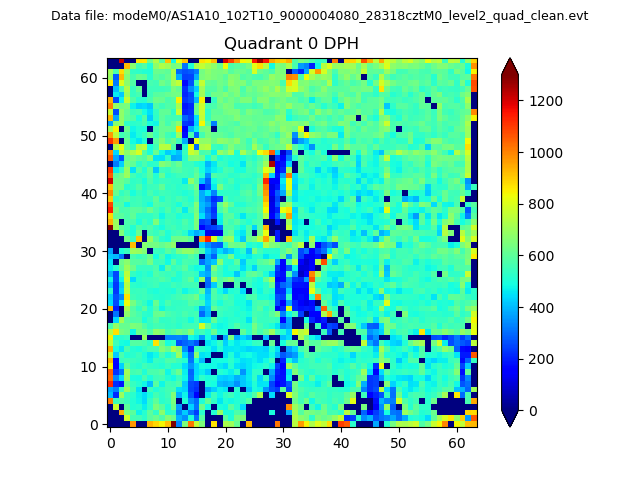 |
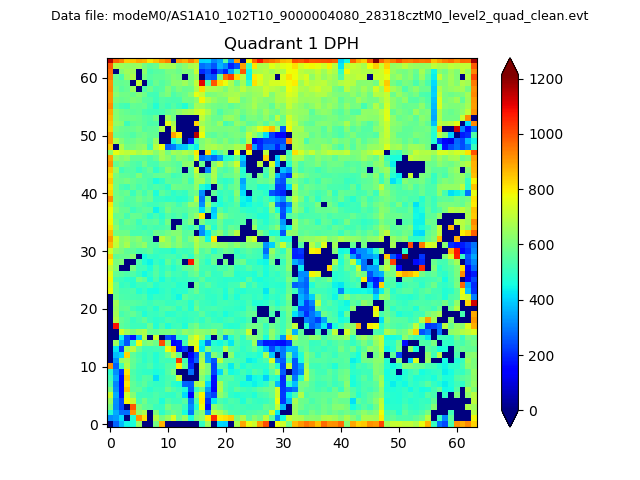 |
Quadrant B |
|---|---|---|---|
| Quadrant D | 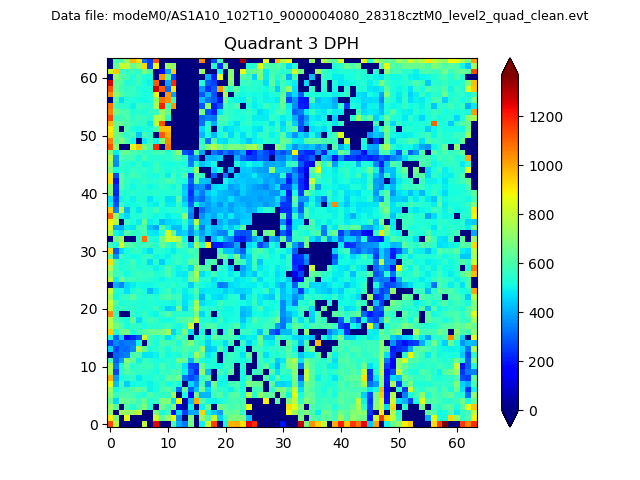 |
 |
Quadrant C |
| Plot type | Count rate plots | Images |
|---|---|---|
| Comparison with Poisson distribution Blue bars denote a histogram of data divided into 1 sec bins. Red curve is a Poisson curve with rate = median count rate of data. |
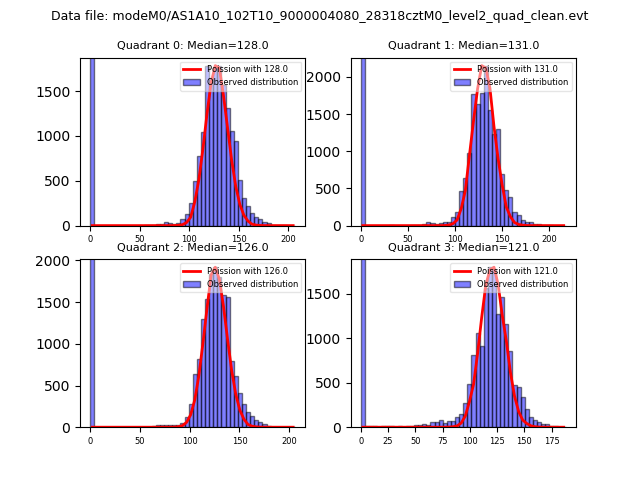 |
 |
| Quadrant-wise count rates Data is divided into 100 sec bins |
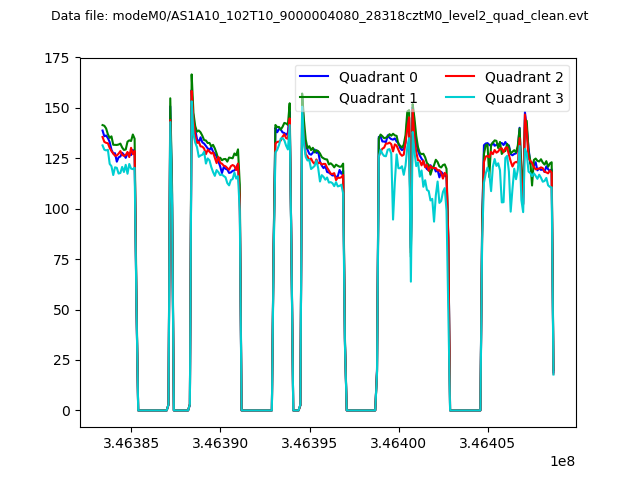 |
|
| Module-wise count rates for Quadrant A Data is divided into 100 sec bins |
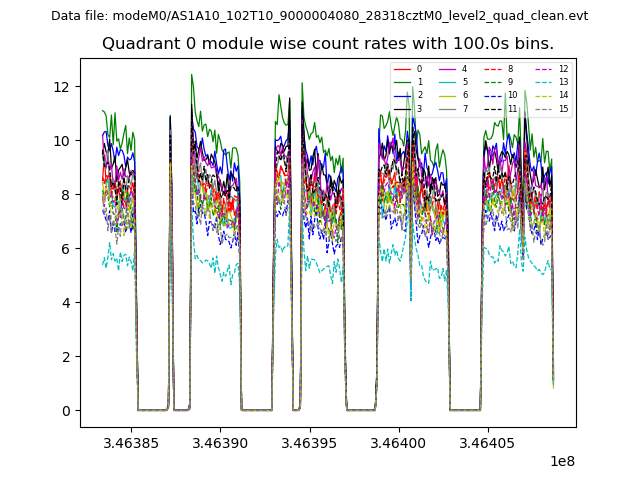 |
 |
| Module-wise count rates for Quadrant B Data is divided into 100 sec bins |
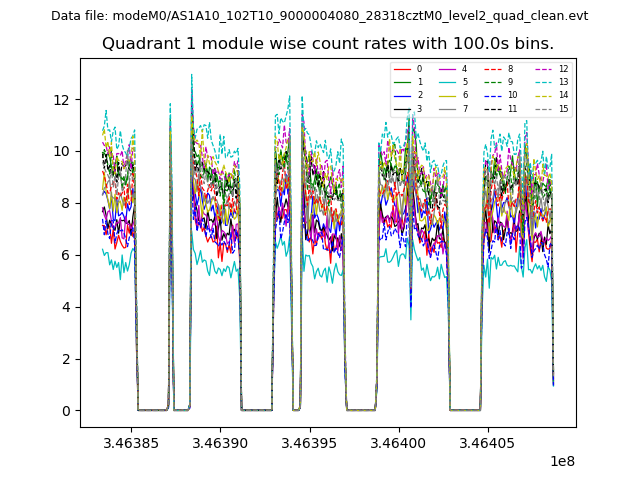 |
 |
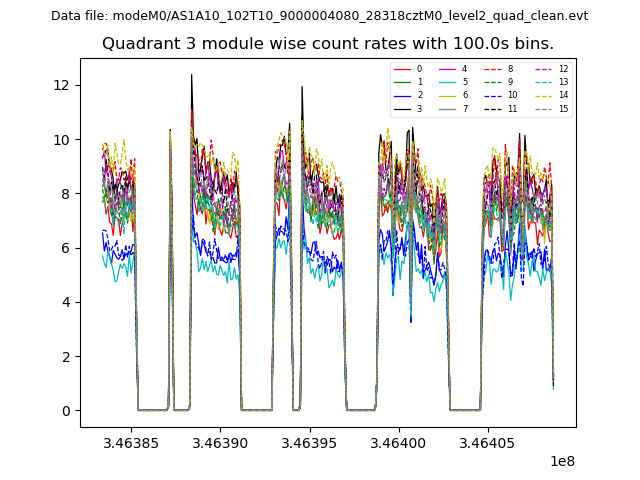
| Module-wise count rates for Quadrant C Data is divided into 100 sec bins |
 |
 |
| Module-wise count rates for Quadrant D Data is divided into 100 sec bins |
 |
 |
| Parameter | Plot |
|---|---|
| CZT HV Monitor | 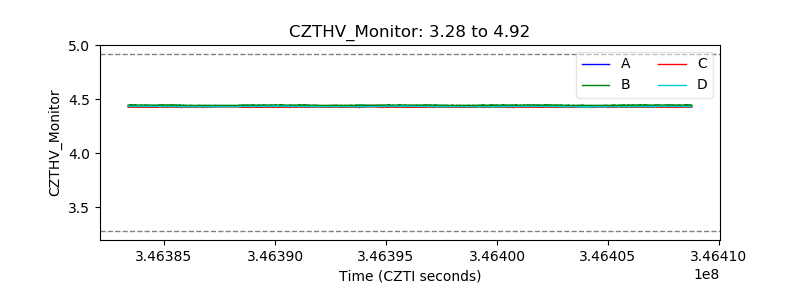 |
| D_VDD |  |
| Temperature 1 | 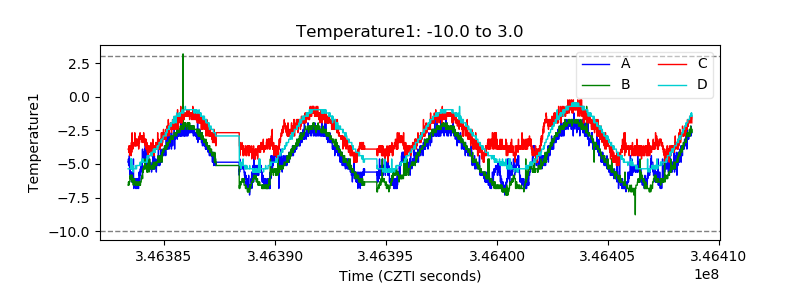 |
| Veto HV Monitor | 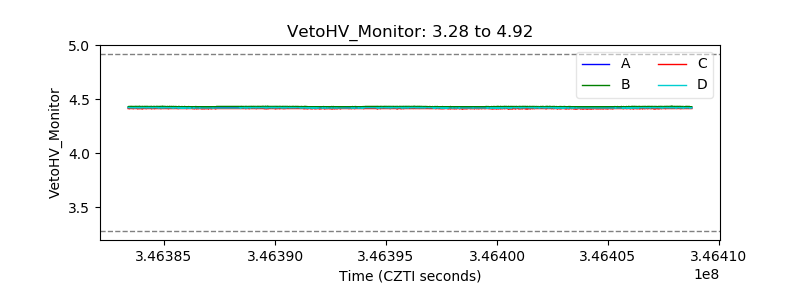 |
| Veto LLD | 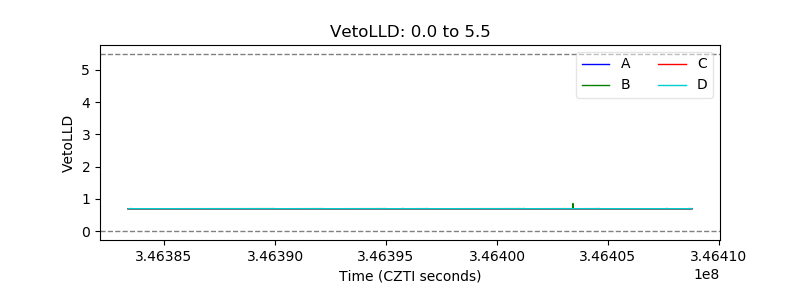 |
| Alpha Counter | 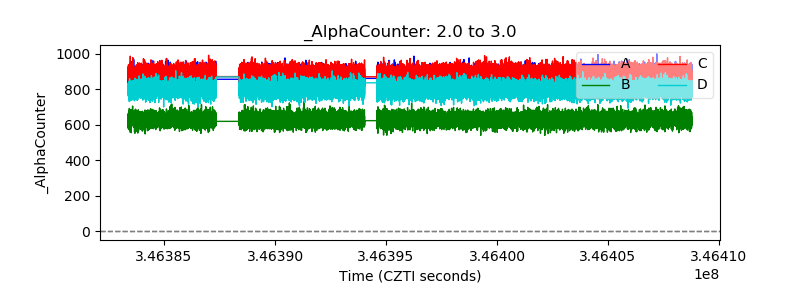 |
| _CPM_Rate | 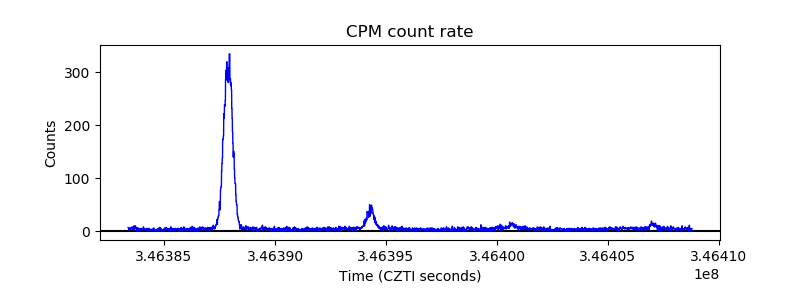 |
| CZT Counter | 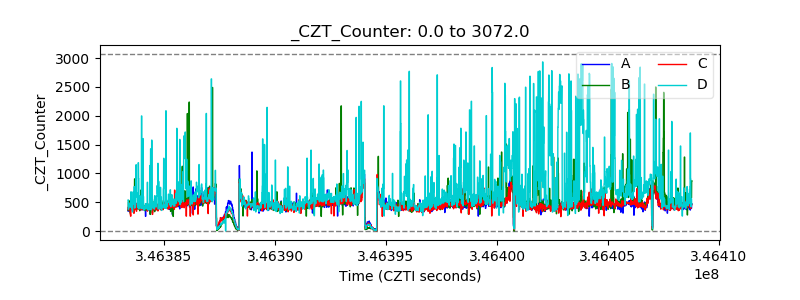 |
| +2.5 Volts monitor |  |
| +5 Volts monitor |  |
| _ROLL_ROT | 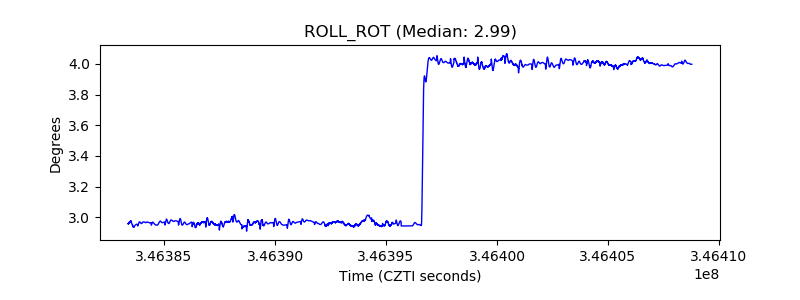 |
| _Roll_DEC | 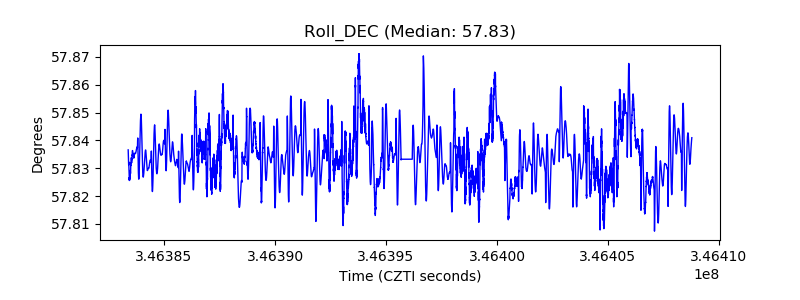 |
| _Roll_RA | 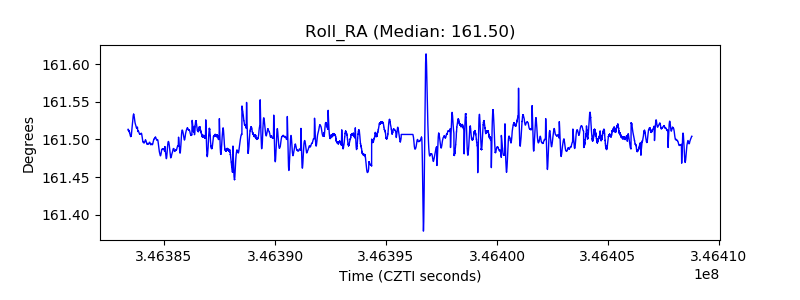 |
| Veto Counter | 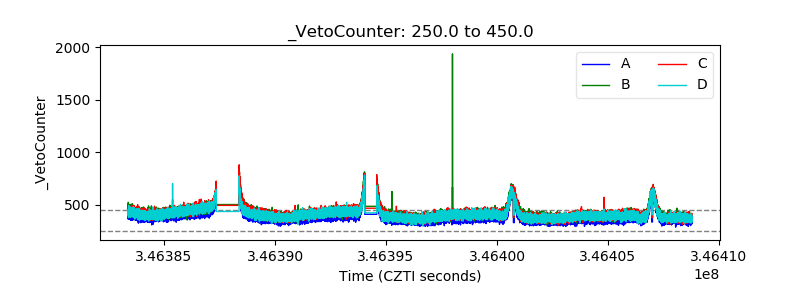 |