| Param | Original file | Final file |
|---|---|---|
| Filename | modeM0/AS1A10_102T10_9000004080_28319cztM0_level2.evt | modeM0/AS1A10_102T10_9000004080_28319cztM0_level2_quad_clean.evt |
| Size (bytes) | 549,072,000 | 88,899,840 |
| Size | 523.6 MB | 84.8 MB |
| Events in quadrant A | 3,137,197 | 564,226 |
| Events in quadrant B | 3,721,225 | 573,472 |
| Events in quadrant C | 3,148,326 | 552,113 |
| Events in quadrant D | 6,155,150 | 522,432 |
| Mode M0 | |||
|---|---|---|---|
| Quadrant | BADHDUFLAG | Total packets | Discarded packets |
| A | 0 | 13929 | 0 |
| B | 0 | 15438 | 0 |
| C | 0 | 13926 | 0 |
| D | 0 | 23019 | 0 |
| Mode M9 | |||
|---|---|---|---|
| Quadrant | BADHDUFLAG | Total packets | Discarded packets |
| A | 0 | 3 | 0 |
| B | 0 | 3 | 0 |
| C | 0 | 3 | 0 |
| D | 0 | 3 | 0 |
| Quadrant | Total seconds | Saturated seconds | Saturation percentage |
|---|---|---|---|
| A | 6877 | 67 | 0.974262% |
| B | 6877 | 157 | 2.282972% |
| C | 6877 | 79 | 1.148757% |
| D | 6877 | 446 | 6.485386% |
Noise dominated data is calculated using 1-second bins in cleaned event files. If a bin has >2000 counts, and if more than 50% of those come from <1% of pixels, then it is considered to be noise-dominated and hence unusable.
| Quadrant | # 1 sec bins | Bins with >0 counts | Bins with >2000 counts | High rate bins dominated by noise | Noise dominated (total time) | Noise dominated (detector-on time) | Marked lightcurve |
|---|---|---|---|---|---|---|---|
| A | 7257 | 6878 | 0 | 0 | 0.00% | 0.00% | 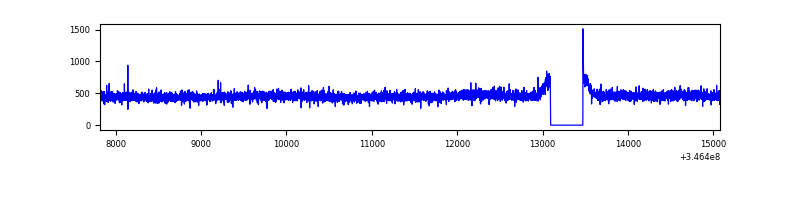 |
| B | 7257 | 6878 | 57 | 57 | 0.79% | 0.83% | 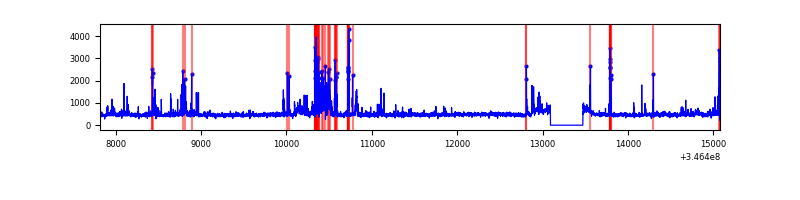 |
| C | 7257 | 6878 | 0 | 0 | 0.00% | 0.00% | 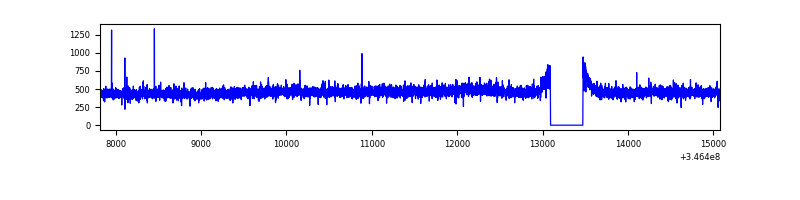 |
| D | 7257 | 6877 | 382 | 382 | 5.26% | 5.55% | 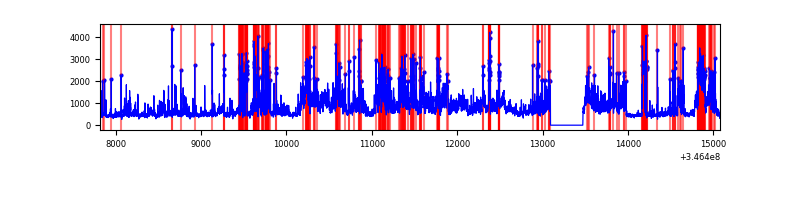 |
Top three noisy pixels from each quadrant. If the there are fewer than three noisy pixels in the level2.evt file, extra rows are filled as -1
| Pixel properties | Quadrant properties | ||||||
|---|---|---|---|---|---|---|---|
| Quadrant | DetID | PixID | Counts | Sigma | Mean | Median | Sigma |
| A | 13 | 254 | 12068 | 69.07 | 811 | 794 | 163.2 |
| A | 3 | 137 | 8131 | 44.95 | 811 | 794 | 163.2 |
| A | 0 | 226 | 7000 | 38.02 | 811 | 794 | 163.2 |
| B | 10 | 245 | 424182 | 2718.59 | 802 | 780 | 155.7 |
| B | 4 | 200 | 43551 | 274.63 | 802 | 780 | 155.7 |
| B | 10 | 246 | 43395 | 273.62 | 802 | 780 | 155.7 |
| C | 14 | 238 | 124112 | 678.31 | 774 | 778 | 181.8 |
| C | 13 | 61 | 5276 | 24.74 | 774 | 778 | 181.8 |
| C | 3 | 233 | 4122 | 18.39 | 774 | 778 | 181.8 |
| D | 1 | 52 | 2414424 | 13207.83 | 763 | 740 | 182.7 |
| D | 8 | 195 | 335177 | 1830.06 | 763 | 740 | 182.7 |
| D | 2 | 250 | 232527 | 1268.35 | 763 | 740 | 182.7 |
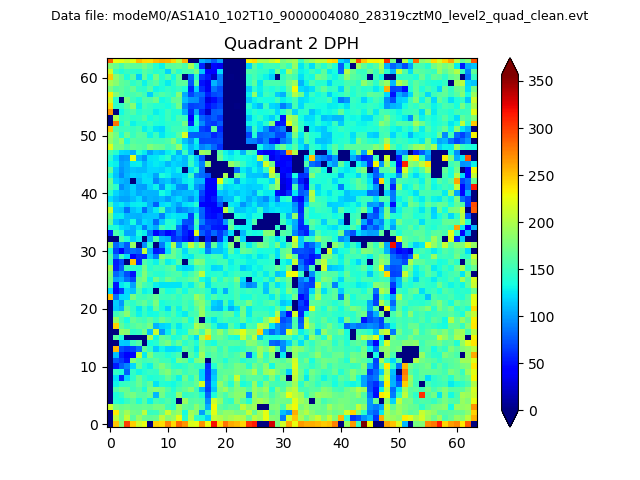
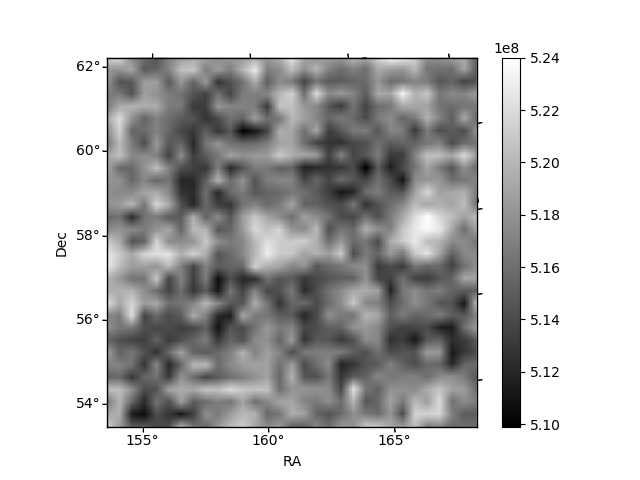
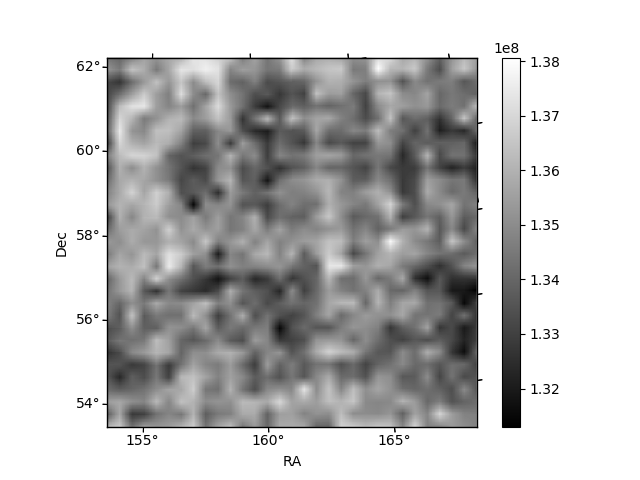
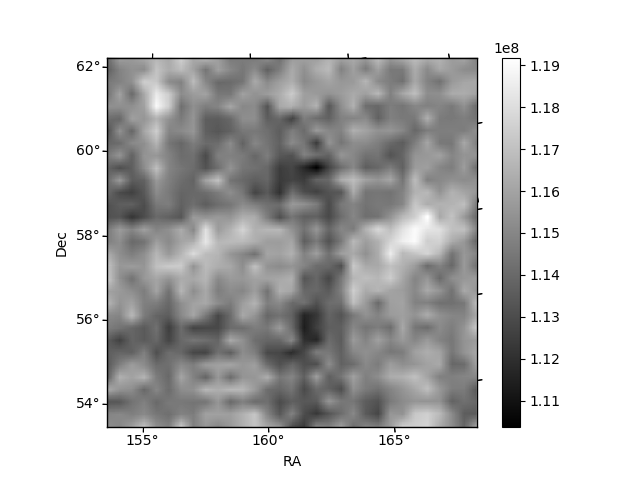
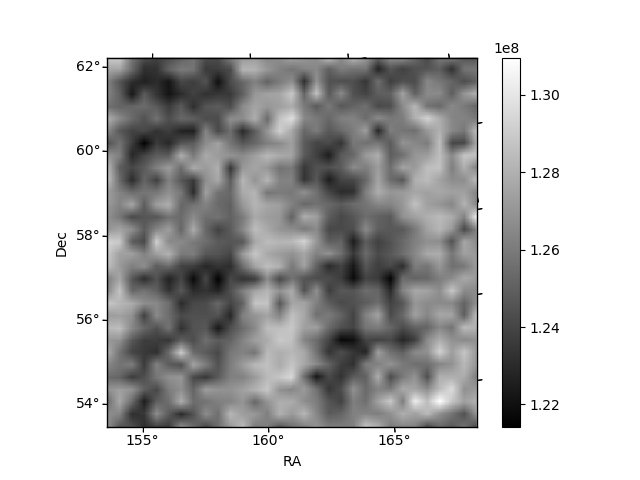
Histogram calculated using DETX and DETY for each event in the final _common_clean file
| Quadrant A | 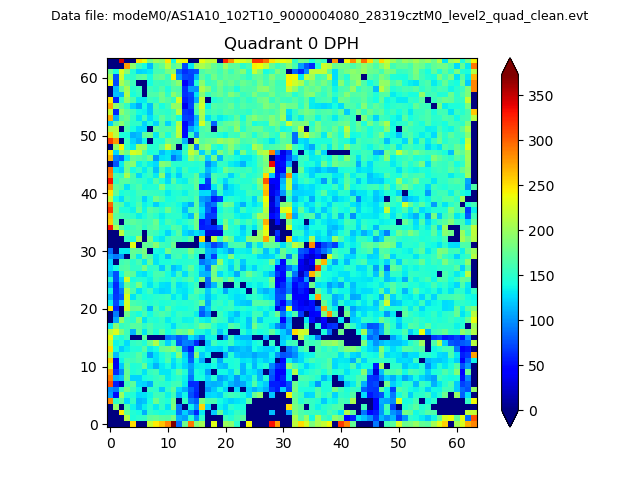 |
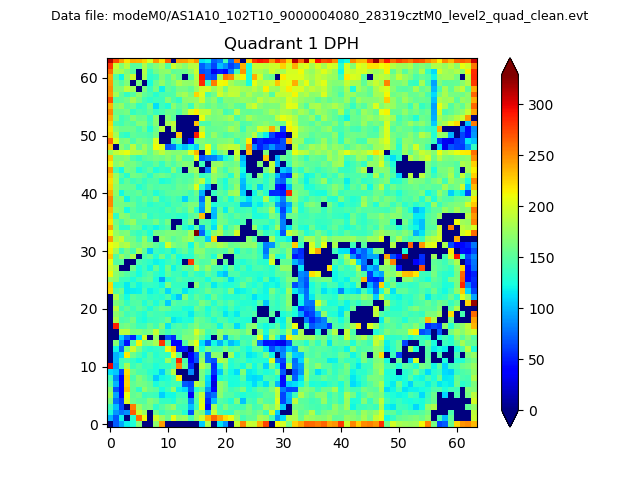 |
Quadrant B |
|---|---|---|---|
| Quadrant D | 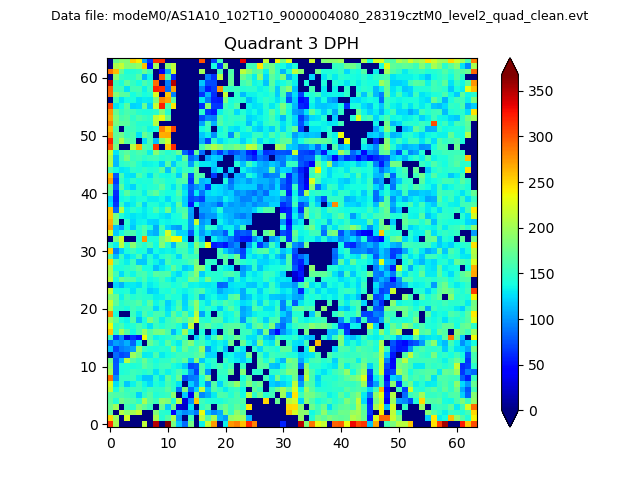 |
 |
Quadrant C |
| Plot type | Count rate plots | Images |
|---|---|---|
| Comparison with Poisson distribution Blue bars denote a histogram of data divided into 1 sec bins. Red curve is a Poisson curve with rate = median count rate of data. |
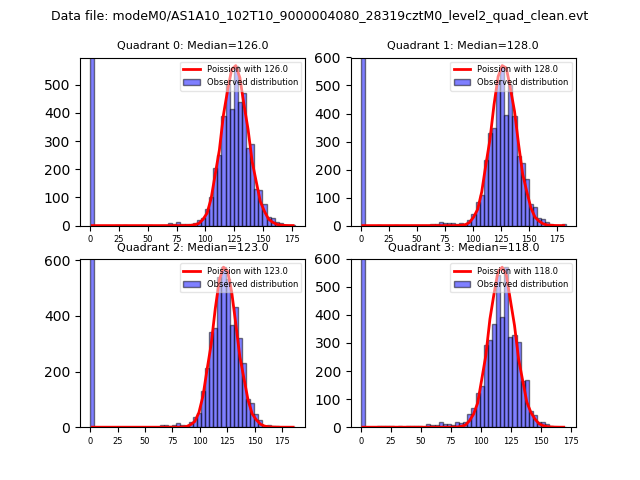 |
 |
| Quadrant-wise count rates Data is divided into 100 sec bins |
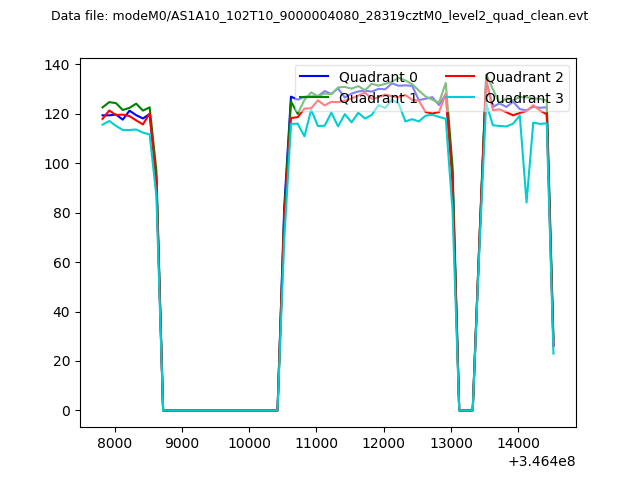 |
|
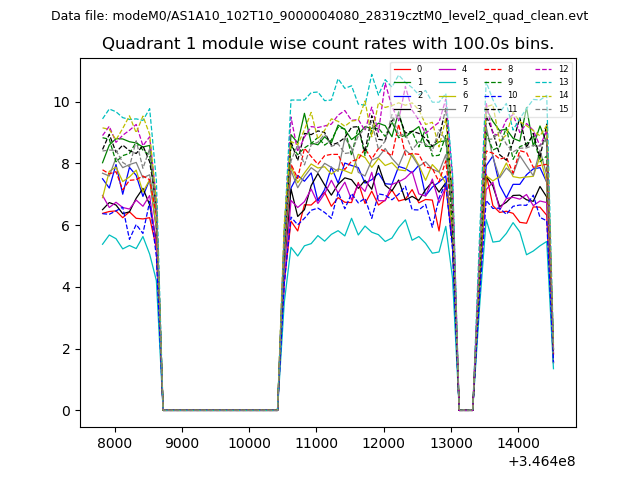
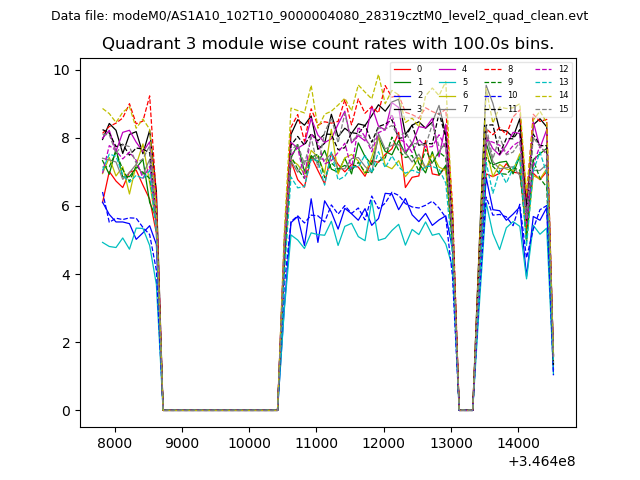
| Module-wise count rates for Quadrant A Data is divided into 100 sec bins |
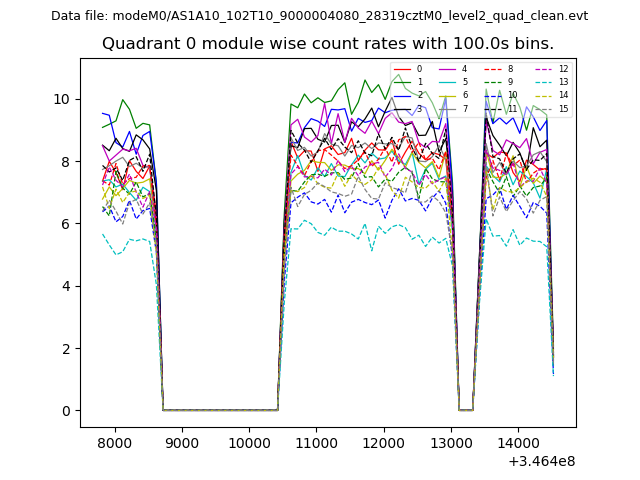 |
 |
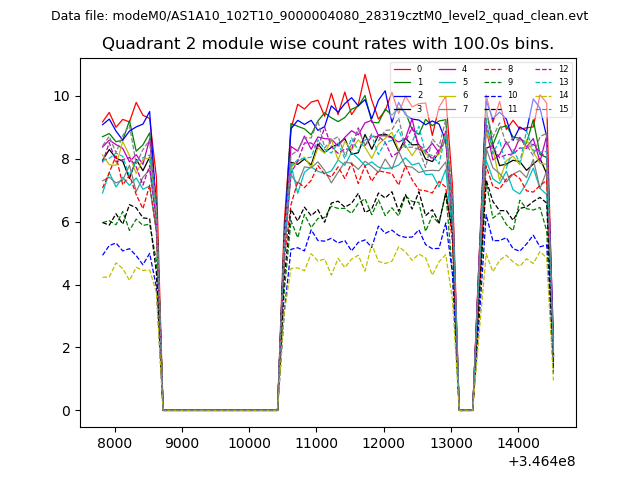
| Module-wise count rates for Quadrant B Data is divided into 100 sec bins |
 |
 |
| Module-wise count rates for Quadrant C Data is divided into 100 sec bins |
 |
 |
| Module-wise count rates for Quadrant D Data is divided into 100 sec bins |
 |
 |
| Parameter | Plot |
|---|---|
| CZT HV Monitor | 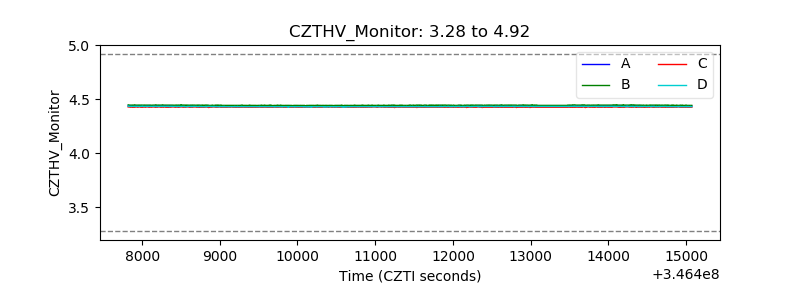 |
| D_VDD |  |
| Temperature 1 | 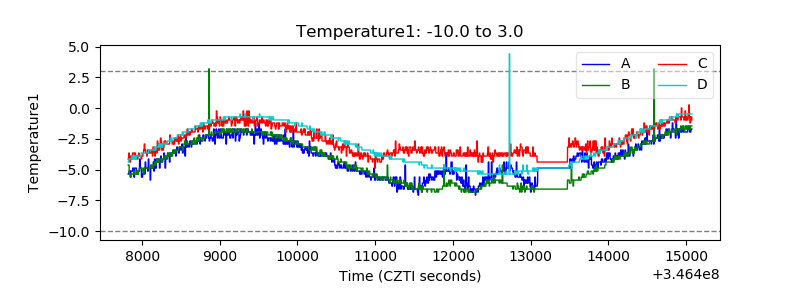 |
| Veto HV Monitor | 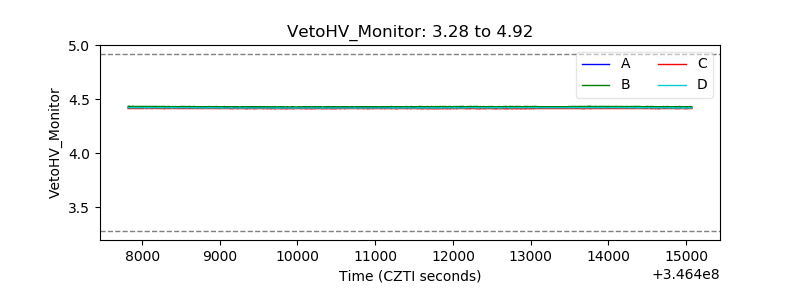 |
| Veto LLD | 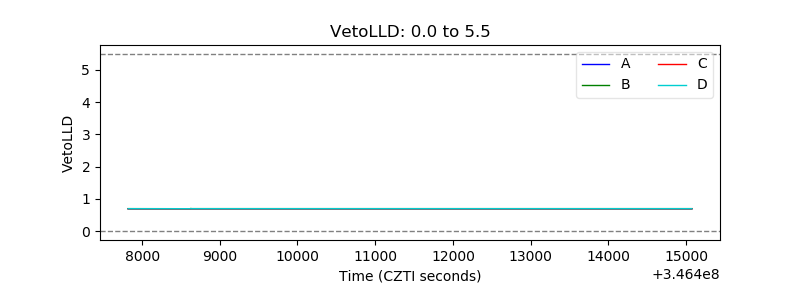 |
| Alpha Counter | 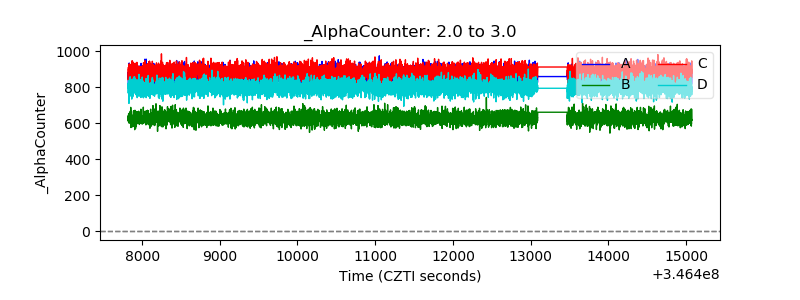 |
| _CPM_Rate | 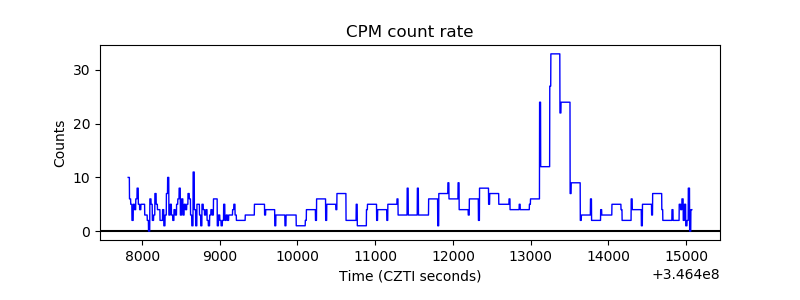 |
| CZT Counter | 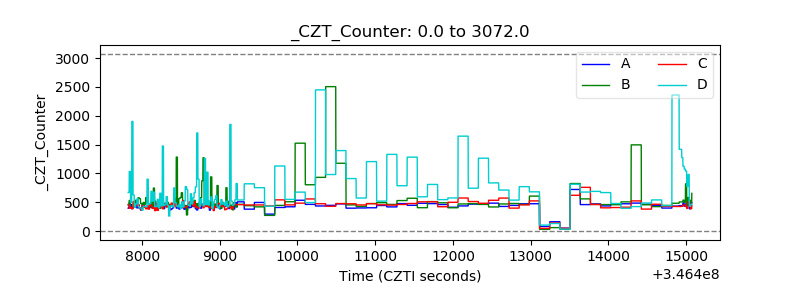 |
| +2.5 Volts monitor |  |
| +5 Volts monitor |  |
| _ROLL_ROT | 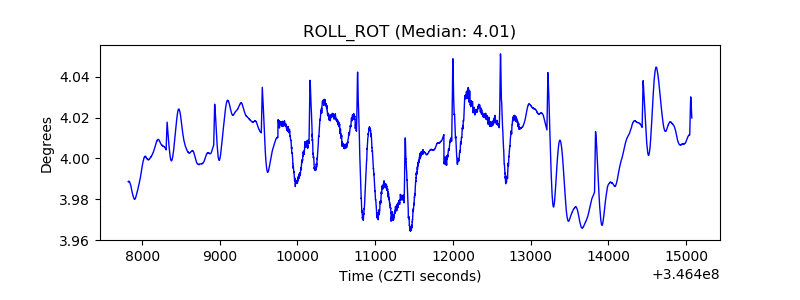 |
| _Roll_DEC | 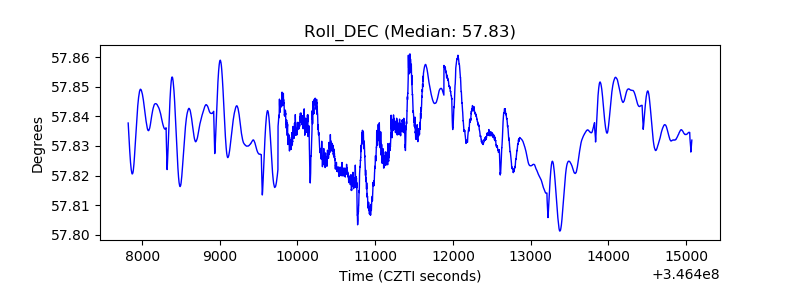 |
| _Roll_RA | 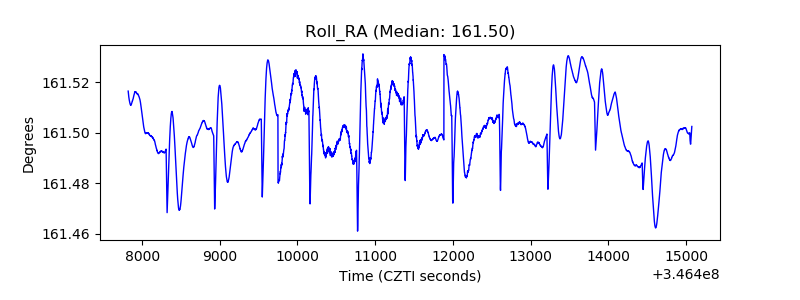 |
| Veto Counter | 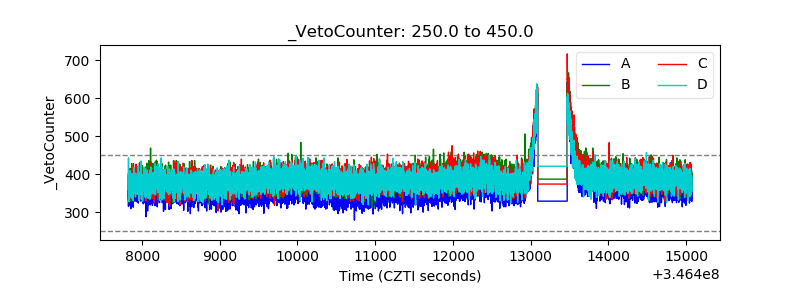 |