| Param | Original file | Final file |
|---|---|---|
| Filename | modeM0/AS1A10_102T10_9000004080_28321cztM0_level2.evt | modeM0/AS1A10_102T10_9000004080_28321cztM0_level2_quad_clean.evt |
| Size (bytes) | 704,903,040 | 100,059,840 |
| Size | 672.2 MB | 95.4 MB |
| Events in quadrant A | 4,226,688 | 621,961 |
| Events in quadrant B | 4,332,268 | 629,205 |
| Events in quadrant C | 4,013,905 | 604,964 |
| Events in quadrant D | 8,189,051 | 572,769 |
| Mode M0 | |||
|---|---|---|---|
| Quadrant | BADHDUFLAG | Total packets | Discarded packets |
| A | 0 | 18326 | 0 |
| B | 0 | 18402 | 0 |
| C | 0 | 17555 | 0 |
| D | 0 | 30207 | 0 |
| Mode M9 | |||
|---|---|---|---|
| Quadrant | BADHDUFLAG | Total packets | Discarded packets |
| A | 0 | 6 | 0 |
| B | 0 | 6 | 0 |
| C | 0 | 6 | 0 |
| D | 0 | 6 | 0 |
| Quadrant | Total seconds | Saturated seconds | Saturation percentage |
|---|---|---|---|
| A | 8664 | 117 | 1.350416% |
| B | 8664 | 85 | 0.981071% |
| C | 8664 | 75 | 0.865651% |
| D | 8664 | 854 | 9.856879% |
Noise dominated data is calculated using 1-second bins in cleaned event files. If a bin has >2000 counts, and if more than 50% of those come from <1% of pixels, then it is considered to be noise-dominated and hence unusable.
| Quadrant | # 1 sec bins | Bins with >0 counts | Bins with >2000 counts | High rate bins dominated by noise | Noise dominated (total time) | Noise dominated (detector-on time) | Marked lightcurve |
|---|---|---|---|---|---|---|---|
| A | 9239 | 8665 | 4 | 4 | 0.04% | 0.05% | 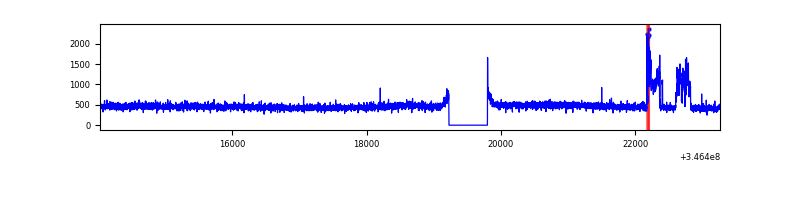 |
| B | 9239 | 8665 | 24 | 24 | 0.26% | 0.28% | 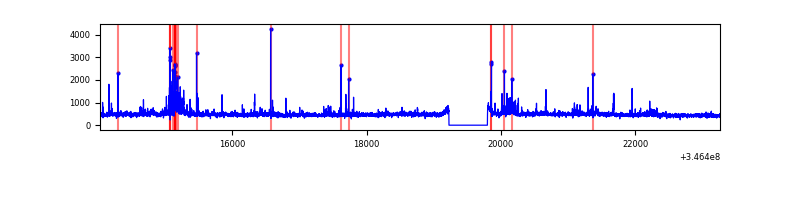 |
| C | 9239 | 8665 | 2 | 2 | 0.02% | 0.02% | 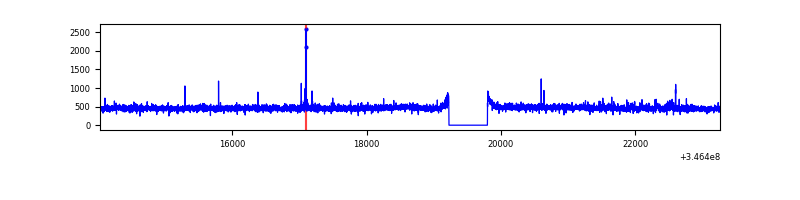 |
| D | 9239 | 8665 | 736 | 736 | 7.97% | 8.49% | 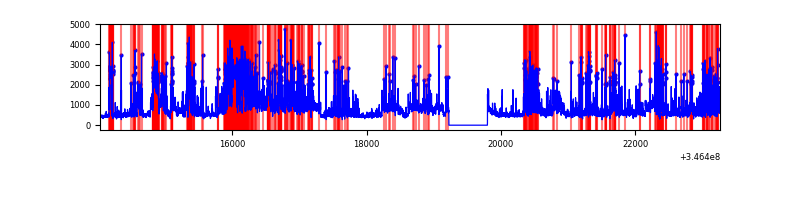 |
Top three noisy pixels from each quadrant. If the there are fewer than three noisy pixels in the level2.evt file, extra rows are filled as -1
| Pixel properties | Quadrant properties | ||||||
|---|---|---|---|---|---|---|---|
| Quadrant | DetID | PixID | Counts | Sigma | Mean | Median | Sigma |
| A | 15 | 9 | 292317 | 1428.25 | 1017 | 996 | 204.0 |
| A | 13 | 254 | 16552 | 76.27 | 1017 | 996 | 204.0 |
| A | 3 | 137 | 9931 | 43.81 | 1017 | 996 | 204.0 |
| B | 10 | 245 | 165249 | 848.95 | 1010 | 982 | 193.5 |
| B | 10 | 246 | 51664 | 261.93 | 1010 | 982 | 193.5 |
| B | 15 | 33 | 48333 | 244.72 | 1010 | 982 | 193.5 |
| C | 14 | 238 | 157887 | 682.17 | 976 | 979 | 230.0 |
| C | 3 | 233 | 52576 | 224.32 | 976 | 979 | 230.0 |
| C | 13 | 61 | 6559 | 24.26 | 976 | 979 | 230.0 |
| D | 1 | 52 | 2922504 | 12901.48 | 947 | 921 | 226.5 |
| D | 8 | 195 | 1188210 | 5242.97 | 947 | 921 | 226.5 |
| D | 2 | 250 | 189999 | 834.95 | 947 | 921 | 226.5 |
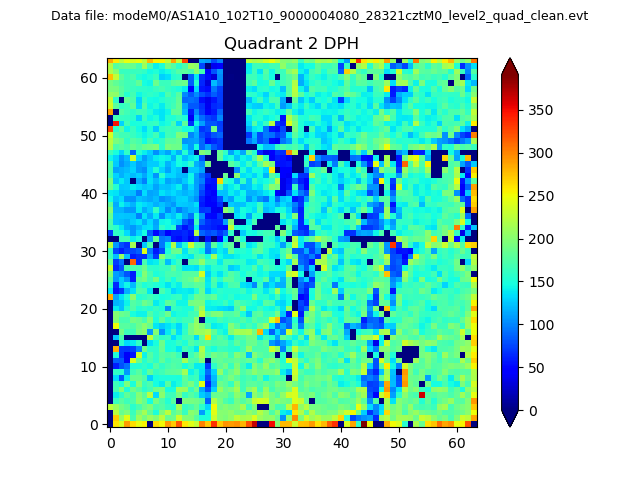
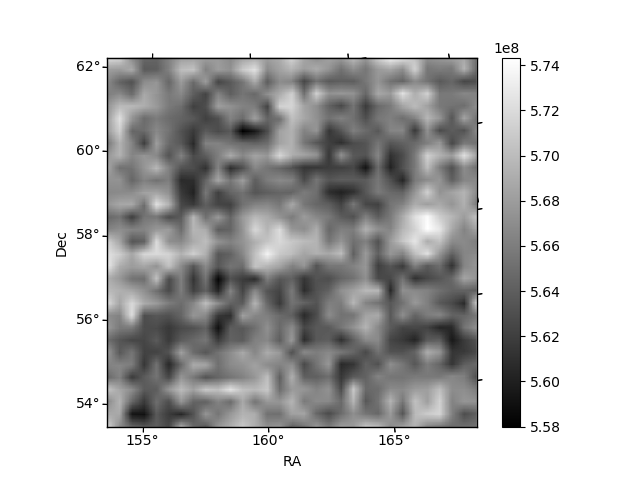
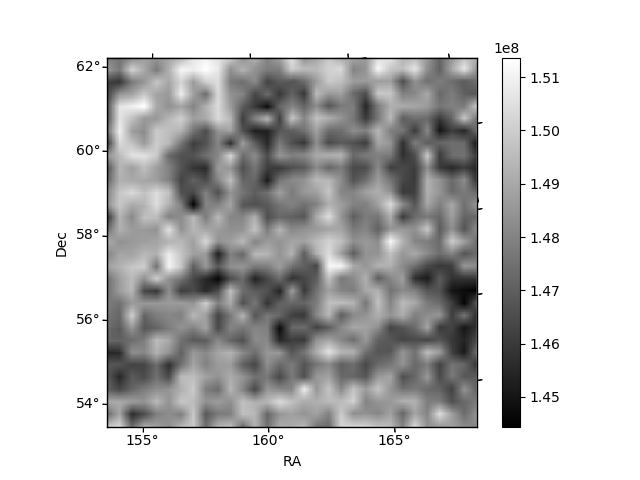
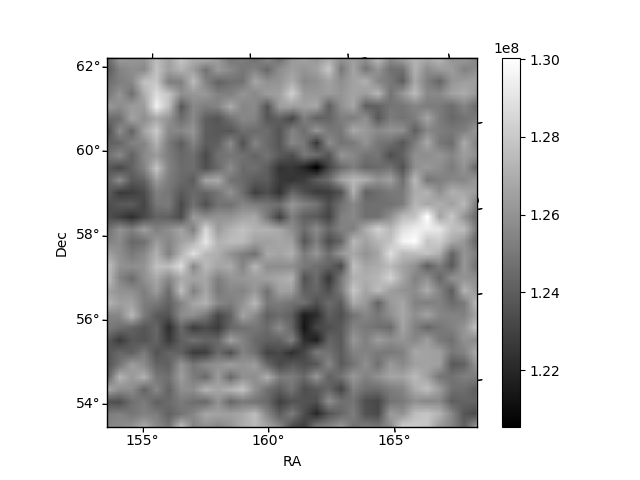
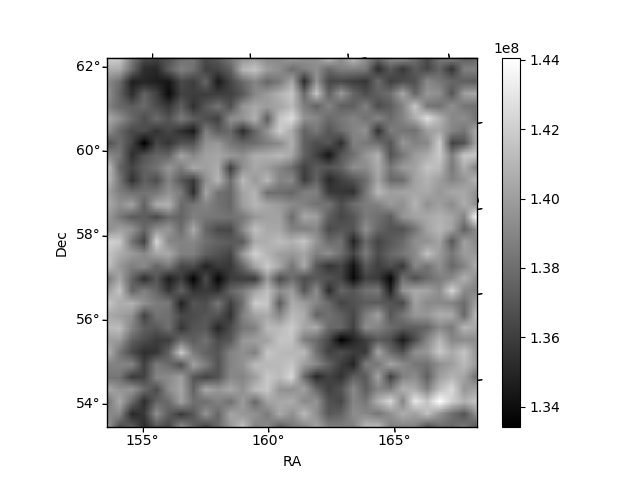
Histogram calculated using DETX and DETY for each event in the final _common_clean file
| Quadrant A | 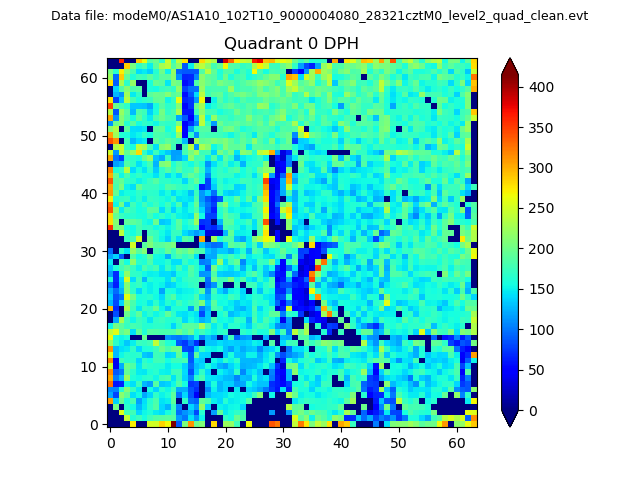 |
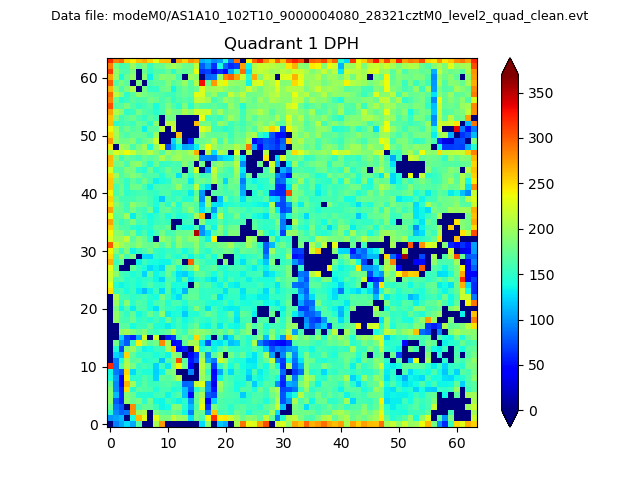 |
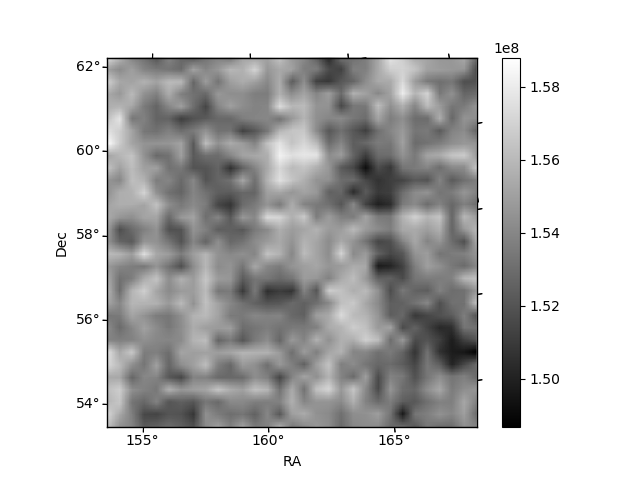
Quadrant B |
|---|---|---|---|
| Quadrant D | 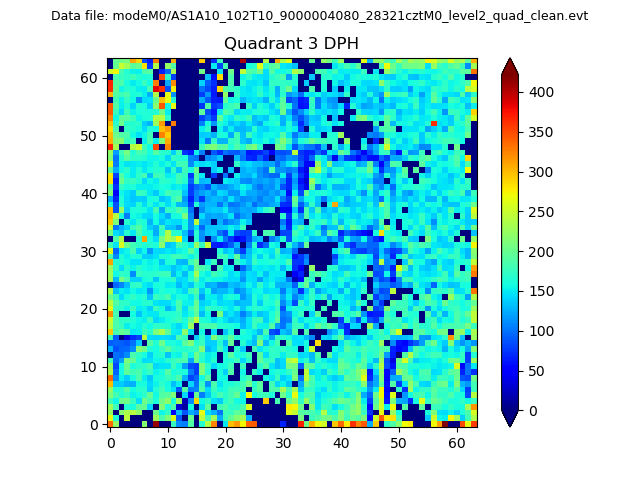 |
 |
Quadrant C |
| Plot type | Count rate plots | Images |
|---|---|---|
| Comparison with Poisson distribution Blue bars denote a histogram of data divided into 1 sec bins. Red curve is a Poisson curve with rate = median count rate of data. |
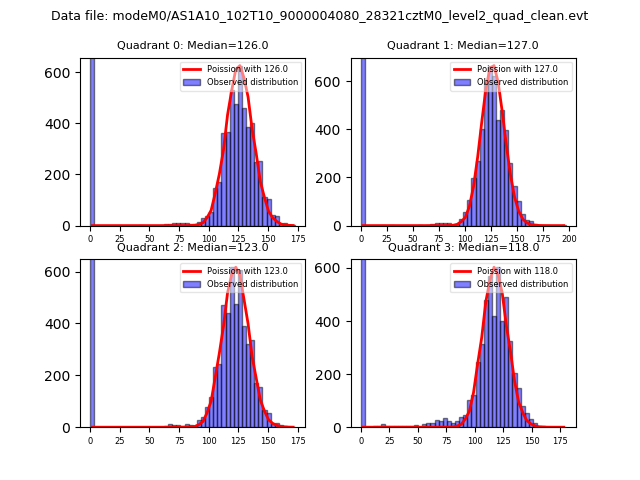 |
 |
| Quadrant-wise count rates Data is divided into 100 sec bins |
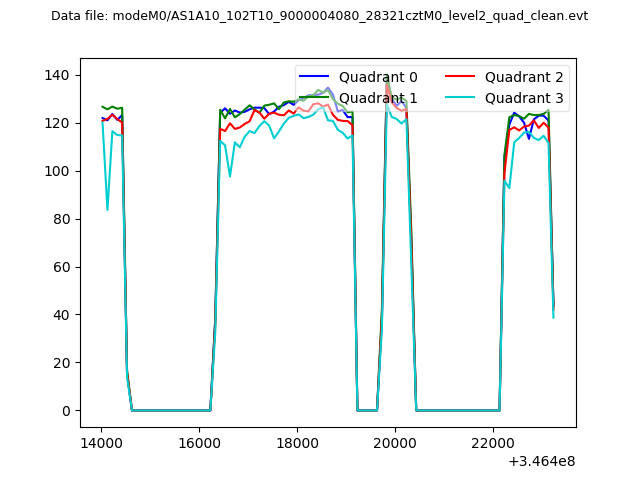 |
|
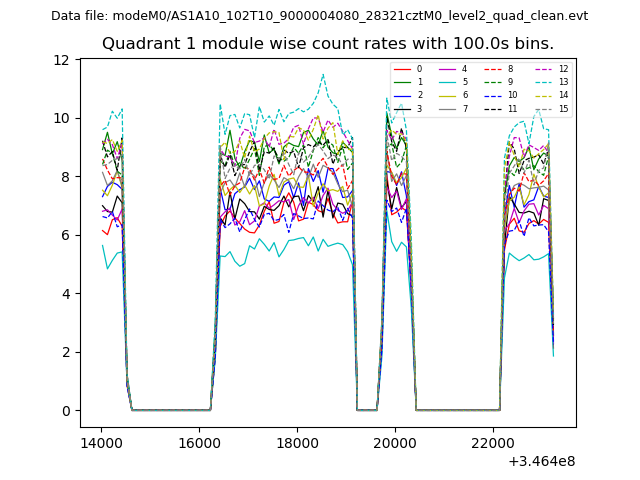
| Module-wise count rates for Quadrant A Data is divided into 100 sec bins |
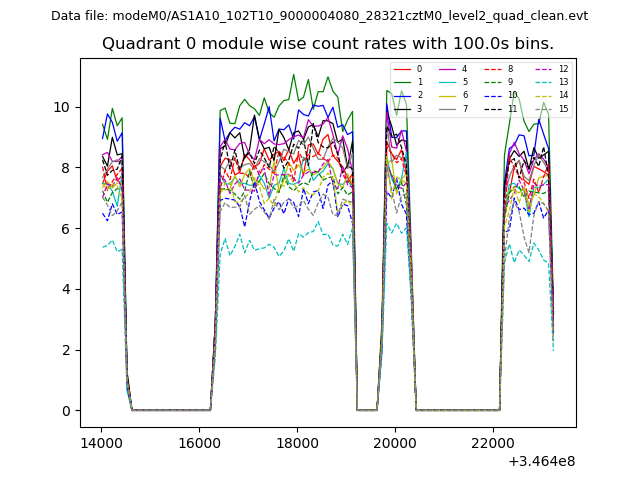 |
 |
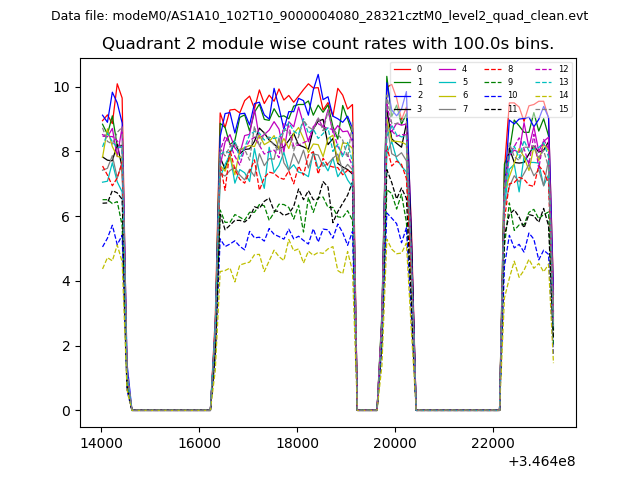
| Module-wise count rates for Quadrant B Data is divided into 100 sec bins |
 |
 |
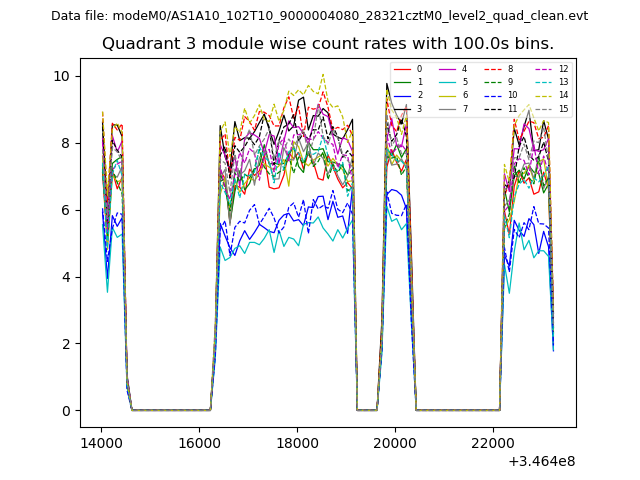
| Module-wise count rates for Quadrant C Data is divided into 100 sec bins |
 |
 |
| Module-wise count rates for Quadrant D Data is divided into 100 sec bins |
 |
 |
| Parameter | Plot |
|---|---|
| CZT HV Monitor | 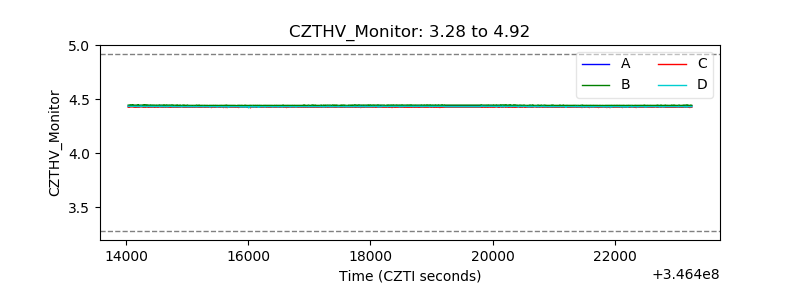 |
| D_VDD | 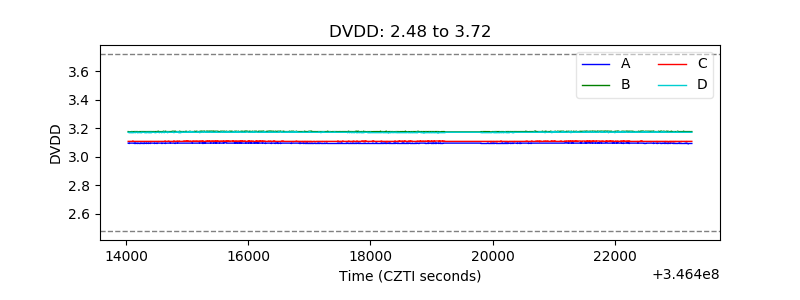 |
| Temperature 1 | 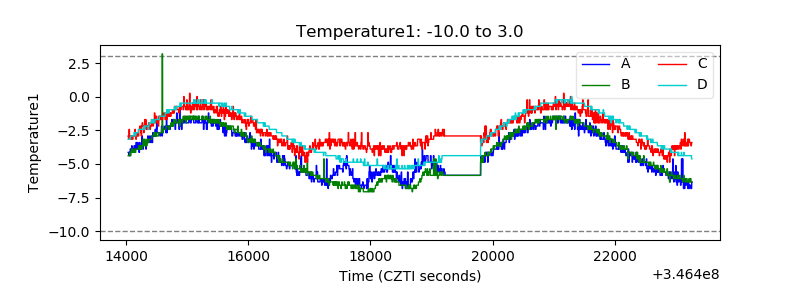 |
| Veto HV Monitor | 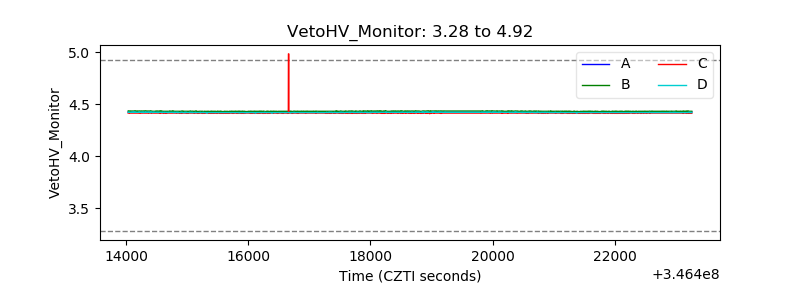 |
| Veto LLD | 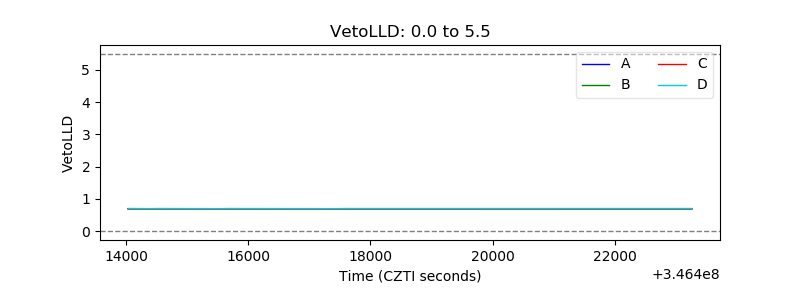 |
| Alpha Counter | 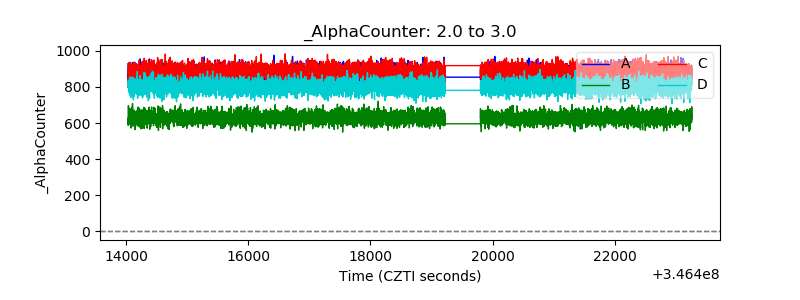 |
| _CPM_Rate | 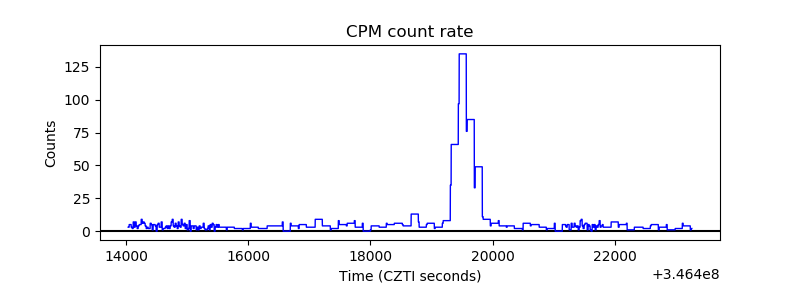 |
| CZT Counter | 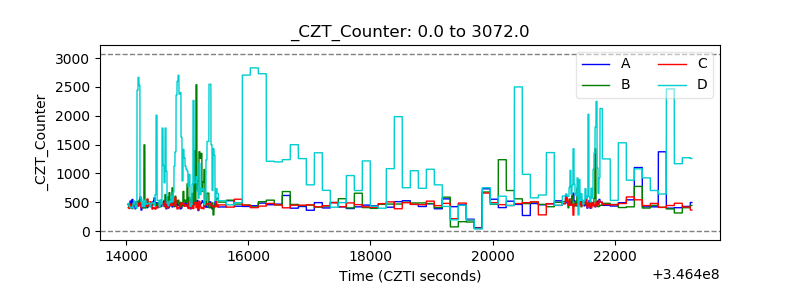 |
| +2.5 Volts monitor |  |
| +5 Volts monitor |  |
| _ROLL_ROT | 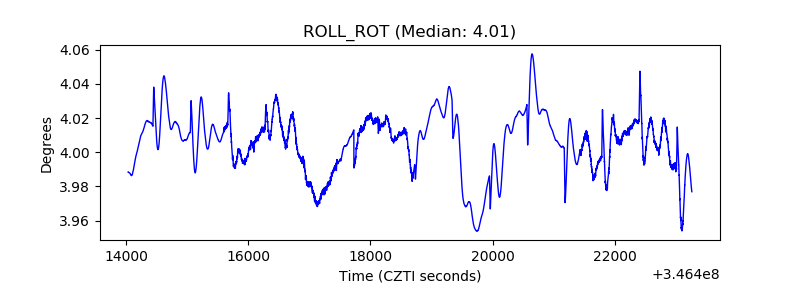 |
| _Roll_DEC | 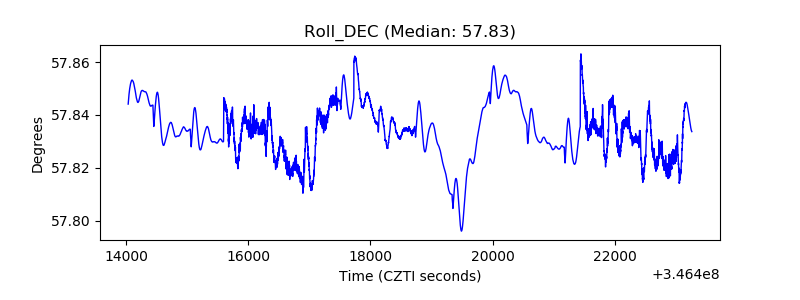 |
| _Roll_RA | 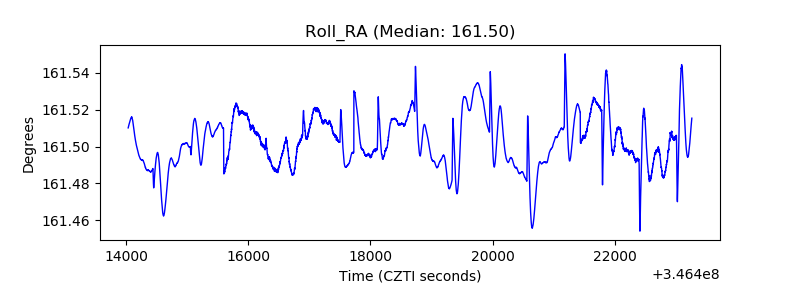 |
| Veto Counter | 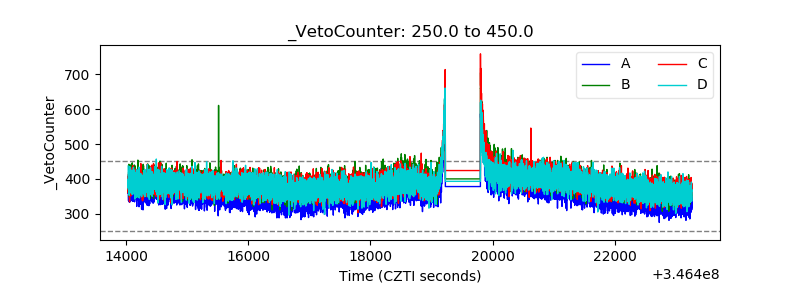 |