| Param | Original file | Final file |
|---|---|---|
| Filename | modeM0/AS1A10_116T01_9000004082cztM0_level2.fits | modeM0/AS1A10_116T01_9000004082cztM0_level2_quad_clean.evt |
| Size (bytes) | 1,635,693,120 | 1,256,068,800 |
| Size | 1.5 GB | 1.2 GB |
| Events in quadrant A | 10,130,410 | 7,078,110 |
| Events in quadrant B | 9,766,638 | 7,079,352 |
| Events in quadrant C | 9,909,130 | 6,698,796 |
| Events in quadrant D | 8,426,162 | 5,879,917 |
| Mode SS | |||
|---|---|---|---|
| Quadrant | BADHDUFLAG | Total packets | Discarded packets |
| A | 0 | 3358 | 0 |
| B | 0 | 3358 | 0 |
| C | 0 | 3358 | 0 |
| D | 0 | 3358 | 0 |
| Mode M9 | |||
|---|---|---|---|
| Quadrant | BADHDUFLAG | Total packets | Discarded packets |
| A | 0 | 267 | 0 |
| B | 0 | 267 | 0 |
| C | 0 | 267 | 0 |
| D | 0 | 267 | 0 |
| Mode M0 | |||
|---|---|---|---|
| Quadrant | BADHDUFLAG | Total packets | Discarded packets |
| A | 0 | 351049 | 0 |
| B | 0 | 367867 | 0 |
| C | 0 | 358727 | 0 |
| D | 0 | 493356 | 0 |
| Quadrant | Total seconds | Saturated seconds | Saturation percentage |
|---|---|---|---|
| A | 164957 | 2512 | 1.522821% |
| B | 164957 | 4180 | 2.533994% |
| C | 164957 | 3419 | 2.072661% |
| D | 164957 | 9902 | 6.002776% |
Noise dominated data is calculated using 1-second bins in cleaned event files. If a bin has >2000 counts, and if more than 50% of those come from <1% of pixels, then it is considered to be noise-dominated and hence unusable.
| Quadrant | # 1 sec bins | Bins with >0 counts | Bins with >2000 counts | High rate bins dominated by noise | Noise dominated (total time) | Noise dominated (detector-on time) | Marked lightcurve |
|---|---|---|---|---|---|---|---|
| A | 191572 | 164947 | 0 | 0 | 0.00% | 0.00% | 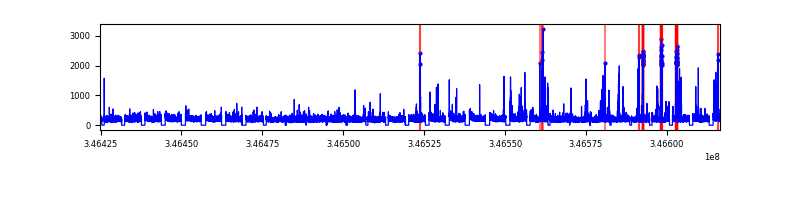 |
| B | 191572 | 164937 | 0 | 0 | 0.00% | 0.00% |  |
| C | 191572 | 164949 | 0 | 0 | 0.00% | 0.00% |  |
| D | 191572 | 164793 | 0 | 0 | 0.00% | 0.00% | 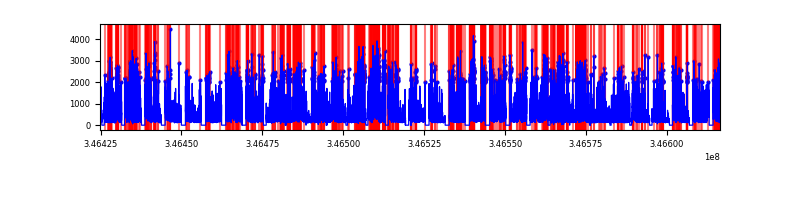 |
Top three noisy pixels from each quadrant. If the there are fewer than three noisy pixels in the level2.evt file, extra rows are filled as -1
| Pixel properties | Quadrant properties | ||||||
|---|---|---|---|---|---|---|---|
| Quadrant | DetID | PixID | Counts | Sigma | Mean | Median | Sigma |
| A | 0 | 29 | 9601 | 11.1 | 2637 | 2477 | 641.5 |
| A | 7 | 110 | 8104 | 8.77 | 2637 | 2477 | 641.5 |
| A | 0 | 30 | 7595 | 7.98 | 2637 | 2477 | 641.5 |
| B | 2 | 9 | 7810 | 10.58 | 2580 | 2463 | 505.4 |
| B | 2 | 8 | 6537 | 8.06 | 2580 | 2463 | 505.4 |
| B | 3 | 17 | 6402 | 7.79 | 2580 | 2463 | 505.4 |
| C | 12 | 241 | 6954 | 6.83 | 2617 | 2447 | 659.8 |
| C | 9 | 209 | 6648 | 6.37 | 2617 | 2447 | 659.8 |
| C | 3 | 126 | 6637 | 6.35 | 2617 | 2447 | 659.8 |
| D | 7 | 3 | 5955 | 5.95 | 2404 | 2192 | 632.8 |
| D | 6 | 231 | 5907 | 5.87 | 2404 | 2192 | 632.8 |
| D | 6 | 67 | 5842 | 5.77 | 2404 | 2192 | 632.8 |
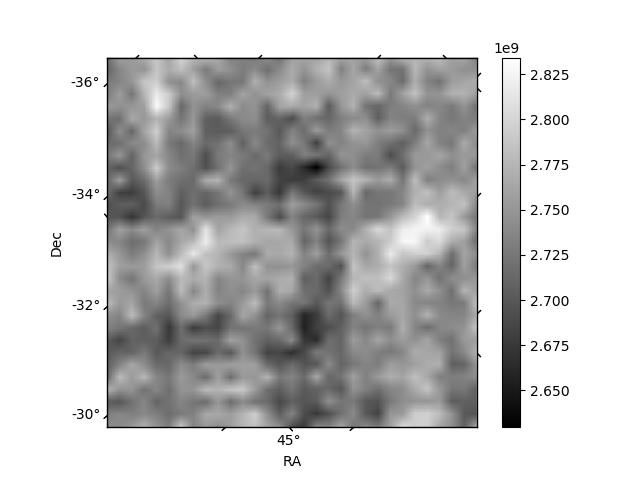
Histogram calculated using DETX and DETY for each event in the final _common_clean file
| Quadrant A |  |
 |
Quadrant B |
|---|---|---|---|
| Quadrant D |  |
 |
Quadrant C |
| Plot type | Count rate plots | Images |
|---|---|---|
| Comparison with Poisson distribution Blue bars denote a histogram of data divided into 1 sec bins. Red curve is a Poisson curve with rate = median count rate of data. |
 |
 |
| Quadrant-wise count rates Data is divided into 100 sec bins |
 |
|
| Module-wise count rates for Quadrant A Data is divided into 100 sec bins |
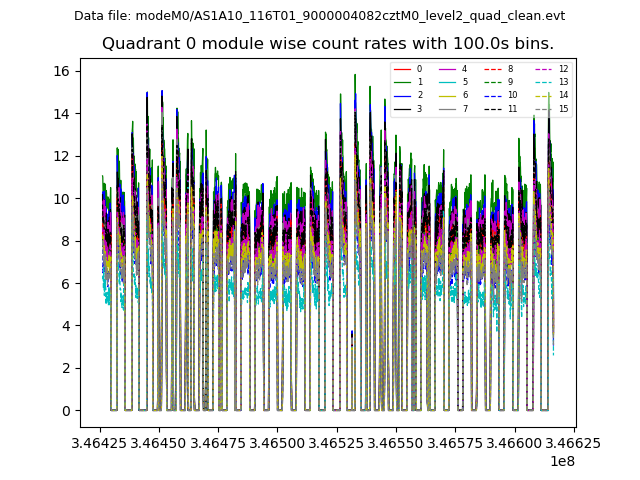 |
 |
| Module-wise count rates for Quadrant B Data is divided into 100 sec bins |
 |
 |
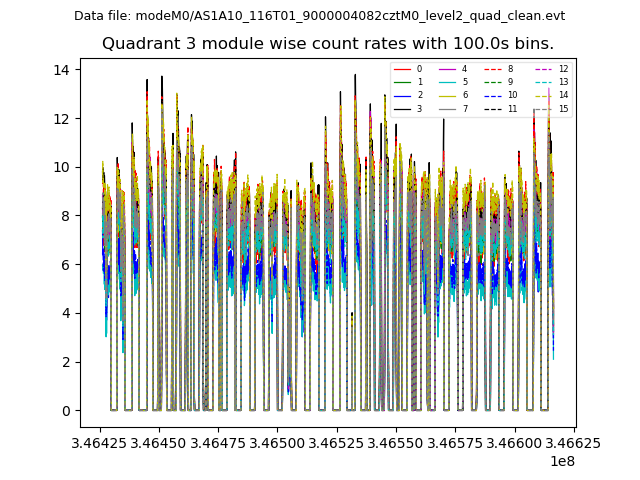
| Module-wise count rates for Quadrant C Data is divided into 100 sec bins |
 |
 |
| Module-wise count rates for Quadrant D Data is divided into 100 sec bins |
 |
 |
| Parameter | Plot |
|---|---|
| CZT HV Monitor |  |
| D_VDD | 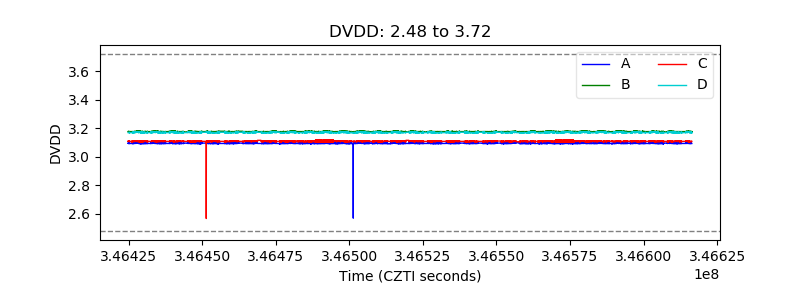 |
| Temperature 1 |  |
| Veto HV Monitor |  |
| Veto LLD |  |
| Alpha Counter | 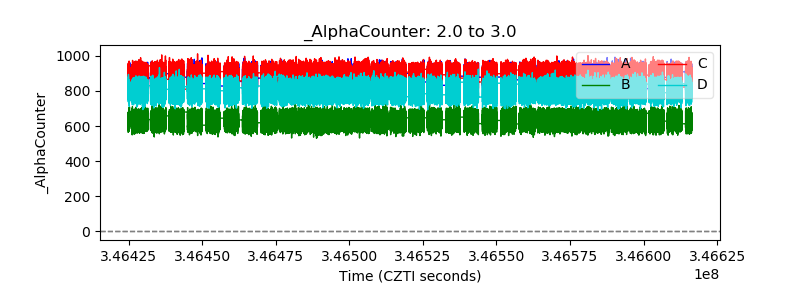 |
| _CPM_Rate |  |
| CZT Counter |  |
| +2.5 Volts monitor |  |
| +5 Volts monitor |  |
| _ROLL_ROT | 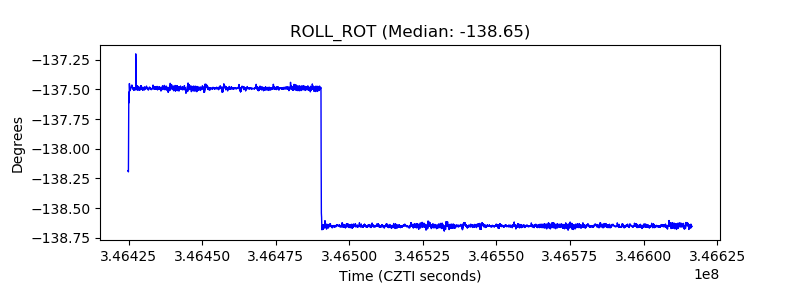 |
| _Roll_DEC |  |
| _Roll_RA | 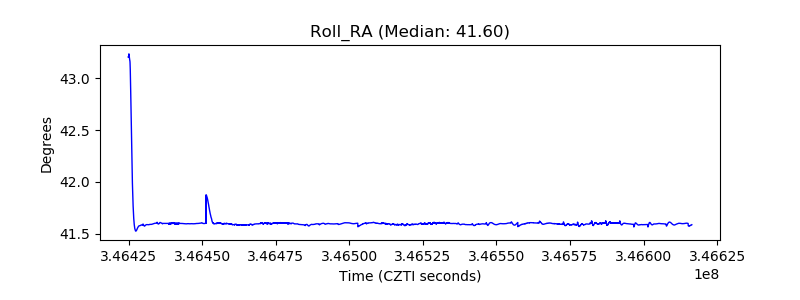 |
| Veto Counter |  |