| Param | Original file | Final file |
|---|---|---|
| Filename | modeM0/AS1A10_116T01_9000004082_28321cztM0_level2.evt | modeM0/AS1A10_116T01_9000004082_28321cztM0_level2_quad_clean.evt |
| Size (bytes) | 158,837,760 | 26,591,040 |
| Size | 151.5 MB | 25.4 MB |
| Events in quadrant A | 1,026,413 | 168,953 |
| Events in quadrant B | 1,109,743 | 172,612 |
| Events in quadrant C | 1,142,608 | 163,626 |
| Events in quadrant D | 1,397,345 | 158,191 |
| Mode M9 | |||
|---|---|---|---|
| Quadrant | BADHDUFLAG | Total packets | Discarded packets |
| A | 0 | 7 | 0 |
| B | 0 | 7 | 0 |
| C | 0 | 7 | 0 |
| D | 0 | 7 | 0 |
| Mode M0 | |||
|---|---|---|---|
| Quadrant | BADHDUFLAG | Total packets | Discarded packets |
| A | 0 | 4120 | 0 |
| B | 0 | 4417 | 0 |
| C | 0 | 4602 | 0 |
| D | 0 | 5368 | 0 |
| Quadrant | Total seconds | Saturated seconds | Saturation percentage |
|---|---|---|---|
| A | 1938 | 63 | 3.250774% |
| B | 1938 | 82 | 4.231166% |
| C | 1937 | 87 | 4.491482% |
| D | 1937 | 93 | 4.801239% |
Noise dominated data is calculated using 1-second bins in cleaned event files. If a bin has >2000 counts, and if more than 50% of those come from <1% of pixels, then it is considered to be noise-dominated and hence unusable.
| Quadrant | # 1 sec bins | Bins with >0 counts | Bins with >2000 counts | High rate bins dominated by noise | Noise dominated (total time) | Noise dominated (detector-on time) | Marked lightcurve |
|---|---|---|---|---|---|---|---|
| A | 2698 | 1938 | 1 | 1 | 0.04% | 0.05% | 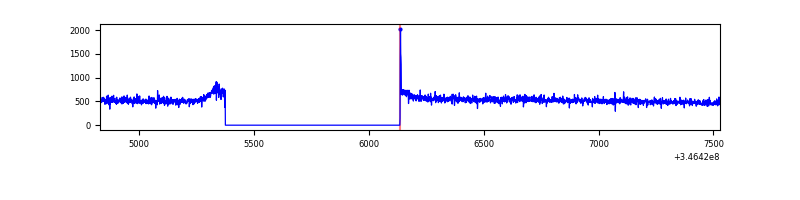 |
| B | 2698 | 1938 | 9 | 9 | 0.33% | 0.46% | 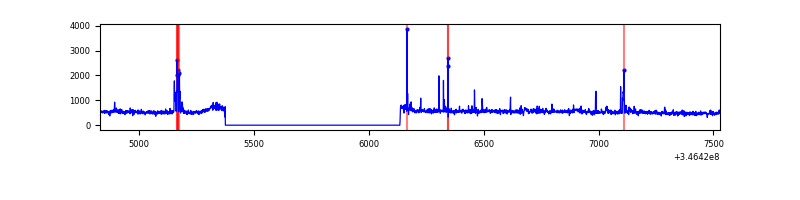 |
| C | 2697 | 1937 | 0 | 0 | 0.00% | 0.00% | 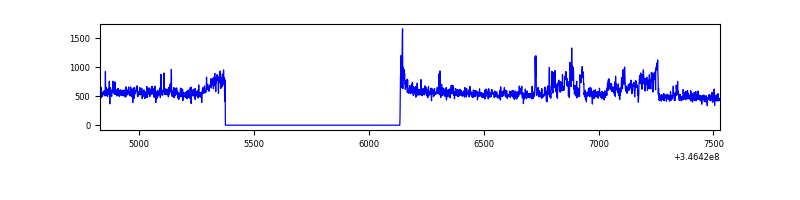 |
| D | 2697 | 1937 | 33 | 33 | 1.22% | 1.70% | 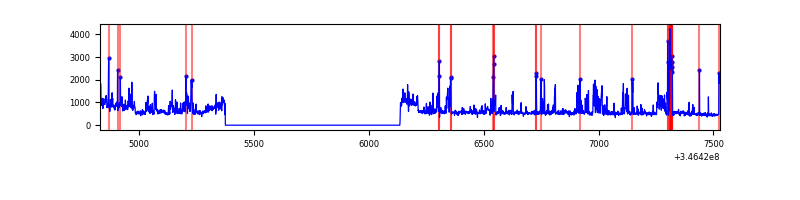 |
Top three noisy pixels from each quadrant. If the there are fewer than three noisy pixels in the level2.evt file, extra rows are filled as -1
| Pixel properties | Quadrant properties | ||||||
|---|---|---|---|---|---|---|---|
| Quadrant | DetID | PixID | Counts | Sigma | Mean | Median | Sigma |
| A | 8 | 192 | 5348 | 92.33 | 264 | 258 | 55.1 |
| A | 13 | 254 | 3178 | 52.97 | 264 | 258 | 55.1 |
| A | 3 | 137 | 2872 | 47.42 | 264 | 258 | 55.1 |
| B | 10 | 245 | 70969 | 1335.6 | 259 | 252 | 52.9 |
| B | 10 | 246 | 6992 | 127.29 | 259 | 252 | 52.9 |
| B | 12 | 111 | 6403 | 116.17 | 259 | 252 | 52.9 |
| C | 3 | 233 | 124792 | 2049.66 | 250 | 250 | 60.8 |
| C | 14 | 238 | 40774 | 666.93 | 250 | 250 | 60.8 |
| C | 13 | 61 | 1721 | 24.21 | 250 | 250 | 60.8 |
| D | 1 | 52 | 244032 | 3817.81 | 254 | 246 | 63.9 |
| D | 8 | 195 | 120591 | 1884.66 | 254 | 246 | 63.9 |
| D | 7 | 238 | 44602 | 694.64 | 254 | 246 | 63.9 |
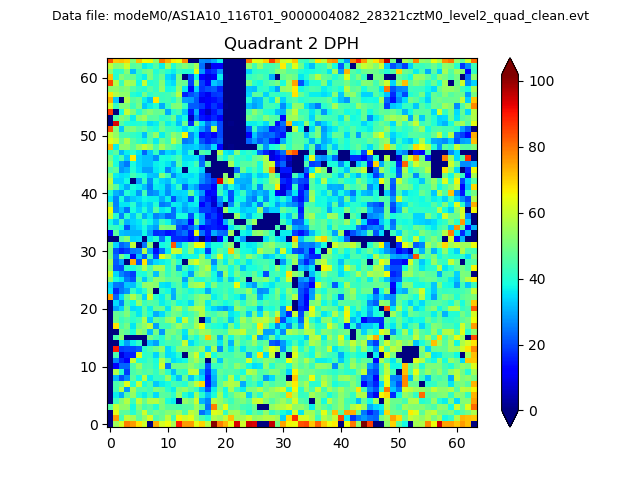
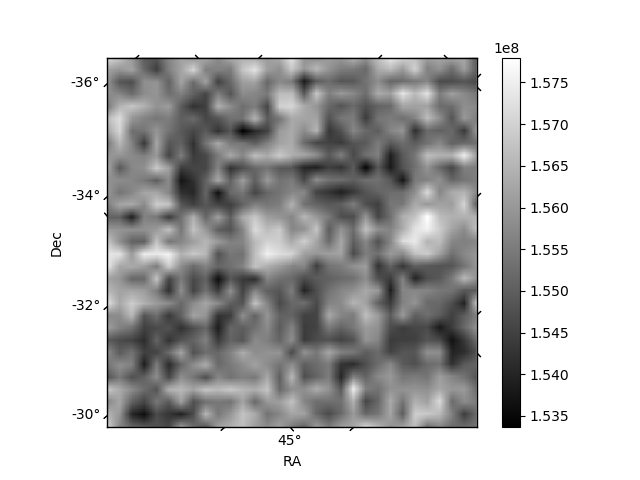
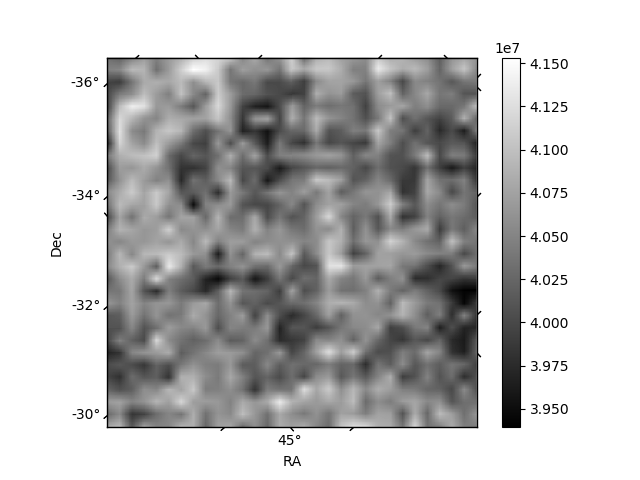
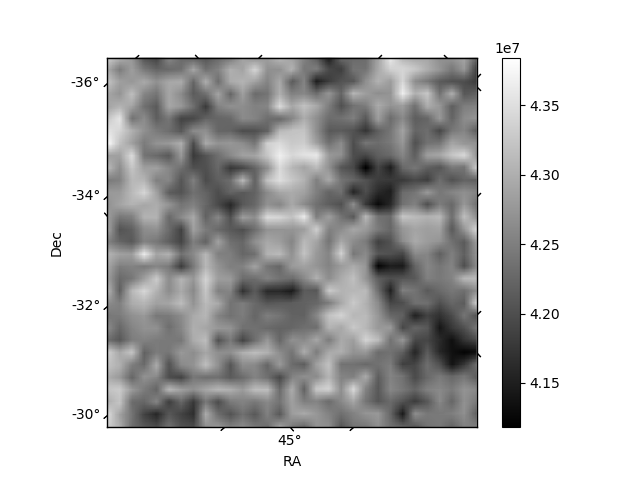
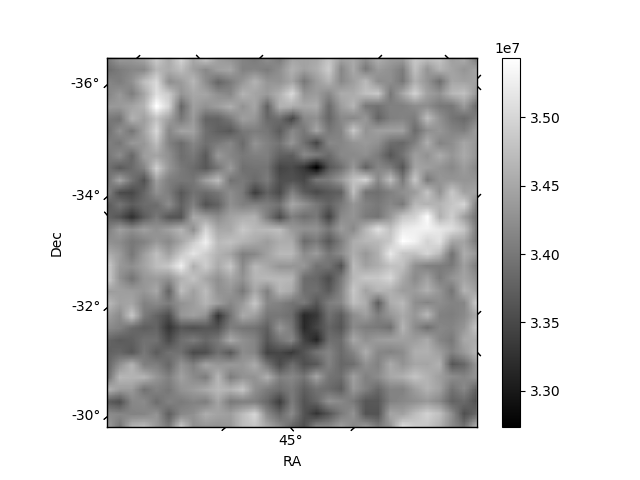
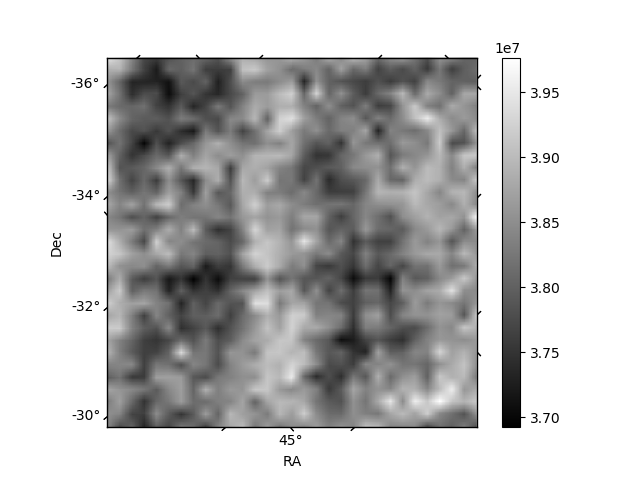
Histogram calculated using DETX and DETY for each event in the final _common_clean file
| Quadrant A | 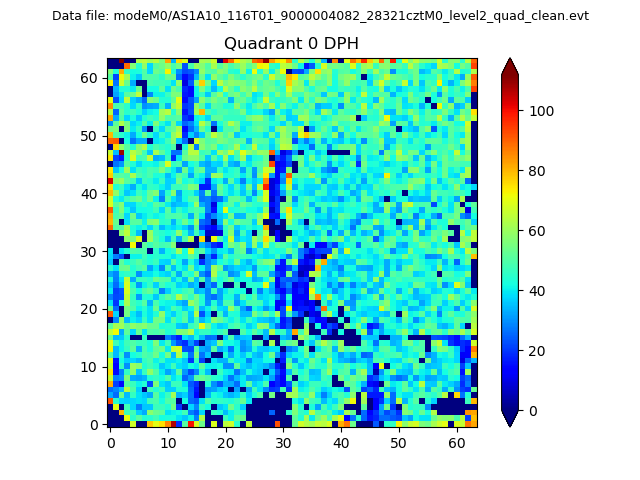 |
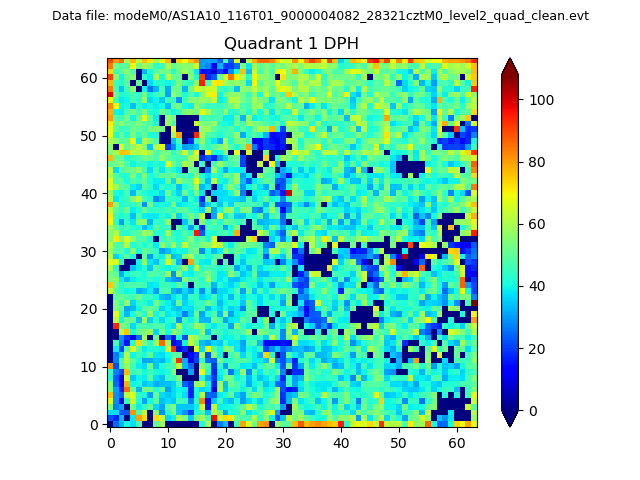 |
Quadrant B |
|---|---|---|---|
| Quadrant D | 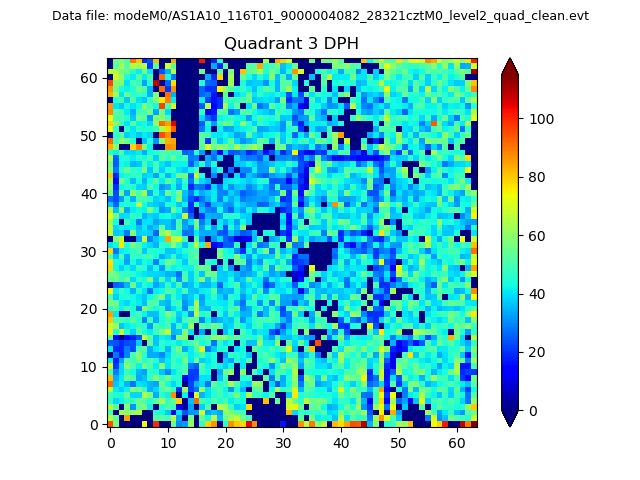 |
 |
Quadrant C |
| Plot type | Count rate plots | Images |
|---|---|---|
| Comparison with Poisson distribution Blue bars denote a histogram of data divided into 1 sec bins. Red curve is a Poisson curve with rate = median count rate of data. |
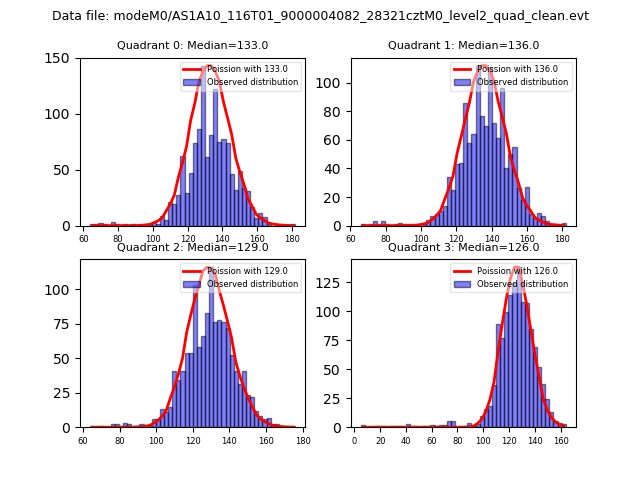 |
 |
| Quadrant-wise count rates Data is divided into 100 sec bins |
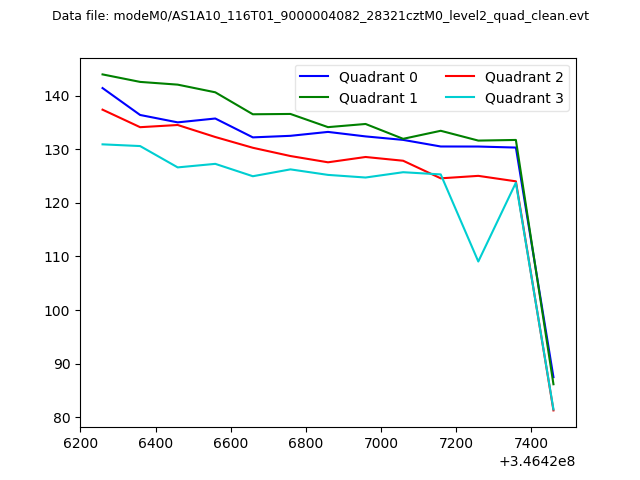 |
|
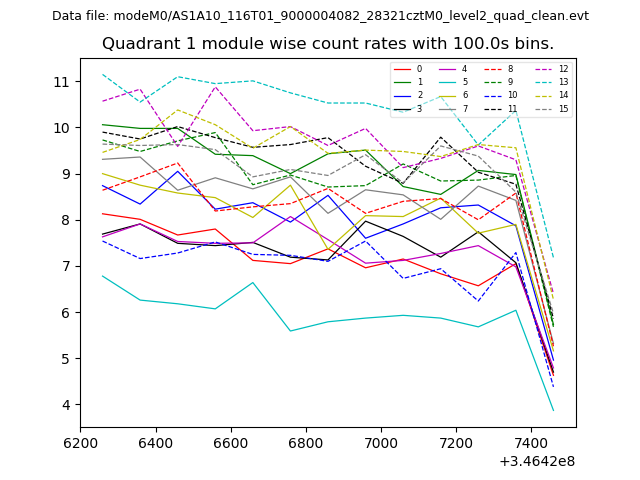
| Module-wise count rates for Quadrant A Data is divided into 100 sec bins |
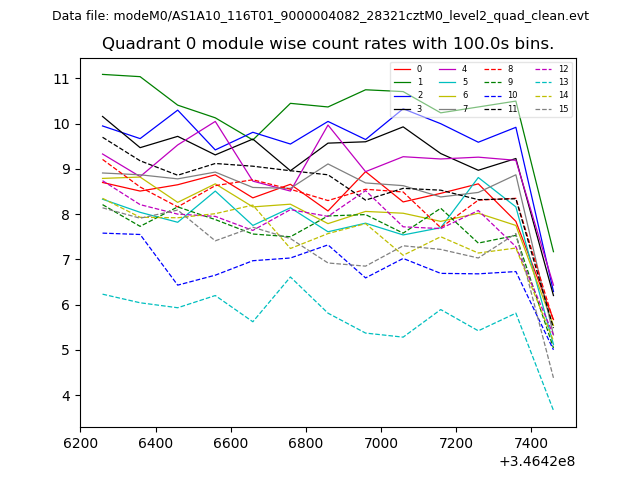 |
 |
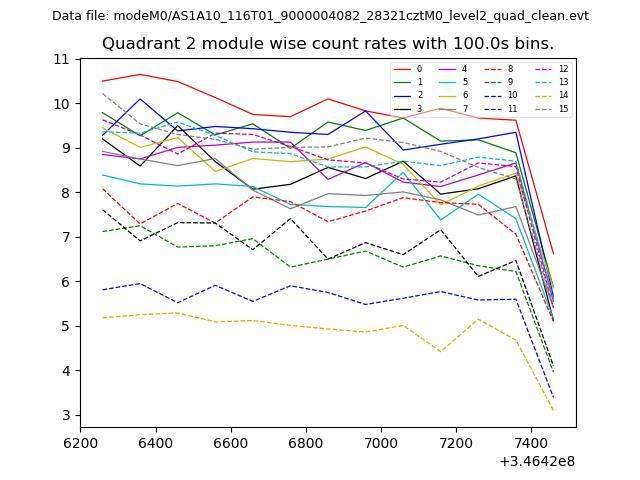
| Module-wise count rates for Quadrant B Data is divided into 100 sec bins |
 |
 |
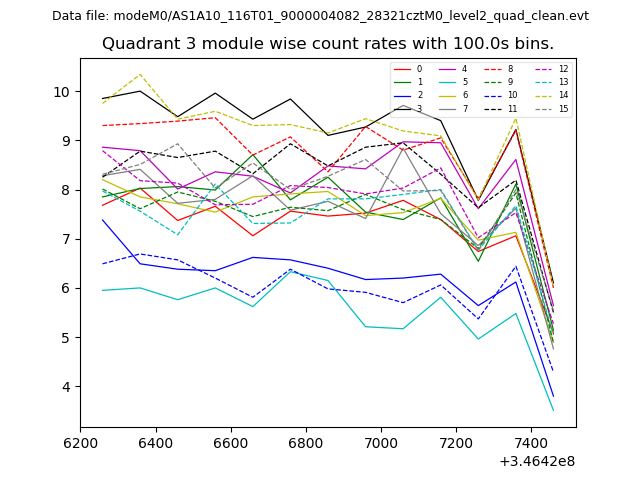
| Module-wise count rates for Quadrant C Data is divided into 100 sec bins |
 |
 |
| Module-wise count rates for Quadrant D Data is divided into 100 sec bins |
 |
 |
| Parameter | Plot |
|---|---|
| CZT HV Monitor | 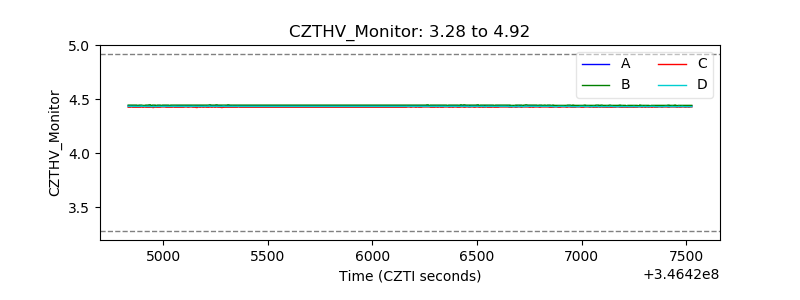 |
| D_VDD | 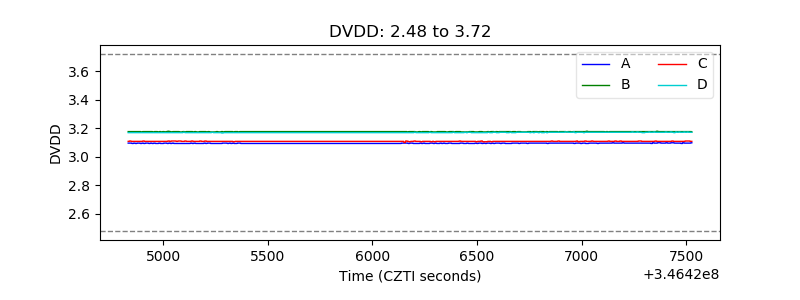 |
| Temperature 1 |  |
| Veto HV Monitor | 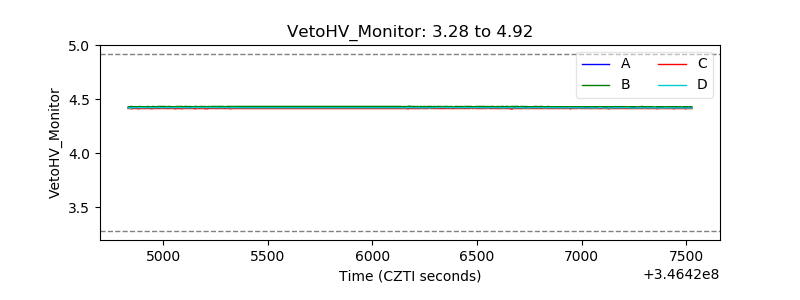 |
| Veto LLD | 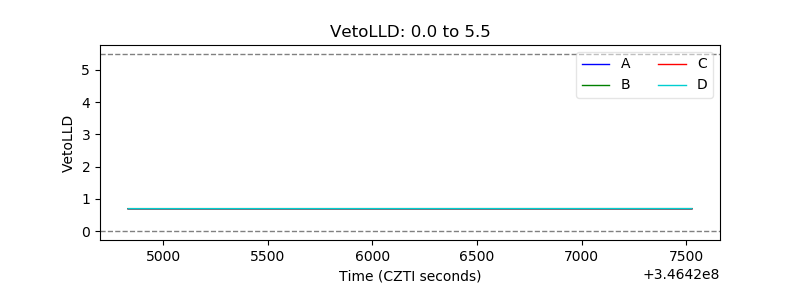 |
| Alpha Counter | 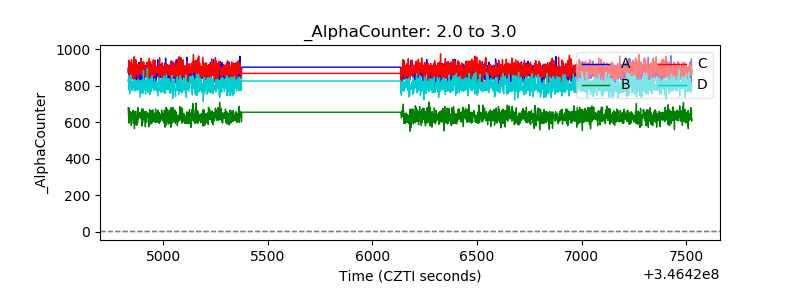 |
| _CPM_Rate | 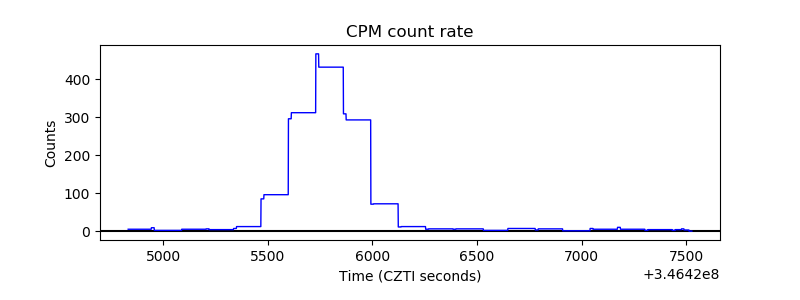 |
| CZT Counter | 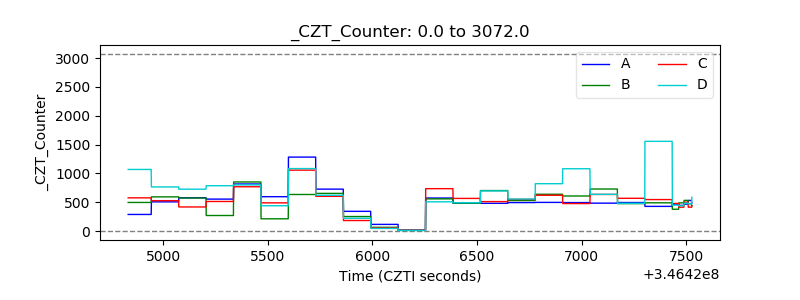 |
| +2.5 Volts monitor |  |
| +5 Volts monitor |  |
| _ROLL_ROT | 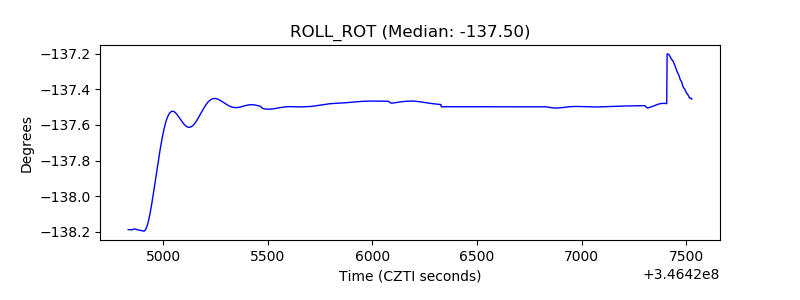 |
| _Roll_DEC |  |
| _Roll_RA | 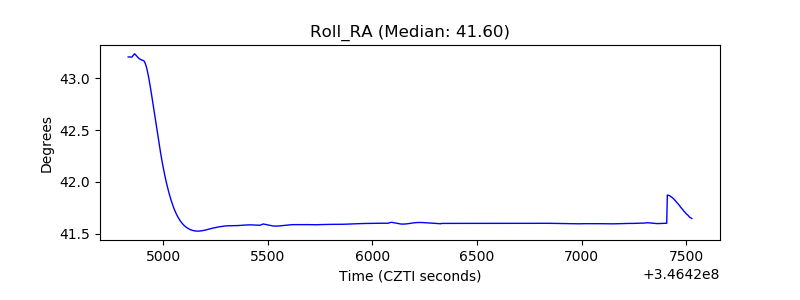 |
| Veto Counter | 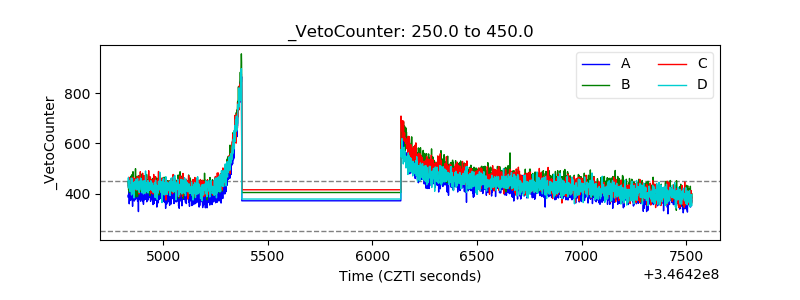 |