| Param | Original file | Final file |
|---|---|---|
| Filename | modeM0/AS1A10_116T01_9000004082_28322cztM0_level2.evt | modeM0/AS1A10_116T01_9000004082_28322cztM0_level2_quad_clean.evt |
| Size (bytes) | 513,241,920 | 91,373,760 |
| Size | 489.5 MB | 87.1 MB |
| Events in quadrant A | 2,955,225 | 607,969 |
| Events in quadrant B | 3,868,442 | 600,479 |
| Events in quadrant C | 3,084,849 | 575,474 |
| Events in quadrant D | 5,212,435 | 548,175 |
| Mode M9 | |||
|---|---|---|---|
| Quadrant | BADHDUFLAG | Total packets | Discarded packets |
| A | 0 | 9 | 0 |
| B | 0 | 9 | 0 |
| C | 0 | 9 | 0 |
| D | 0 | 9 | 0 |
| Mode M0 | |||
|---|---|---|---|
| Quadrant | BADHDUFLAG | Total packets | Discarded packets |
| A | 0 | 12830 | 0 |
| B | 0 | 15603 | 0 |
| C | 0 | 13289 | 0 |
| D | 0 | 19656 | 0 |
| Quadrant | Total seconds | Saturated seconds | Saturation percentage |
|---|---|---|---|
| A | 6232 | 62 | 0.994865% |
| B | 6233 | 274 | 4.395957% |
| C | 6233 | 101 | 1.620408% |
| D | 6233 | 494 | 7.925558% |
Noise dominated data is calculated using 1-second bins in cleaned event files. If a bin has >2000 counts, and if more than 50% of those come from <1% of pixels, then it is considered to be noise-dominated and hence unusable.
| Quadrant | # 1 sec bins | Bins with >0 counts | Bins with >2000 counts | High rate bins dominated by noise | Noise dominated (total time) | Noise dominated (detector-on time) | Marked lightcurve |
|---|---|---|---|---|---|---|---|
| A | 7152 | 6232 | 0 | 0 | 0.00% | 0.00% | 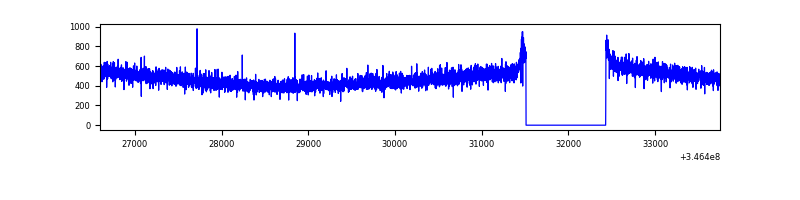 |
| B | 7153 | 6233 | 135 | 135 | 1.89% | 2.17% | 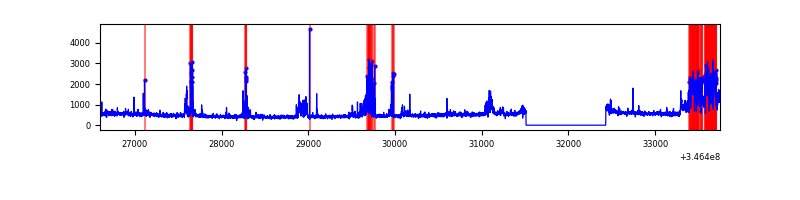 |
| C | 7153 | 6233 | 0 | 0 | 0.00% | 0.00% | 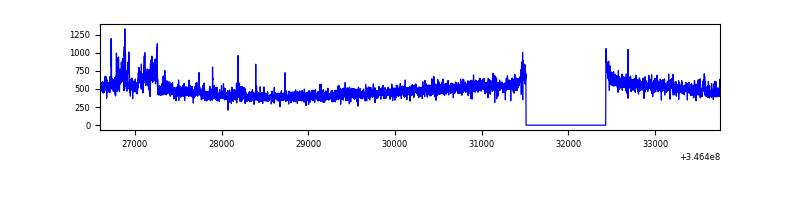 |
| D | 7153 | 6233 | 365 | 365 | 5.10% | 5.86% | 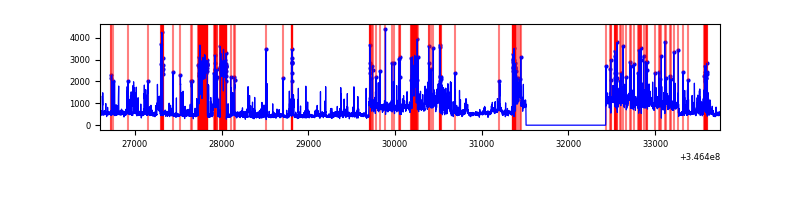 |
Top three noisy pixels from each quadrant. If the there are fewer than three noisy pixels in the level2.evt file, extra rows are filled as -1
| Pixel properties | Quadrant properties | ||||||
|---|---|---|---|---|---|---|---|
| Quadrant | DetID | PixID | Counts | Sigma | Mean | Median | Sigma |
| A | 13 | 254 | 11023 | 66.16 | 766 | 752 | 155.3 |
| A | 3 | 137 | 7638 | 44.35 | 766 | 752 | 155.3 |
| A | 0 | 226 | 6444 | 36.66 | 766 | 752 | 155.3 |
| B | 10 | 245 | 869837 | 5934.3 | 752 | 734 | 146.5 |
| B | 10 | 246 | 24536 | 162.52 | 752 | 734 | 146.5 |
| B | 12 | 111 | 18113 | 118.67 | 752 | 734 | 146.5 |
| C | 3 | 233 | 148443 | 870.5 | 723 | 726 | 169.7 |
| C | 14 | 238 | 118406 | 693.49 | 723 | 726 | 169.7 |
| C | 13 | 61 | 4949 | 24.89 | 723 | 726 | 169.7 |
| D | 8 | 195 | 935346 | 5452.94 | 714 | 695 | 171.4 |
| D | 1 | 52 | 790911 | 4610.27 | 714 | 695 | 171.4 |
| D | 7 | 238 | 623622 | 3634.28 | 714 | 695 | 171.4 |
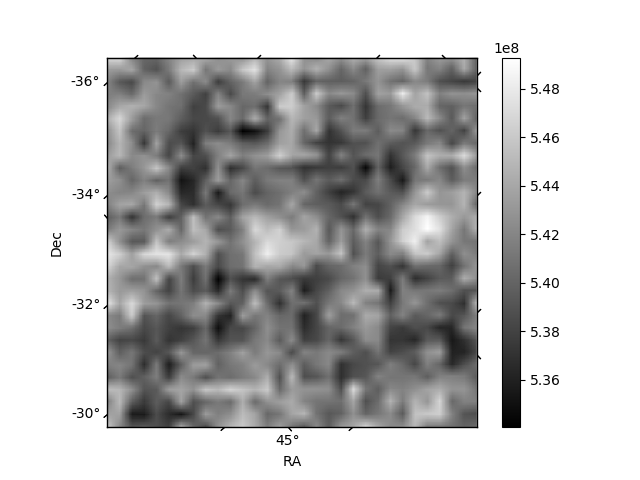
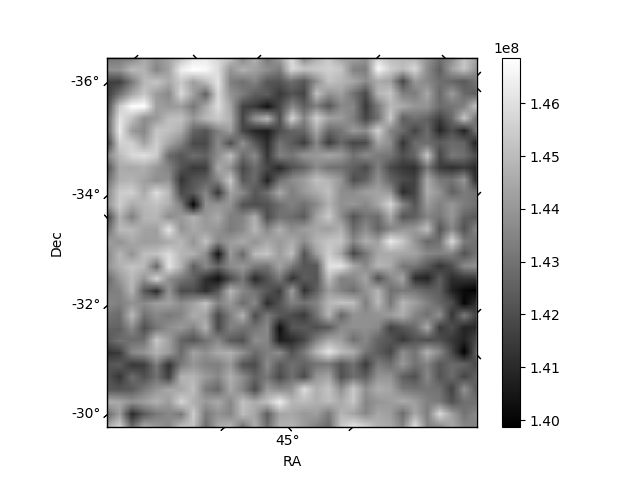
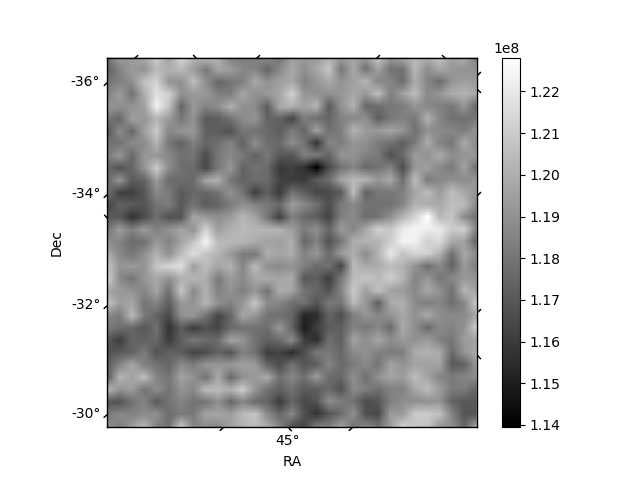
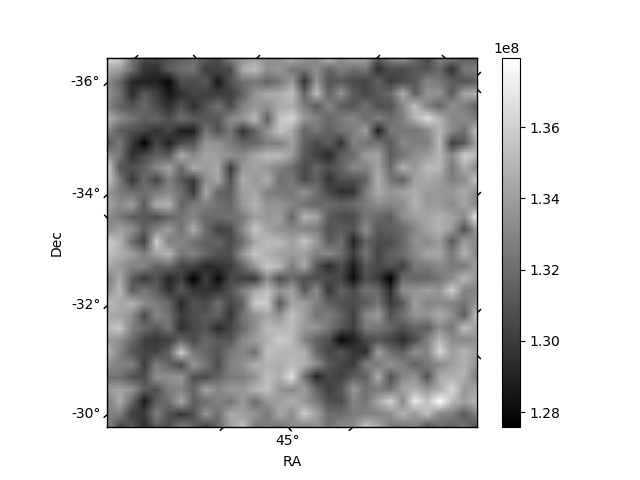
Histogram calculated using DETX and DETY for each event in the final _common_clean file
| Quadrant A | 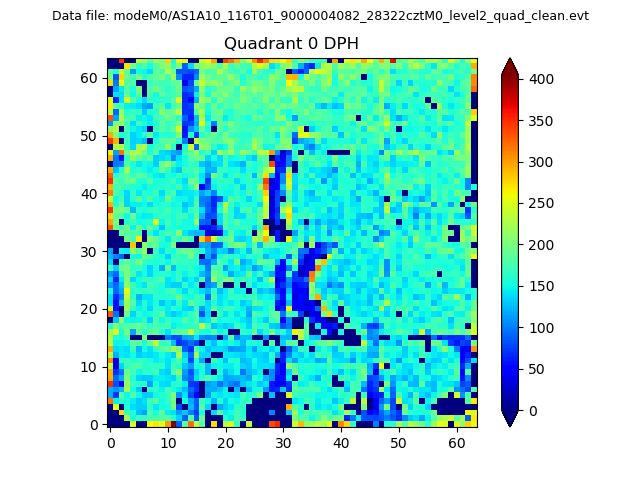 |
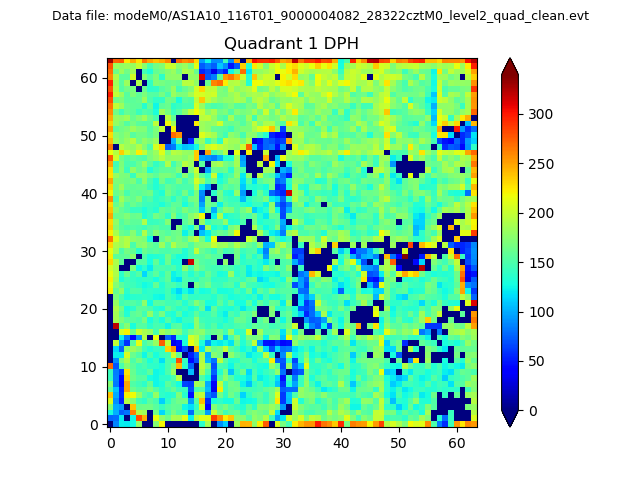 |
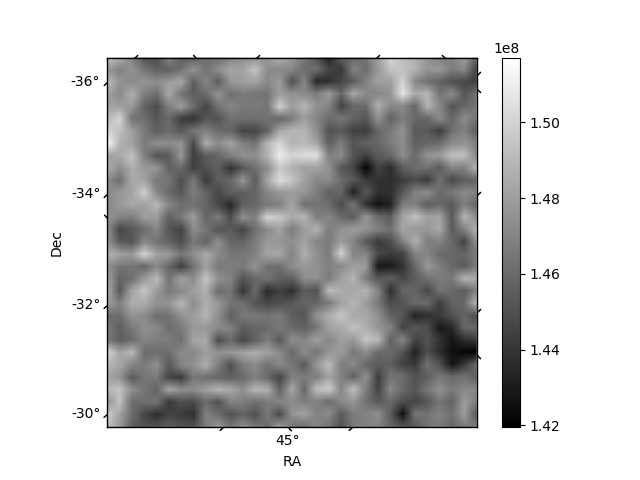
Quadrant B |
|---|---|---|---|
| Quadrant D | 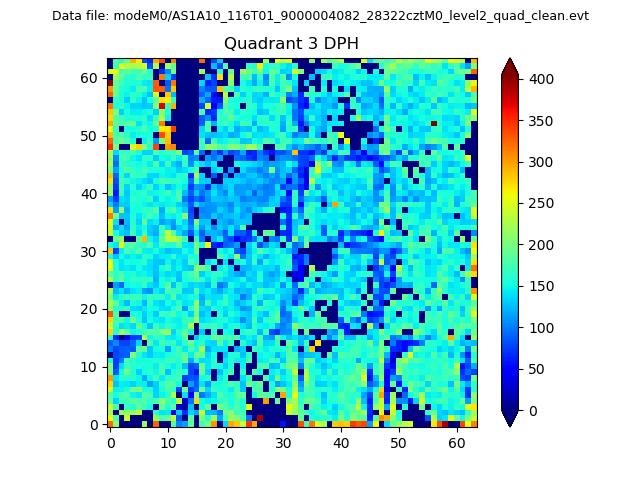 |
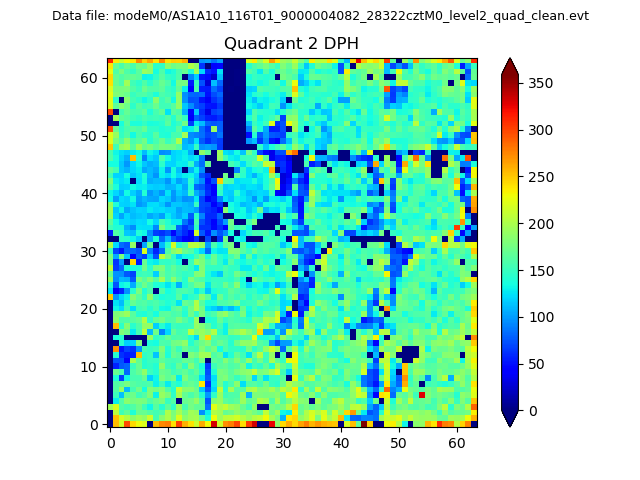 |
Quadrant C |
| Plot type | Count rate plots | Images |
|---|---|---|
| Comparison with Poisson distribution Blue bars denote a histogram of data divided into 1 sec bins. Red curve is a Poisson curve with rate = median count rate of data. |
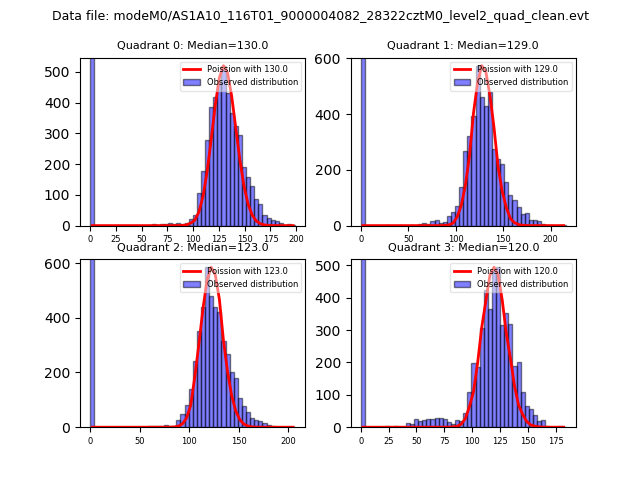 |
 |
| Quadrant-wise count rates Data is divided into 100 sec bins |
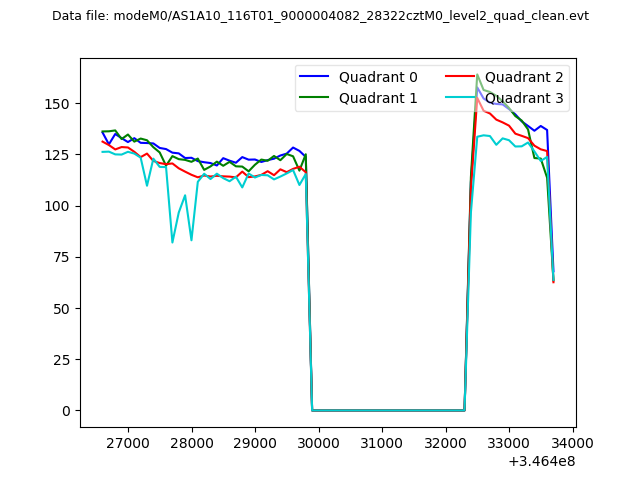 |
|
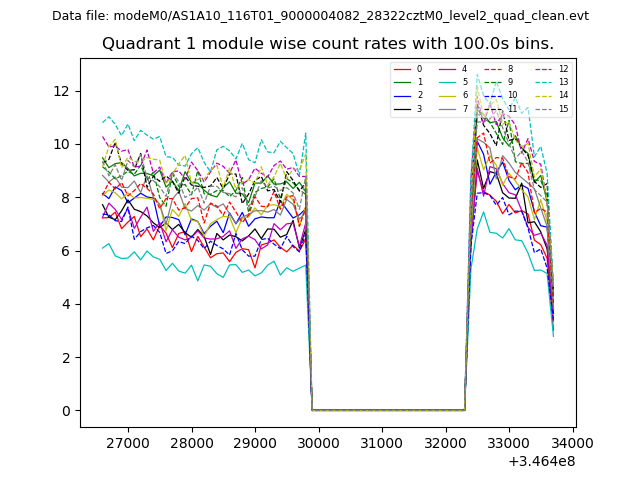
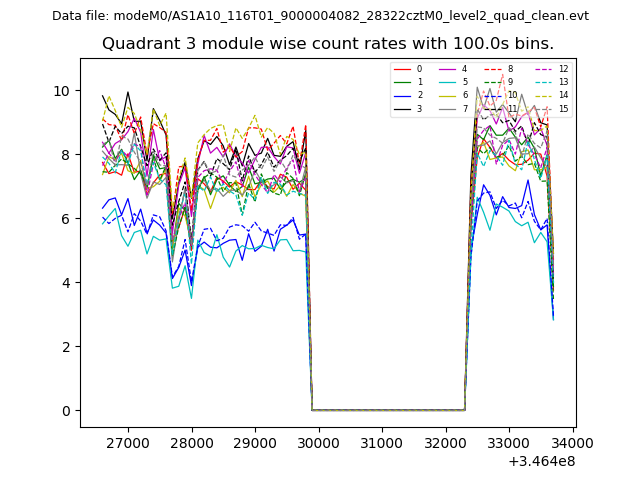
| Module-wise count rates for Quadrant A Data is divided into 100 sec bins |
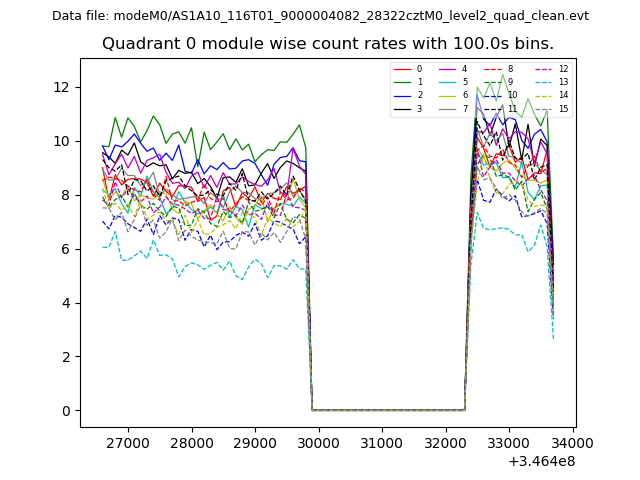 |
 |
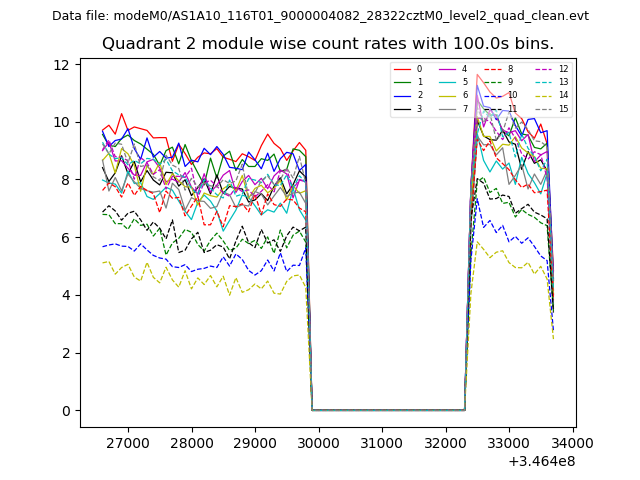
| Module-wise count rates for Quadrant B Data is divided into 100 sec bins |
 |
 |
| Module-wise count rates for Quadrant C Data is divided into 100 sec bins |
 |
 |
| Module-wise count rates for Quadrant D Data is divided into 100 sec bins |
 |
 |
| Parameter | Plot |
|---|---|
| CZT HV Monitor | 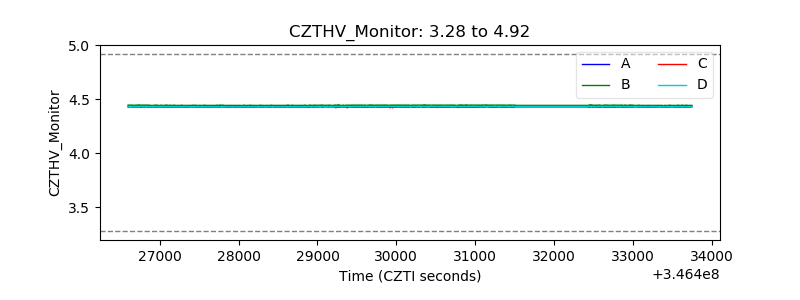 |
| D_VDD | 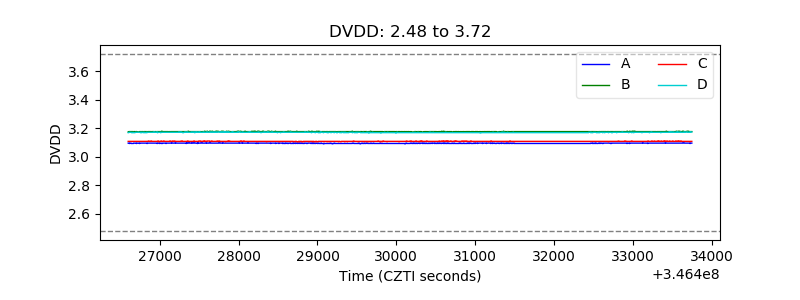 |
| Temperature 1 |  |
| Veto HV Monitor | 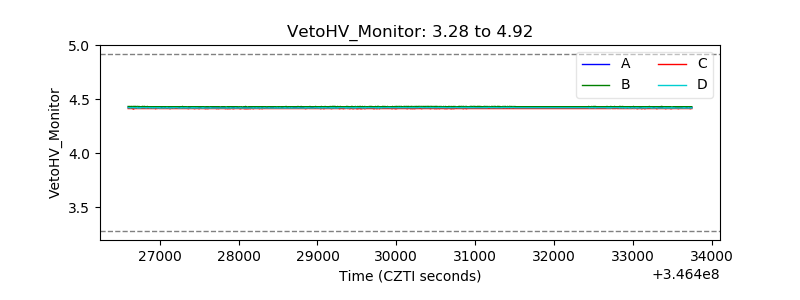 |
| Veto LLD | 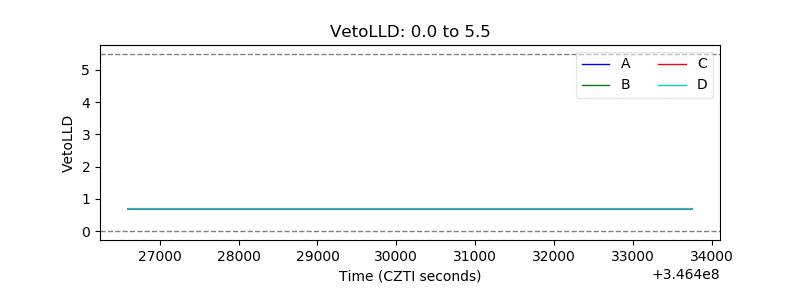 |
| Alpha Counter | 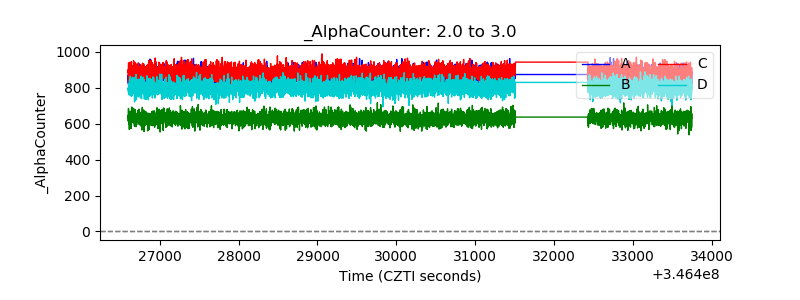 |
| _CPM_Rate | 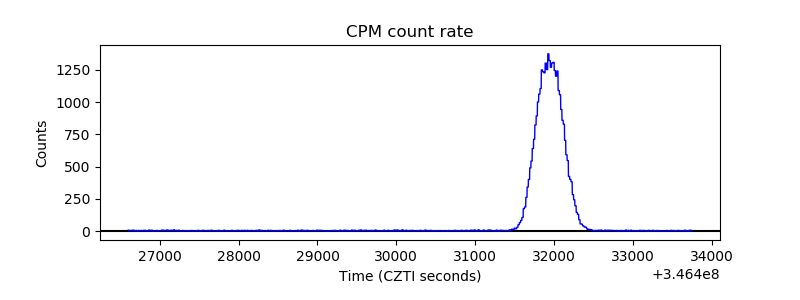 |
| CZT Counter | 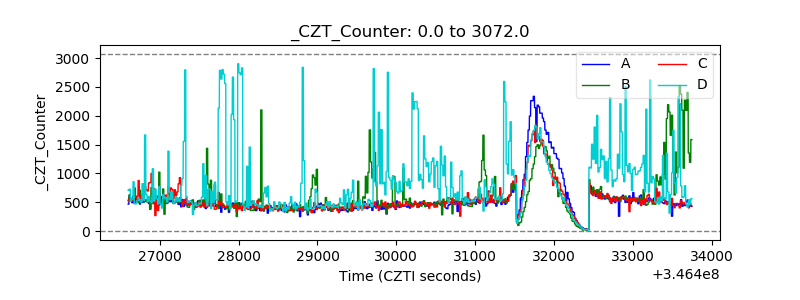 |
| +2.5 Volts monitor |  |
| +5 Volts monitor |  |
| _ROLL_ROT | 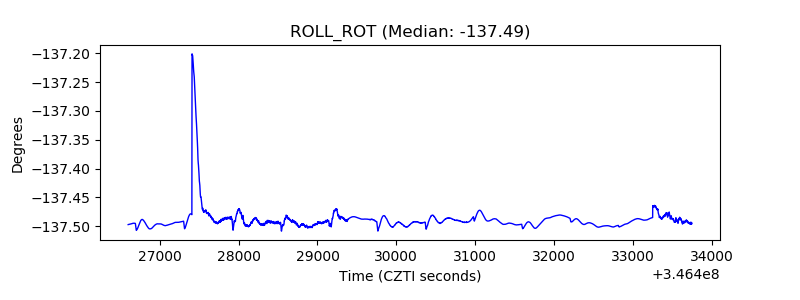 |
| _Roll_DEC | 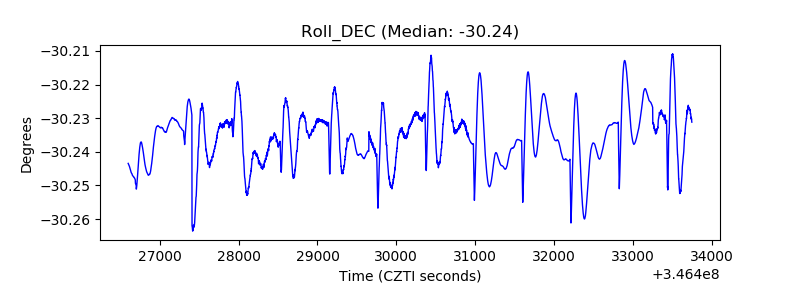 |
| _Roll_RA |  |
| Veto Counter | 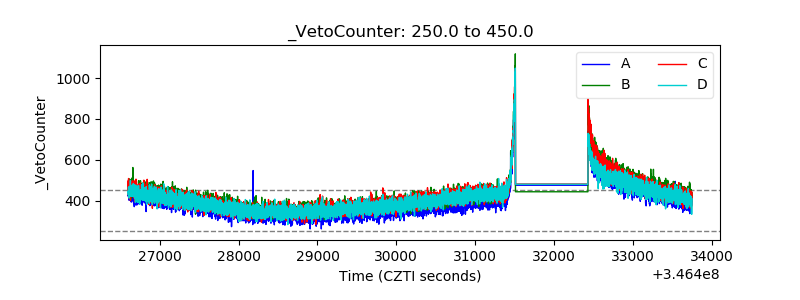 |