| Param | Original file | Final file |
|---|---|---|
| Filename | modeM0/AS1A10_116T01_9000004082_28323cztM0_level2.evt | modeM0/AS1A10_116T01_9000004082_28323cztM0_level2_quad_clean.evt |
| Size (bytes) | 560,482,560 | 92,018,880 |
| Size | 534.5 MB | 87.8 MB |
| Events in quadrant A | 3,059,848 | 616,605 |
| Events in quadrant B | 3,855,521 | 616,038 |
| Events in quadrant C | 3,331,279 | 580,301 |
| Events in quadrant D | 6,300,265 | 533,061 |
| Mode M9 | |||
|---|---|---|---|
| Quadrant | BADHDUFLAG | Total packets | Discarded packets |
| A | 0 | 11 | 0 |
| B | 0 | 11 | 0 |
| C | 0 | 11 | 0 |
| D | 0 | 11 | 0 |
| Mode M0 | |||
|---|---|---|---|
| Quadrant | BADHDUFLAG | Total packets | Discarded packets |
| A | 0 | 13198 | 0 |
| B | 0 | 15613 | 0 |
| C | 0 | 14231 | 0 |
| D | 0 | 22976 | 0 |
| Quadrant | Total seconds | Saturated seconds | Saturation percentage |
|---|---|---|---|
| A | 6310 | 53 | 0.839937% |
| B | 6311 | 235 | 3.723657% |
| C | 6311 | 114 | 1.806370% |
| D | 6310 | 633 | 10.031696% |
Noise dominated data is calculated using 1-second bins in cleaned event files. If a bin has >2000 counts, and if more than 50% of those come from <1% of pixels, then it is considered to be noise-dominated and hence unusable.
| Quadrant | # 1 sec bins | Bins with >0 counts | Bins with >2000 counts | High rate bins dominated by noise | Noise dominated (total time) | Noise dominated (detector-on time) | Marked lightcurve |
|---|---|---|---|---|---|---|---|
| A | 7380 | 6310 | 0 | 0 | 0.00% | 0.00% |  |
| B | 7381 | 6311 | 120 | 120 | 1.63% | 1.90% |  |
| C | 7381 | 6311 | 5 | 5 | 0.07% | 0.08% |  |
| D | 7380 | 6311 | 609 | 609 | 8.25% | 9.65% |  |
Top three noisy pixels from each quadrant. If the there are fewer than three noisy pixels in the level2.evt file, extra rows are filled as -1
| Pixel properties | Quadrant properties | ||||||
|---|---|---|---|---|---|---|---|
| Quadrant | DetID | PixID | Counts | Sigma | Mean | Median | Sigma |
| A | 13 | 254 | 10836 | 63.28 | 792 | 777 | 159.0 |
| A | 3 | 137 | 7834 | 44.4 | 792 | 777 | 159.0 |
| A | 0 | 226 | 6772 | 37.71 | 792 | 777 | 159.0 |
| B | 10 | 245 | 654876 | 4325.92 | 784 | 766 | 151.2 |
| B | 10 | 246 | 73232 | 479.25 | 784 | 766 | 151.2 |
| B | 12 | 111 | 18423 | 116.77 | 784 | 766 | 151.2 |
| C | 3 | 233 | 258478 | 1459.54 | 748 | 751 | 176.6 |
| C | 14 | 238 | 122375 | 688.77 | 748 | 751 | 176.6 |
| C | 2 | 16 | 38611 | 214.41 | 748 | 751 | 176.6 |
| D | 1 | 52 | 2444975 | 14184.22 | 728 | 708 | 172.3 |
| D | 8 | 195 | 857809 | 4973.81 | 728 | 708 | 172.3 |
| D | 7 | 238 | 66060 | 379.24 | 728 | 708 | 172.3 |
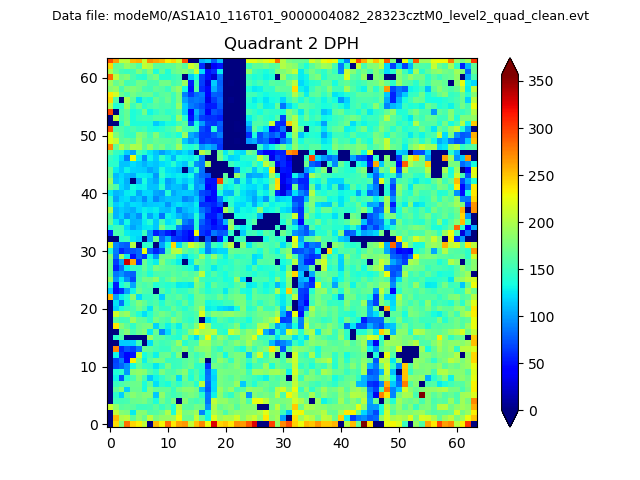
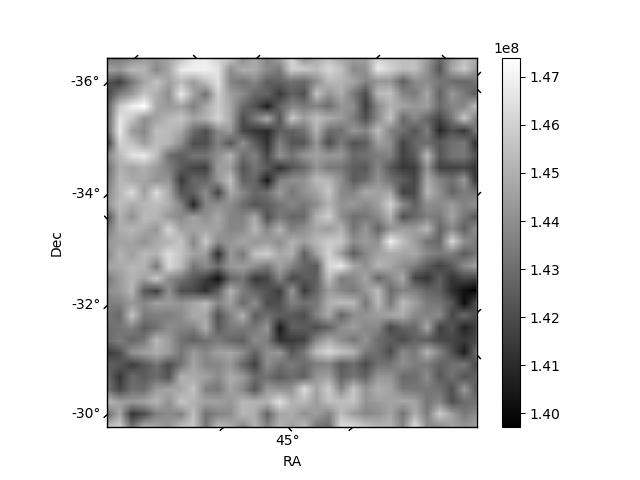
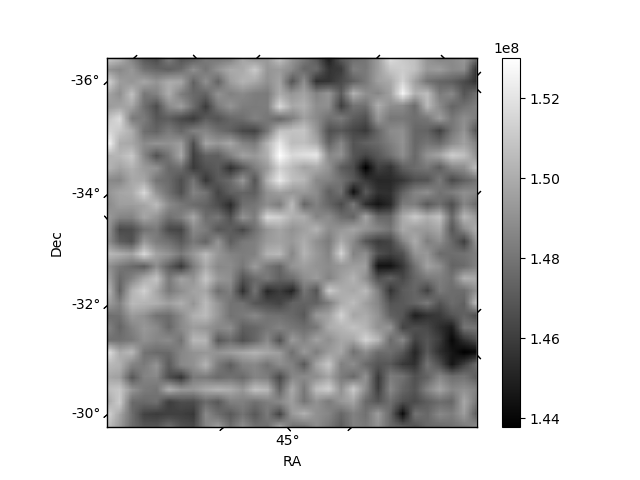
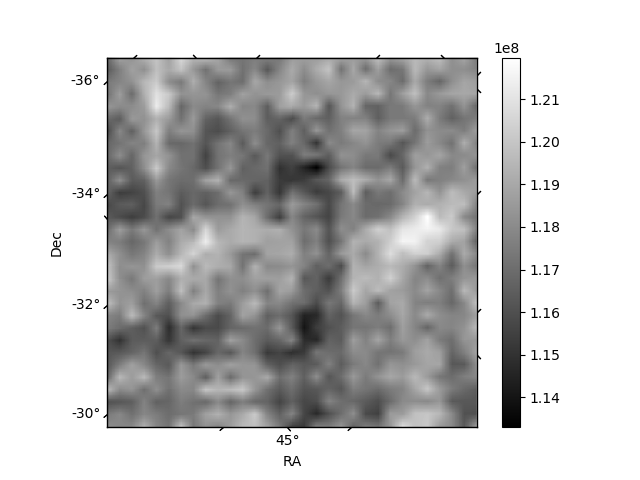
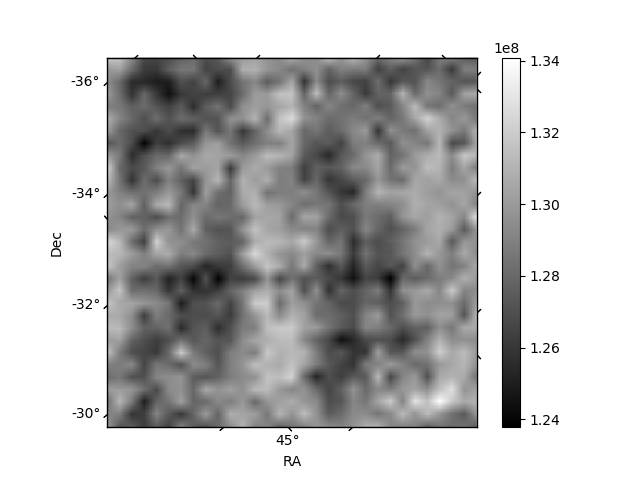
Histogram calculated using DETX and DETY for each event in the final _common_clean file
| Quadrant A | 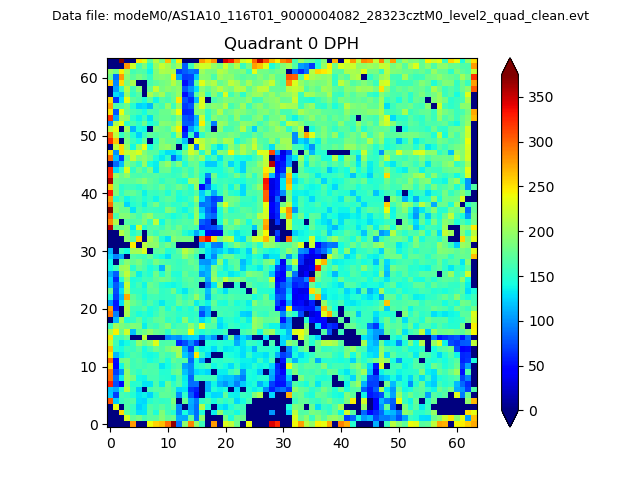 |
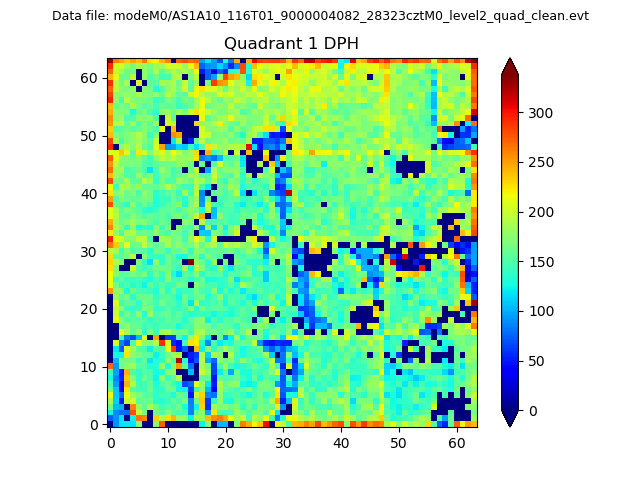 |
Quadrant B |
|---|---|---|---|
| Quadrant D | 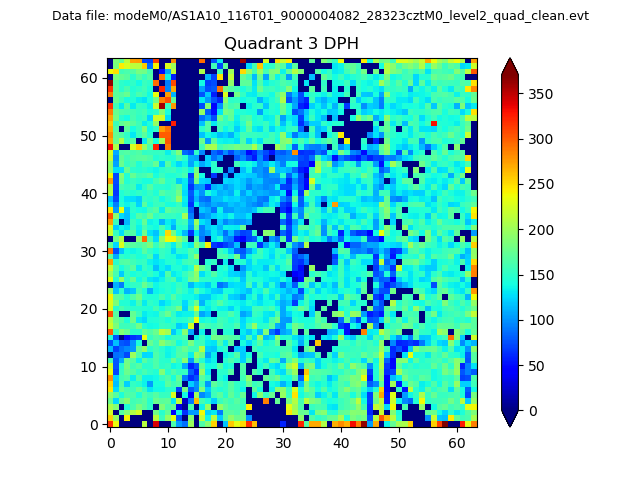 |
 |
Quadrant C |
| Plot type | Count rate plots | Images |
|---|---|---|
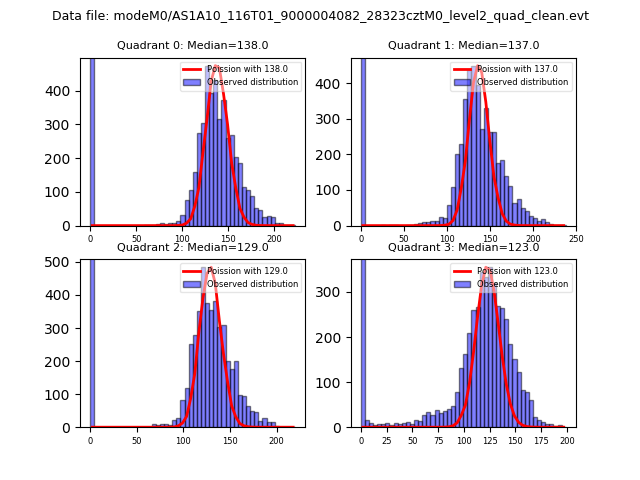
| Comparison with Poisson distribution Blue bars denote a histogram of data divided into 1 sec bins. Red curve is a Poisson curve with rate = median count rate of data. |
 |
 |
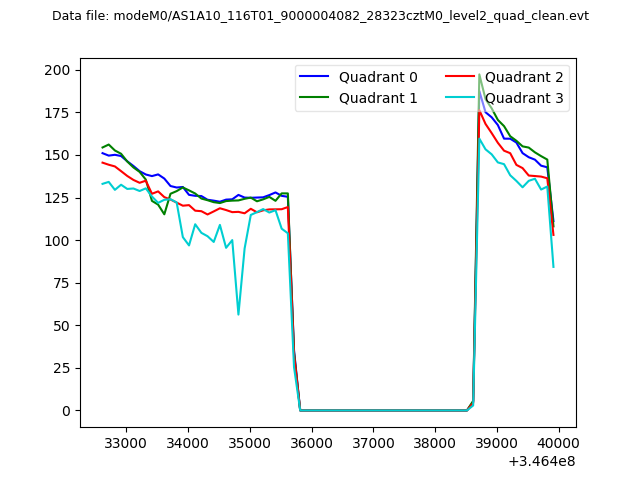
| Quadrant-wise count rates Data is divided into 100 sec bins |
 |
|
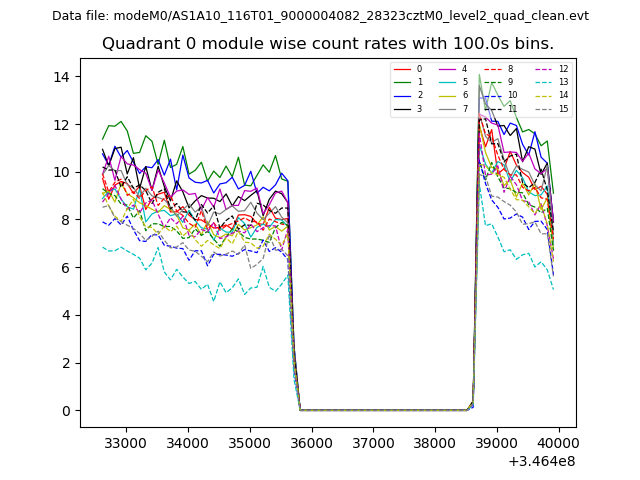
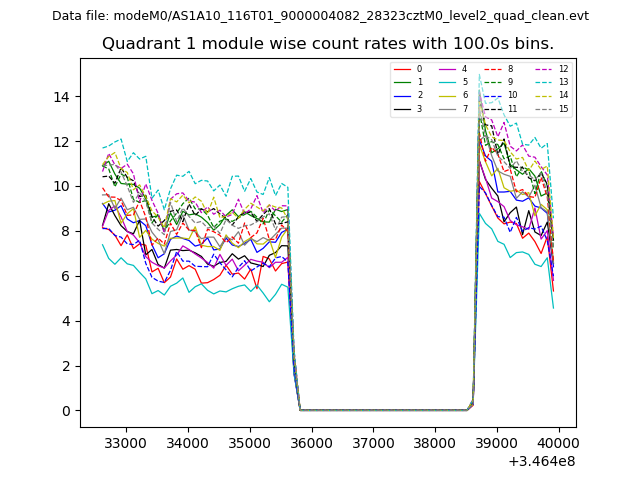
| Module-wise count rates for Quadrant A Data is divided into 100 sec bins |
 |
 |
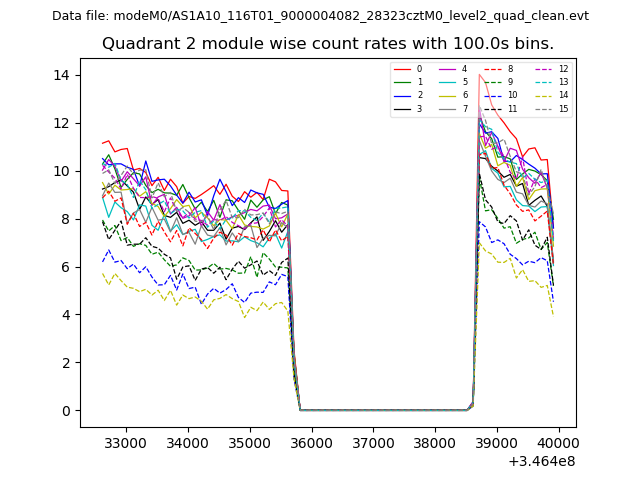
| Module-wise count rates for Quadrant B Data is divided into 100 sec bins |
 |
 |
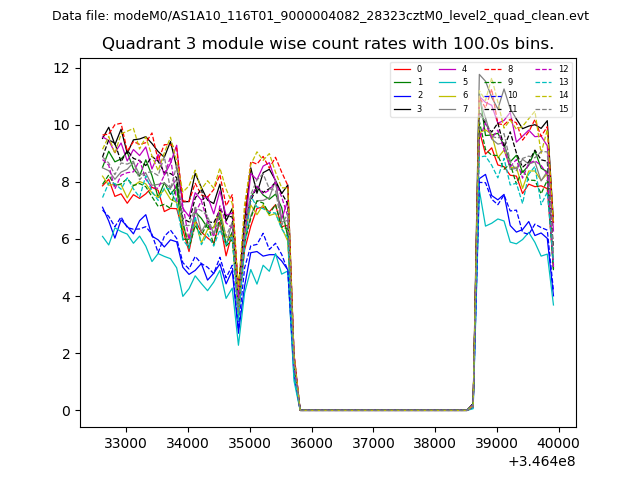
| Module-wise count rates for Quadrant C Data is divided into 100 sec bins |
 |
 |
| Module-wise count rates for Quadrant D Data is divided into 100 sec bins |
 |
 |
| Parameter | Plot |
|---|---|
| CZT HV Monitor | 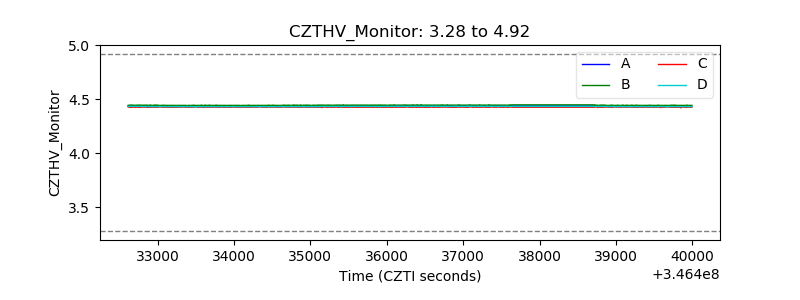 |
| D_VDD | 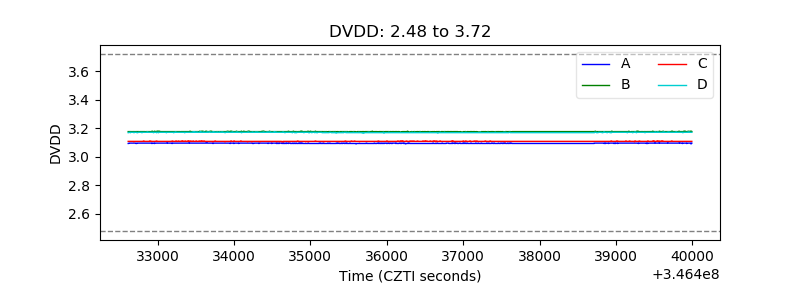 |
| Temperature 1 | 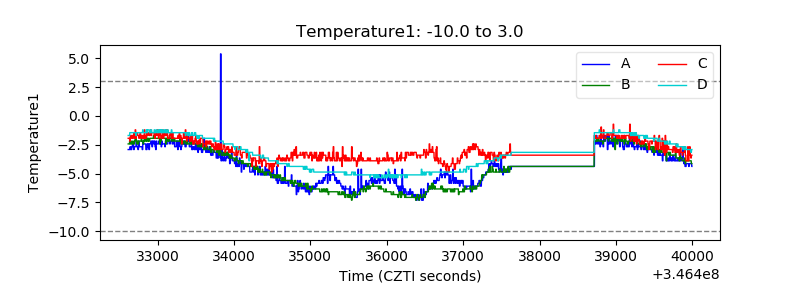 |
| Veto HV Monitor | 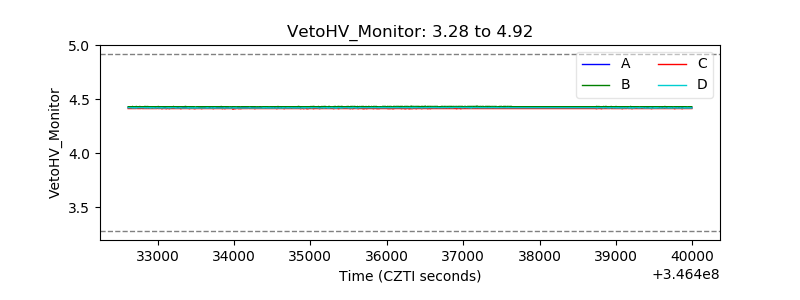 |
| Veto LLD | 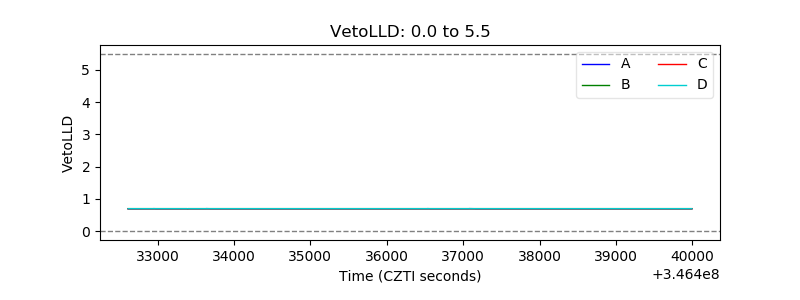 |
| Alpha Counter | 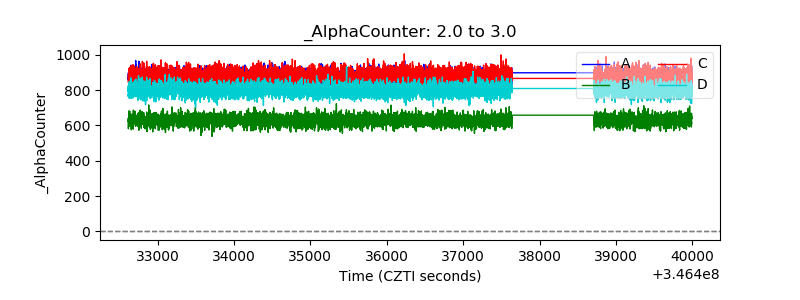 |
| _CPM_Rate | 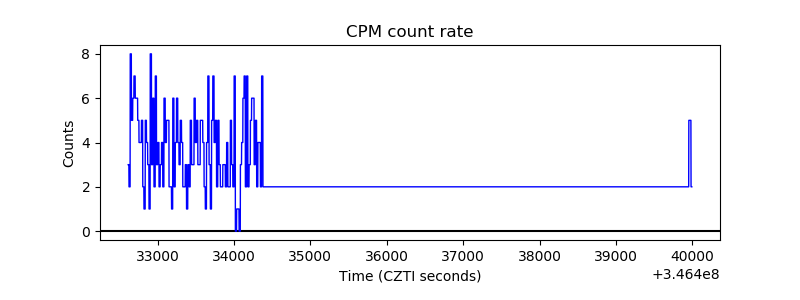 |
| CZT Counter | 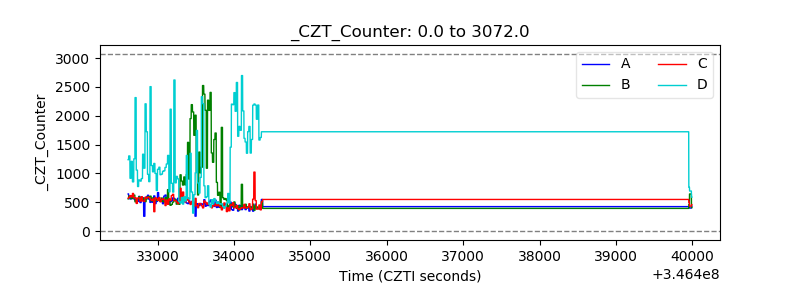 |
| +2.5 Volts monitor | 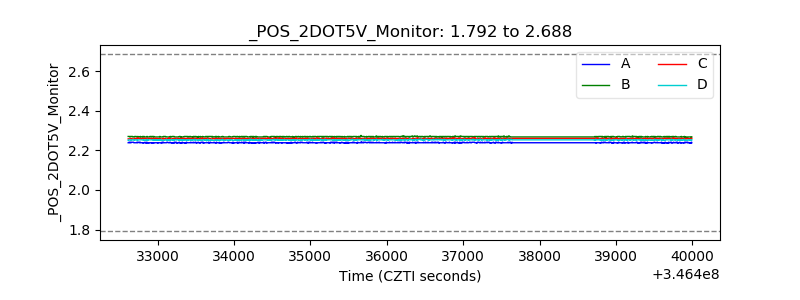 |
| +5 Volts monitor | 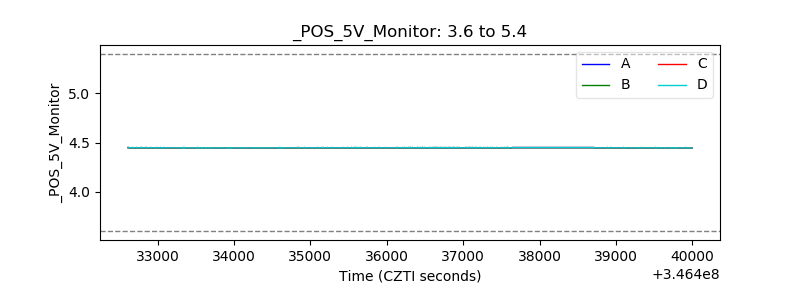 |
| _ROLL_ROT | 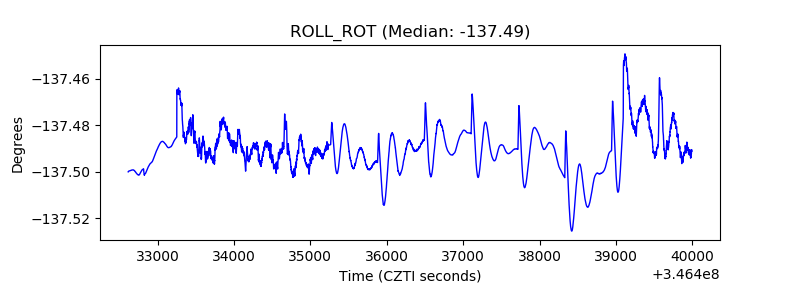 |
| _Roll_DEC |  |
| _Roll_RA | 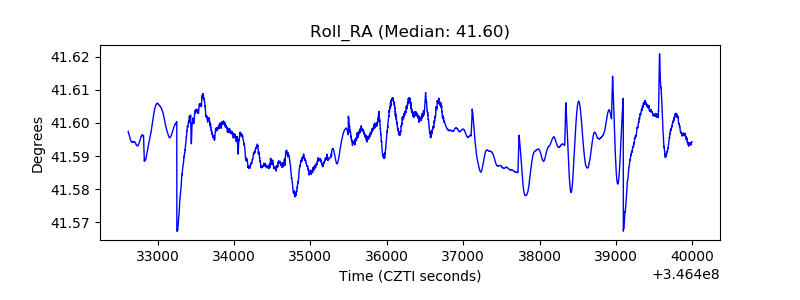 |
| Veto Counter | 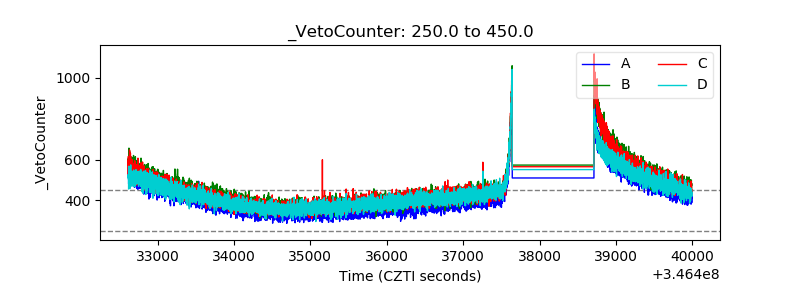 |