| Param | Original file | Final file |
|---|---|---|
| Filename | modeM0/AS1A10_116T01_9000004082_28325cztM0_level2.evt | modeM0/AS1A10_116T01_9000004082_28325cztM0_level2_quad_clean.evt |
| Size (bytes) | 548,277,120 | 101,646,720 |
| Size | 522.9 MB | 96.9 MB |
| Events in quadrant A | 3,335,499 | 676,560 |
| Events in quadrant B | 3,719,204 | 693,460 |
| Events in quadrant C | 3,993,819 | 637,939 |
| Events in quadrant D | 5,103,958 | 605,193 |
| Mode M9 | |||
|---|---|---|---|
| Quadrant | BADHDUFLAG | Total packets | Discarded packets |
| A | 0 | 13 | 0 |
| B | 0 | 14 | 0 |
| C | 0 | 14 | 0 |
| D | 0 | 14 | 0 |
| Mode M0 | |||
|---|---|---|---|
| Quadrant | BADHDUFLAG | Total packets | Discarded packets |
| A | 0 | 14258 | 0 |
| B | 0 | 15262 | 0 |
| C | 0 | 16475 | 0 |
| D | 0 | 19707 | 0 |
| Quadrant | Total seconds | Saturated seconds | Saturation percentage |
|---|---|---|---|
| A | 6671 | 58 | 0.869435% |
| B | 6671 | 137 | 2.053665% |
| C | 6671 | 123 | 1.843802% |
| D | 6670 | 220 | 3.298351% |
Noise dominated data is calculated using 1-second bins in cleaned event files. If a bin has >2000 counts, and if more than 50% of those come from <1% of pixels, then it is considered to be noise-dominated and hence unusable.
| Quadrant | # 1 sec bins | Bins with >0 counts | Bins with >2000 counts | High rate bins dominated by noise | Noise dominated (total time) | Noise dominated (detector-on time) | Marked lightcurve |
|---|---|---|---|---|---|---|---|
| A | 7856 | 6672 | 0 | 0 | 0.00% | 0.00% |  |
| B | 7856 | 6672 | 36 | 36 | 0.46% | 0.54% |  |
| C | 7856 | 6672 | 6 | 6 | 0.08% | 0.09% |  |
| D | 7855 | 6671 | 150 | 150 | 1.91% | 2.25% |  |
Top three noisy pixels from each quadrant. If the there are fewer than three noisy pixels in the level2.evt file, extra rows are filled as -1
| Pixel properties | Quadrant properties | ||||||
|---|---|---|---|---|---|---|---|
| Quadrant | DetID | PixID | Counts | Sigma | Mean | Median | Sigma |
| A | 13 | 254 | 11973 | 64.76 | 863 | 847 | 171.8 |
| A | 3 | 137 | 8065 | 42.01 | 863 | 847 | 171.8 |
| A | 0 | 226 | 7609 | 39.36 | 863 | 847 | 171.8 |
| B | 10 | 245 | 243220 | 1495.25 | 859 | 839 | 162.1 |
| B | 10 | 246 | 55845 | 339.33 | 859 | 839 | 162.1 |
| B | 0 | 230 | 23907 | 142.3 | 859 | 839 | 162.1 |
| C | 3 | 233 | 677051 | 3582.88 | 816 | 823 | 188.7 |
| C | 14 | 238 | 135037 | 711.11 | 816 | 823 | 188.7 |
| C | 13 | 61 | 5386 | 24.18 | 816 | 823 | 188.7 |
| D | 1 | 52 | 1195761 | 6223.69 | 811 | 790 | 192.0 |
| D | 8 | 195 | 609200 | 3168.74 | 811 | 790 | 192.0 |
| D | 2 | 250 | 132698 | 687.01 | 811 | 790 | 192.0 |
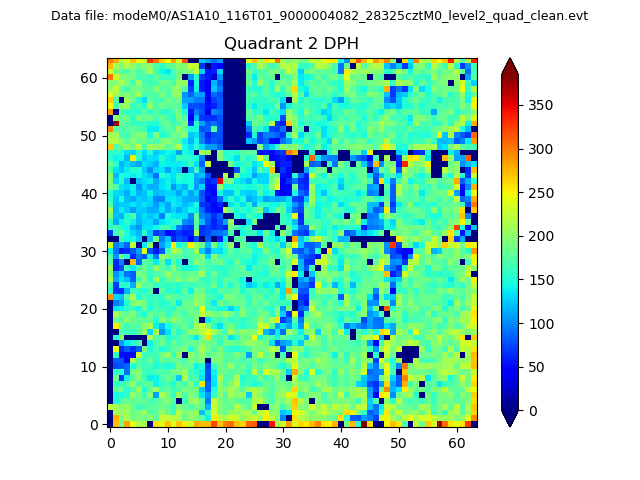
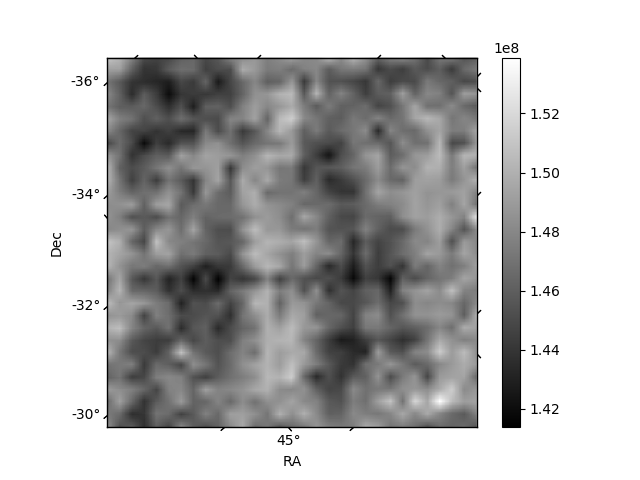
Histogram calculated using DETX and DETY for each event in the final _common_clean file
| Quadrant A | 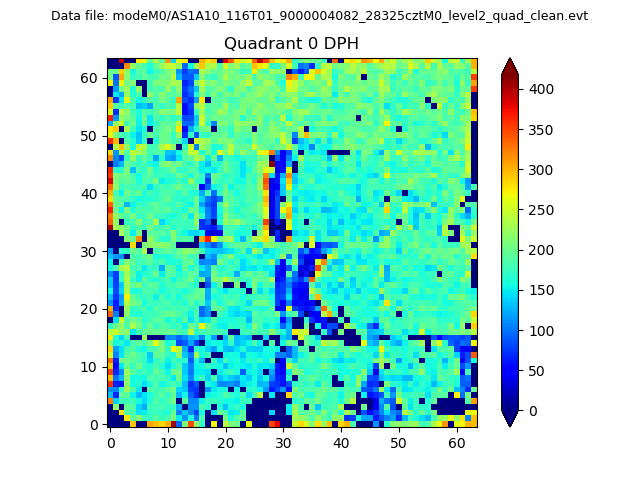 |
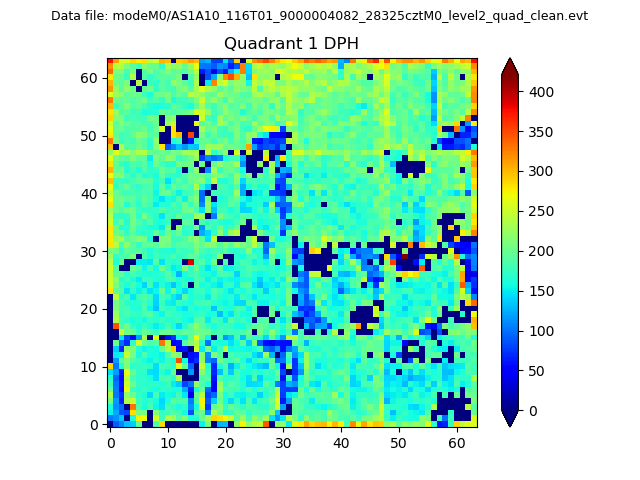 |
Quadrant B |
|---|---|---|---|
| Quadrant D | 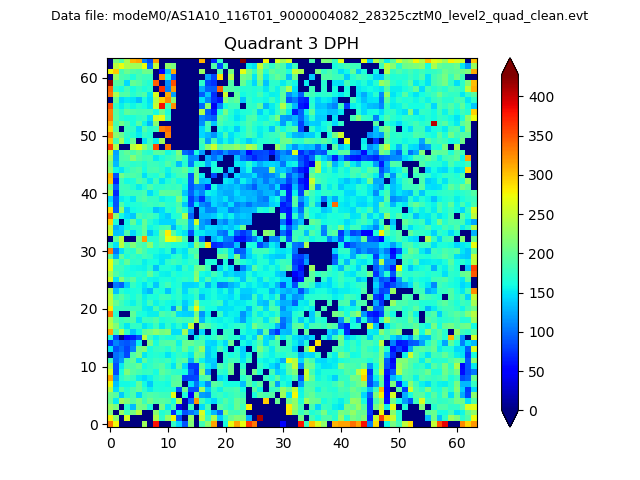 |
 |
Quadrant C |
| Plot type | Count rate plots | Images |
|---|---|---|
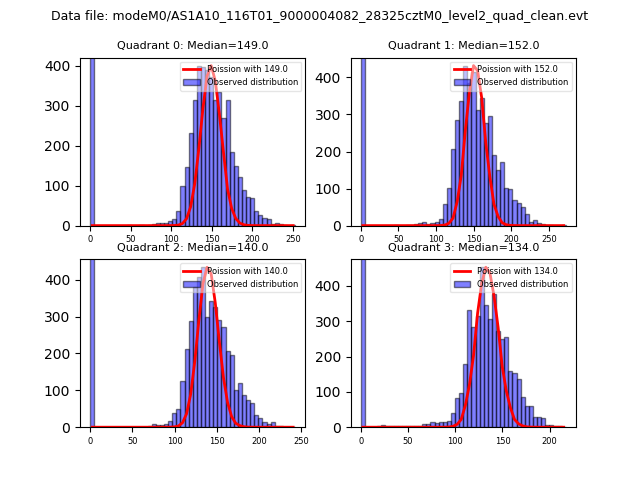
| Comparison with Poisson distribution Blue bars denote a histogram of data divided into 1 sec bins. Red curve is a Poisson curve with rate = median count rate of data. |
 |
 |
| Quadrant-wise count rates Data is divided into 100 sec bins |
 |
|
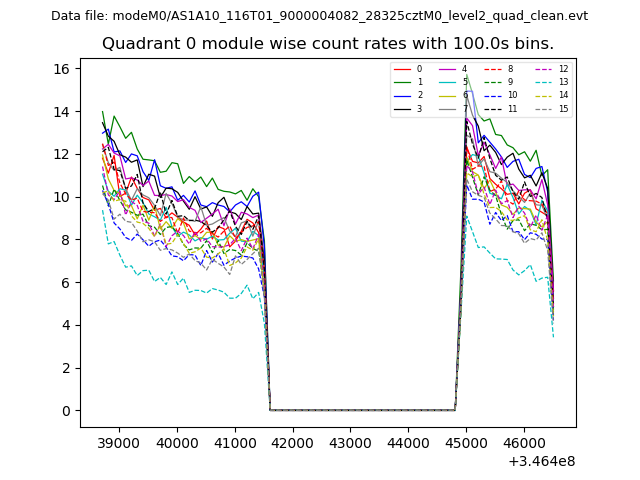
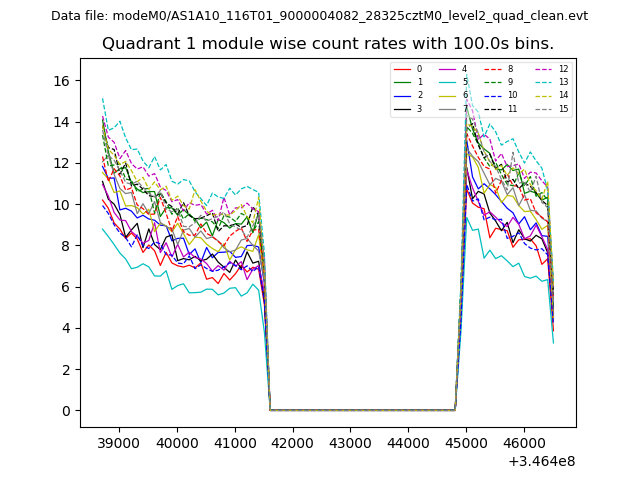
| Module-wise count rates for Quadrant A Data is divided into 100 sec bins |
 |
 |
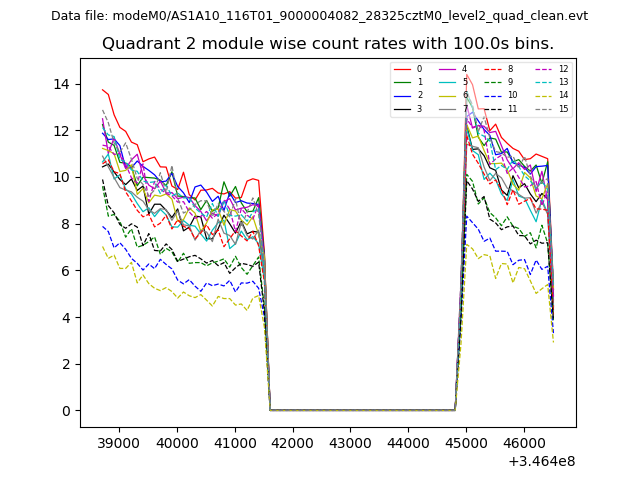
| Module-wise count rates for Quadrant B Data is divided into 100 sec bins |
 |
 |
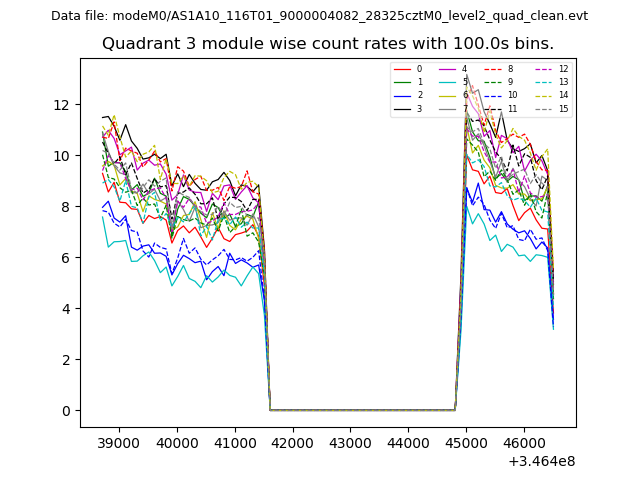
| Module-wise count rates for Quadrant C Data is divided into 100 sec bins |
 |
 |
| Module-wise count rates for Quadrant D Data is divided into 100 sec bins |
 |
 |
| Parameter | Plot |
|---|---|
| CZT HV Monitor | 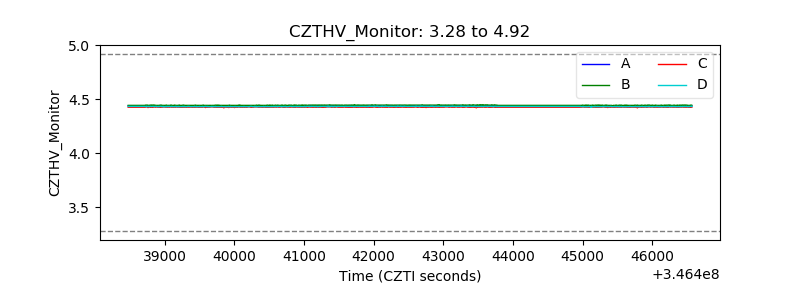 |
| D_VDD | 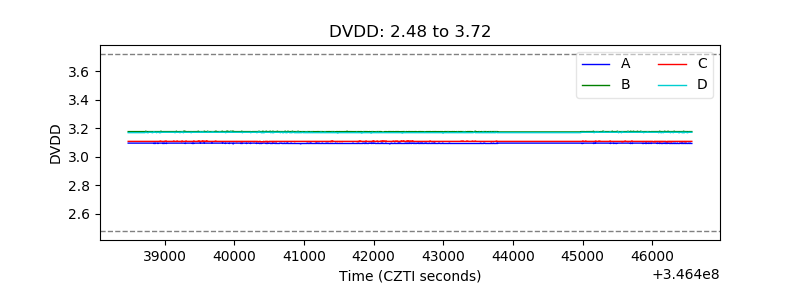 |
| Temperature 1 | 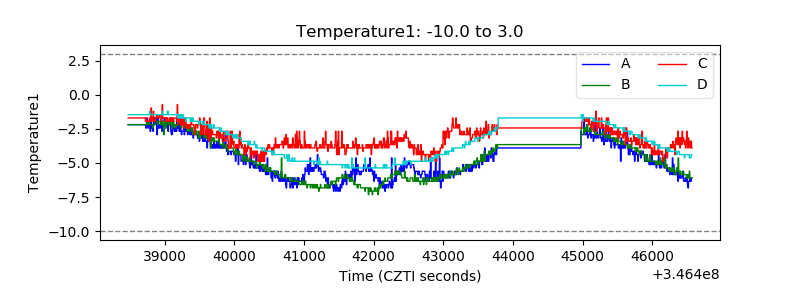 |
| Veto HV Monitor | 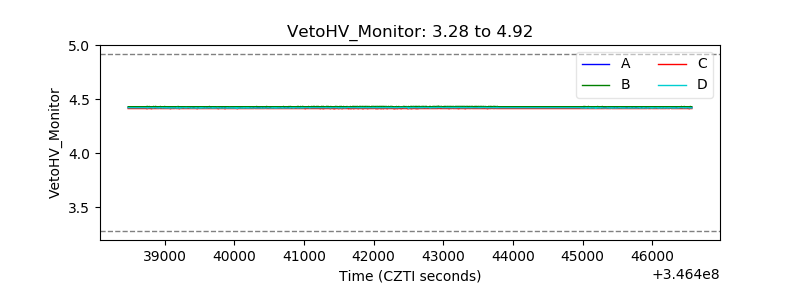 |
| Veto LLD | 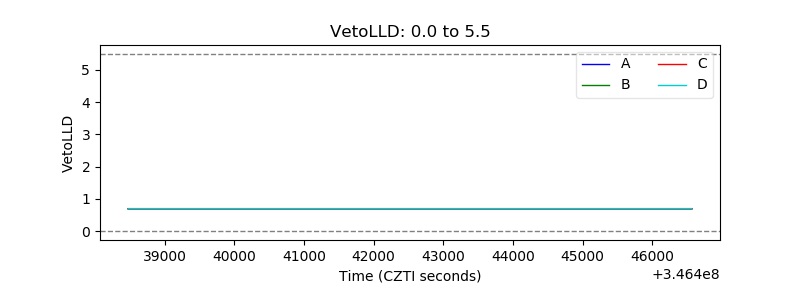 |
| Alpha Counter |  |
| _CPM_Rate | 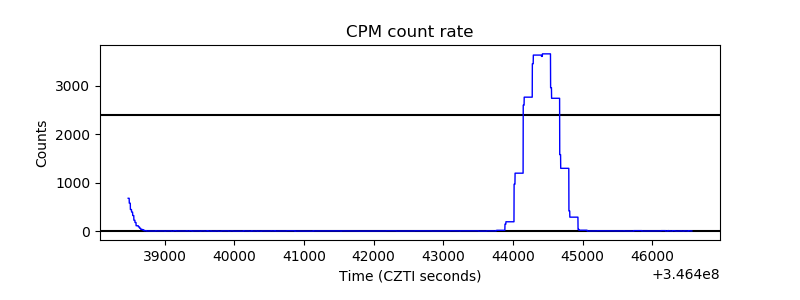 |
| CZT Counter |  |
| +2.5 Volts monitor |  |
| +5 Volts monitor |  |
| _ROLL_ROT | 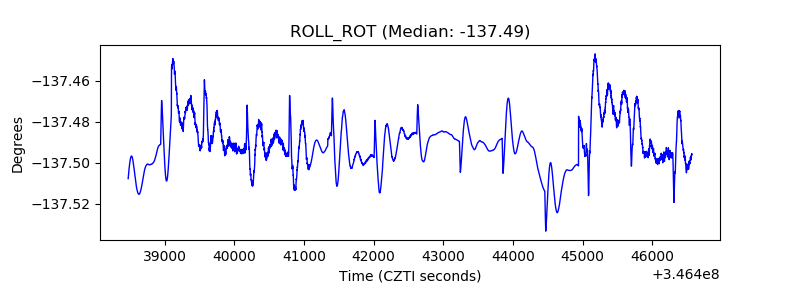 |
| _Roll_DEC | 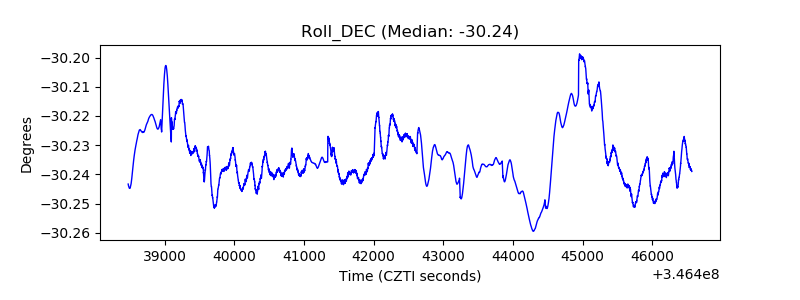 |
| _Roll_RA | 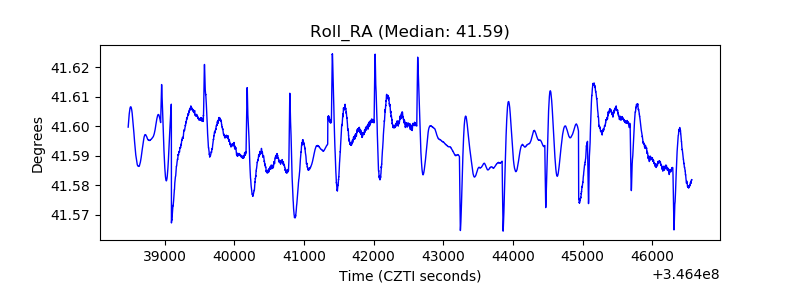 |
| Veto Counter | 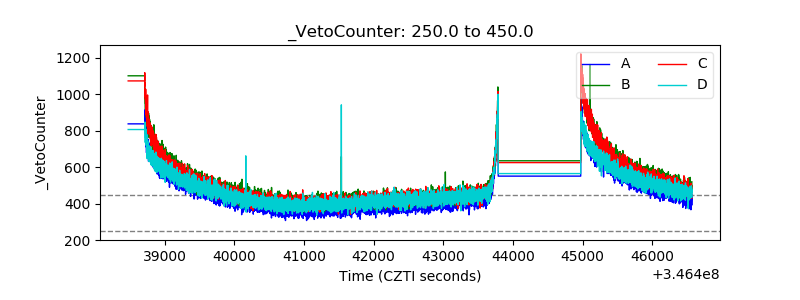 |