| Param | Original file | Final file |
|---|---|---|
| Filename | modeM0/AS1A10_116T01_9000004082_28326cztM0_level2.evt | modeM0/AS1A10_116T01_9000004082_28326cztM0_level2_quad_clean.evt |
| Size (bytes) | 534,188,160 | 99,881,280 |
| Size | 509.4 MB | 95.3 MB |
| Events in quadrant A | 3,260,119 | 662,612 |
| Events in quadrant B | 4,206,912 | 678,399 |
| Events in quadrant C | 3,877,680 | 635,871 |
| Events in quadrant D | 4,403,614 | 605,483 |
| Mode M9 | |||
|---|---|---|---|
| Quadrant | BADHDUFLAG | Total packets | Discarded packets |
| A | 0 | 19 | 0 |
| B | 0 | 19 | 0 |
| C | 0 | 20 | 0 |
| D | 0 | 20 | 0 |
| Mode M0 | |||
|---|---|---|---|
| Quadrant | BADHDUFLAG | Total packets | Discarded packets |
| A | 0 | 13662 | 0 |
| B | 0 | 16481 | 0 |
| C | 0 | 15801 | 0 |
| D | 0 | 17318 | 0 |
| Quadrant | Total seconds | Saturated seconds | Saturation percentage |
|---|---|---|---|
| A | 6336 | 61 | 0.962753% |
| B | 6336 | 244 | 3.851010% |
| C | 6336 | 117 | 1.846591% |
| D | 6336 | 112 | 1.767677% |
Noise dominated data is calculated using 1-second bins in cleaned event files. If a bin has >2000 counts, and if more than 50% of those come from <1% of pixels, then it is considered to be noise-dominated and hence unusable.
| Quadrant | # 1 sec bins | Bins with >0 counts | Bins with >2000 counts | High rate bins dominated by noise | Noise dominated (total time) | Noise dominated (detector-on time) | Marked lightcurve |
|---|---|---|---|---|---|---|---|
| A | 7616 | 6337 | 0 | 0 | 0.00% | 0.00% | 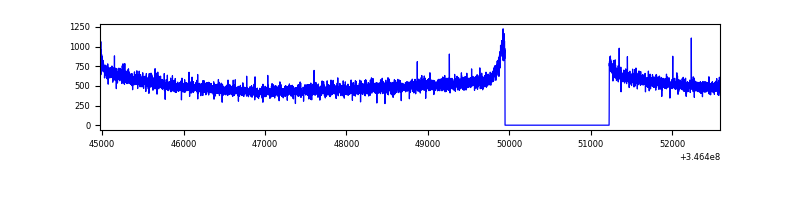 |
| B | 7616 | 6336 | 130 | 130 | 1.71% | 2.05% | 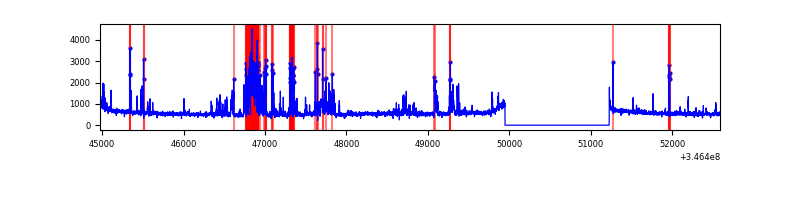 |
| C | 7616 | 6337 | 0 | 0 | 0.00% | 0.00% | 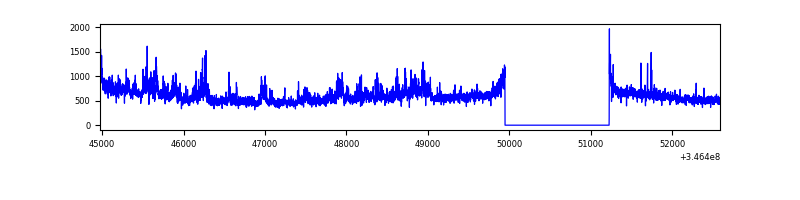 |
| D | 7616 | 6337 | 59 | 59 | 0.77% | 0.93% | 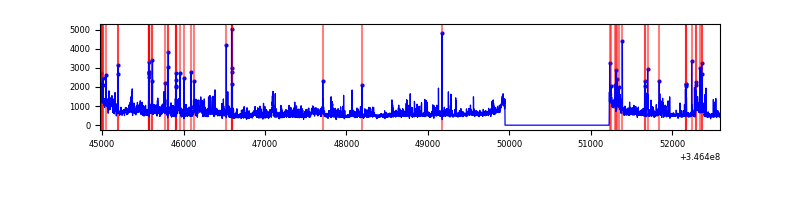 |
Top three noisy pixels from each quadrant. If the there are fewer than three noisy pixels in the level2.evt file, extra rows are filled as -1
| Pixel properties | Quadrant properties | ||||||
|---|---|---|---|---|---|---|---|
| Quadrant | DetID | PixID | Counts | Sigma | Mean | Median | Sigma |
| A | 13 | 254 | 10958 | 60.38 | 844 | 829 | 167.8 |
| A | 3 | 137 | 7834 | 41.76 | 844 | 829 | 167.8 |
| A | 0 | 226 | 7108 | 37.43 | 844 | 829 | 167.8 |
| B | 10 | 245 | 842341 | 5291.83 | 842 | 823 | 159.0 |
| B | 10 | 246 | 31579 | 193.41 | 842 | 823 | 159.0 |
| B | 0 | 230 | 26587 | 162.02 | 842 | 823 | 159.0 |
| C | 3 | 233 | 594770 | 3173.63 | 807 | 815 | 187.2 |
| C | 14 | 238 | 133050 | 706.56 | 807 | 815 | 187.2 |
| C | 13 | 61 | 5500 | 25.03 | 807 | 815 | 187.2 |
| D | 1 | 52 | 966312 | 5085.4 | 800 | 780 | 189.9 |
| D | 8 | 195 | 298776 | 1569.53 | 800 | 780 | 189.9 |
| D | 13 | 168 | 47122 | 244.08 | 800 | 780 | 189.9 |
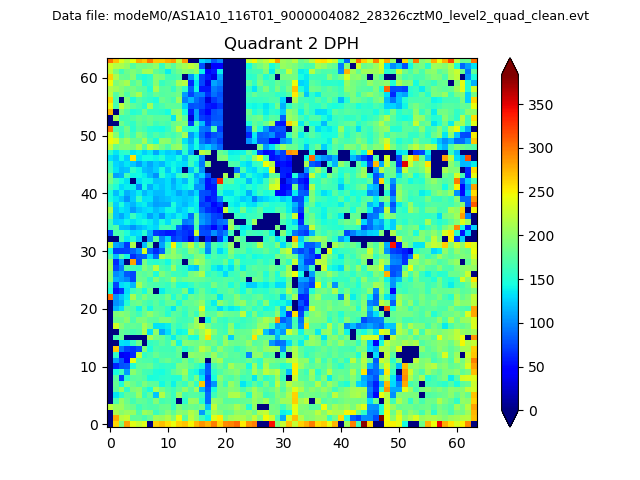
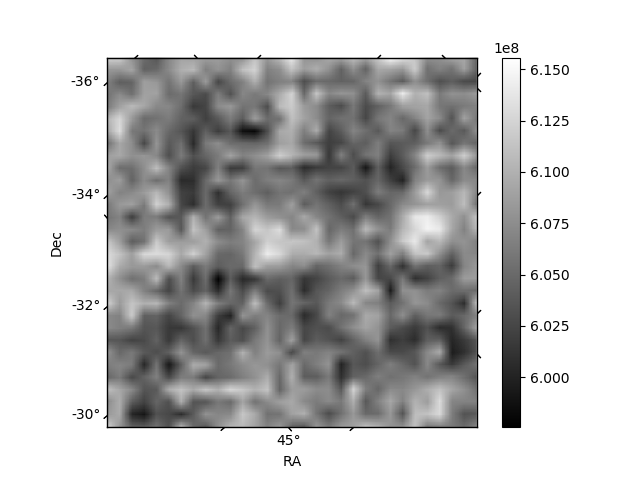
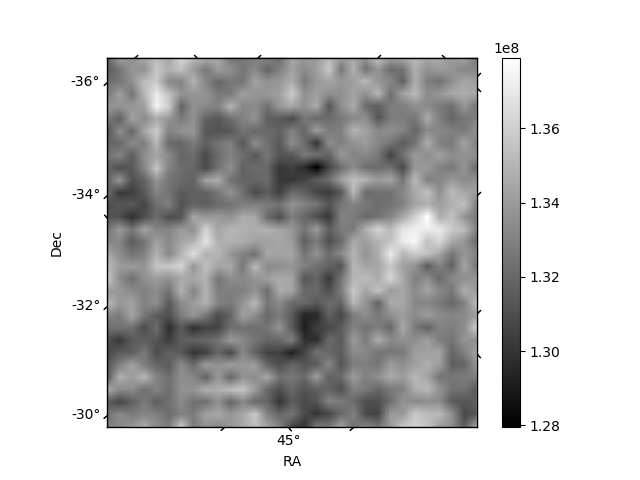
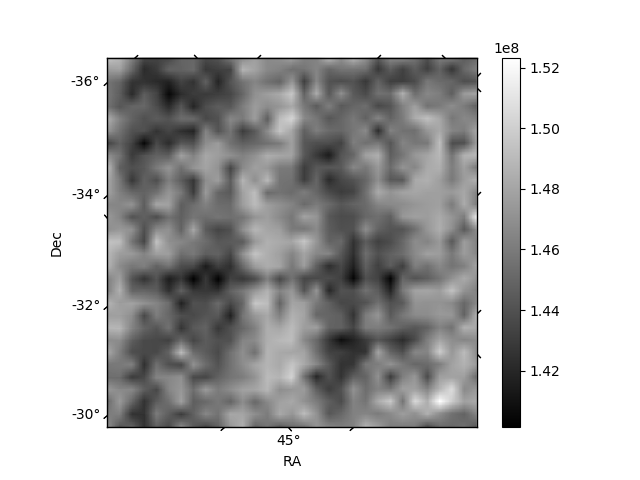
Histogram calculated using DETX and DETY for each event in the final _common_clean file
| Quadrant A | 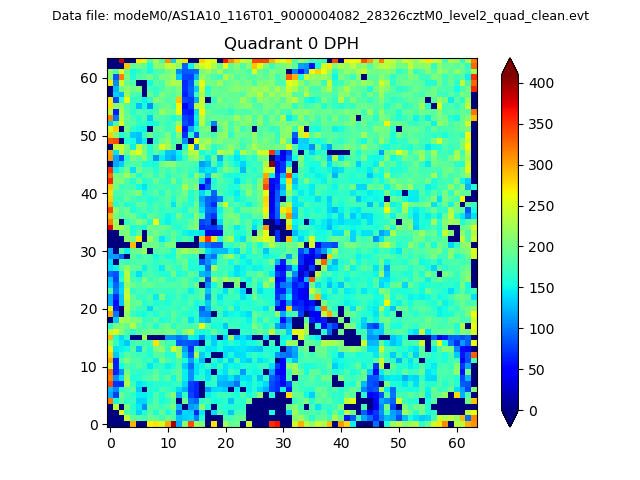 |
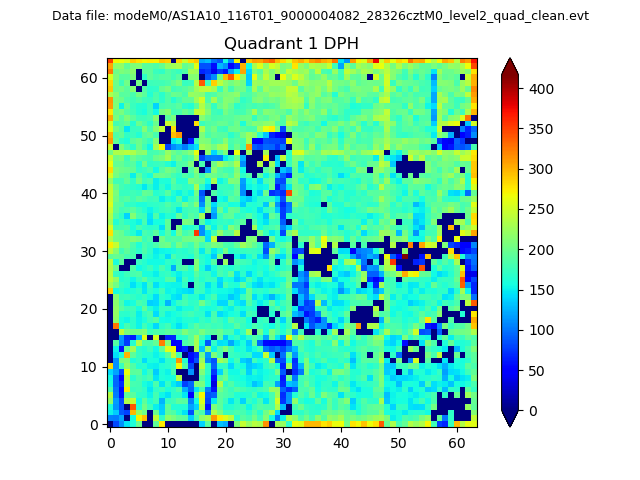 |
Quadrant B |
|---|---|---|---|
| Quadrant D | 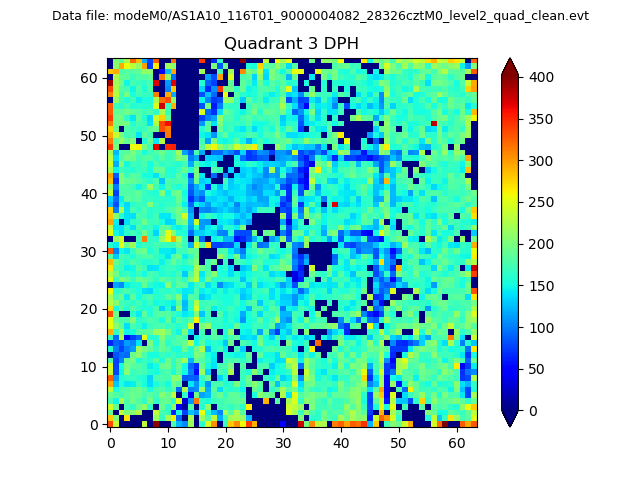 |
 |
Quadrant C |
| Plot type | Count rate plots | Images |
|---|---|---|
| Comparison with Poisson distribution Blue bars denote a histogram of data divided into 1 sec bins. Red curve is a Poisson curve with rate = median count rate of data. |
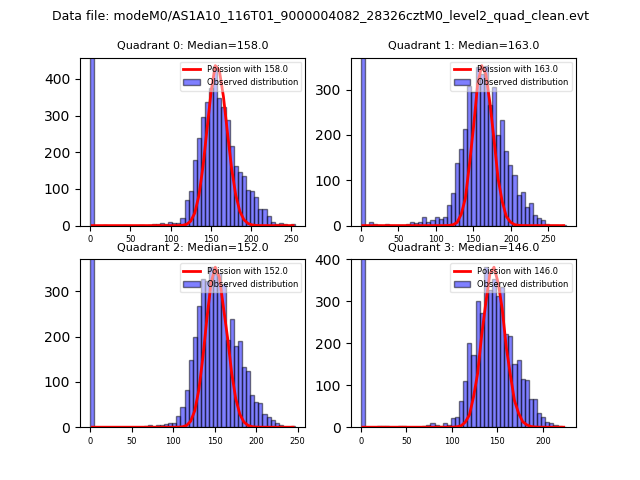 |
 |
| Quadrant-wise count rates Data is divided into 100 sec bins |
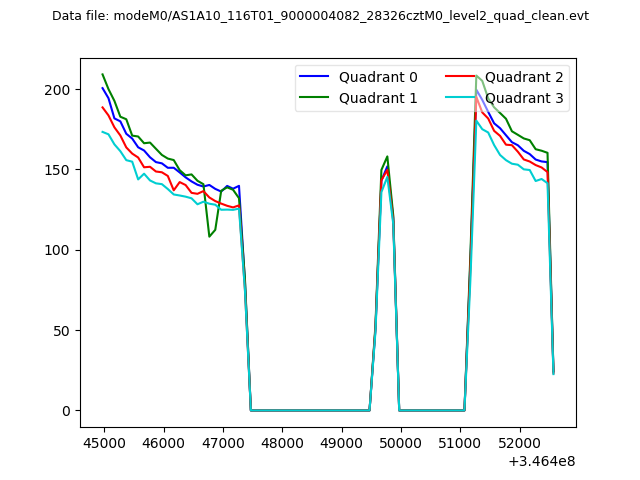 |
|
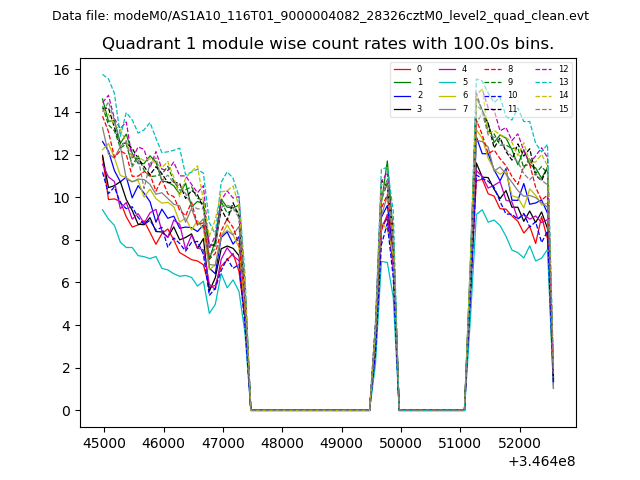
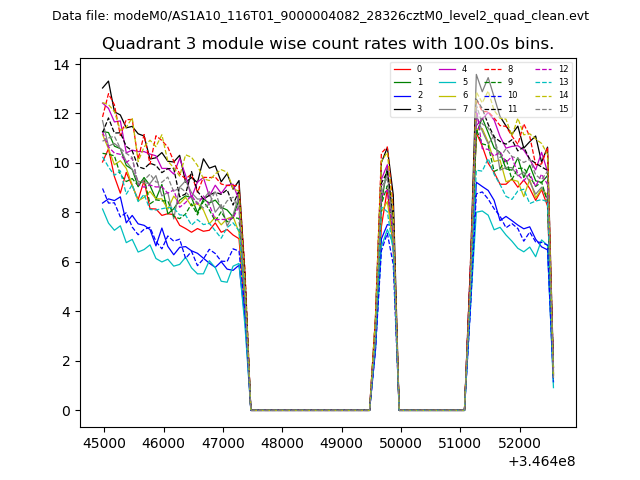
| Module-wise count rates for Quadrant A Data is divided into 100 sec bins |
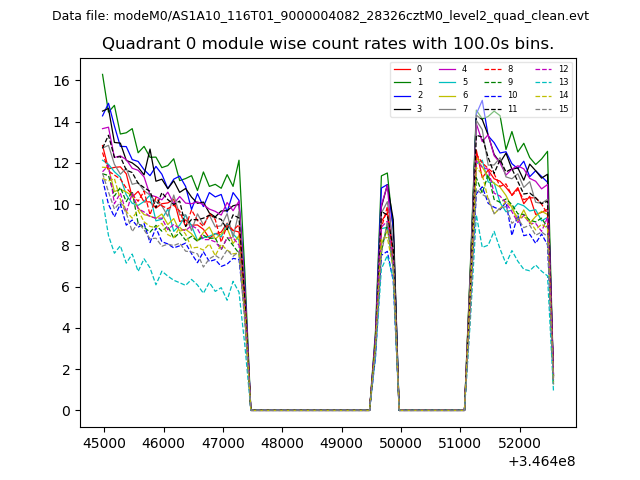 |
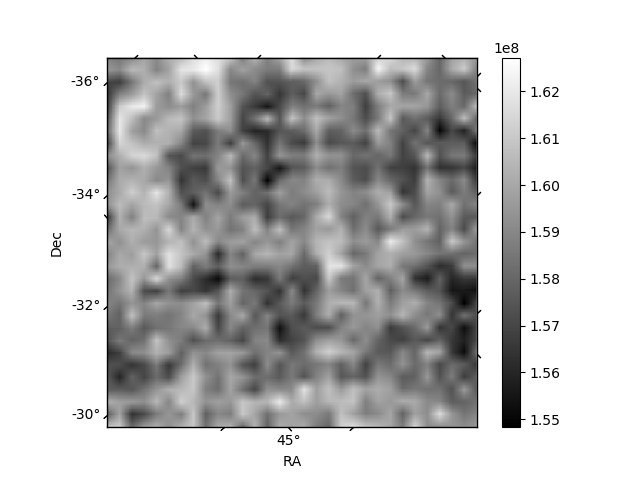 |
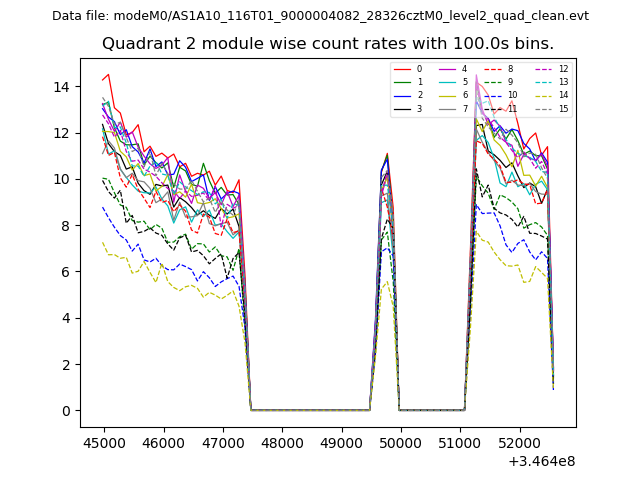
| Module-wise count rates for Quadrant B Data is divided into 100 sec bins |
 |
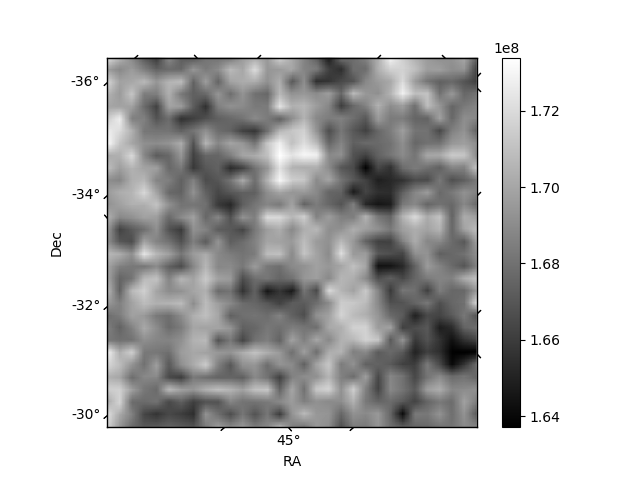 |
| Module-wise count rates for Quadrant C Data is divided into 100 sec bins |
 |
 |
| Module-wise count rates for Quadrant D Data is divided into 100 sec bins |
 |
 |
| Parameter | Plot |
|---|---|
| CZT HV Monitor | 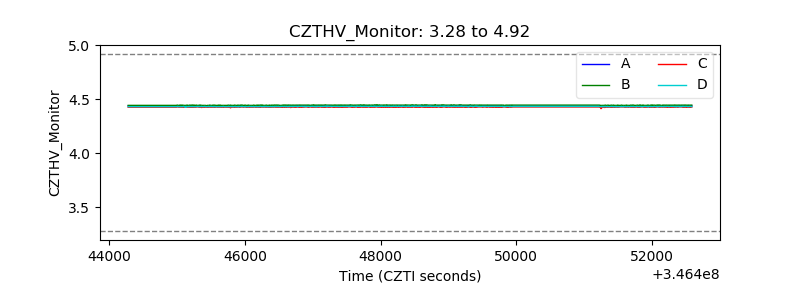 |
| D_VDD | 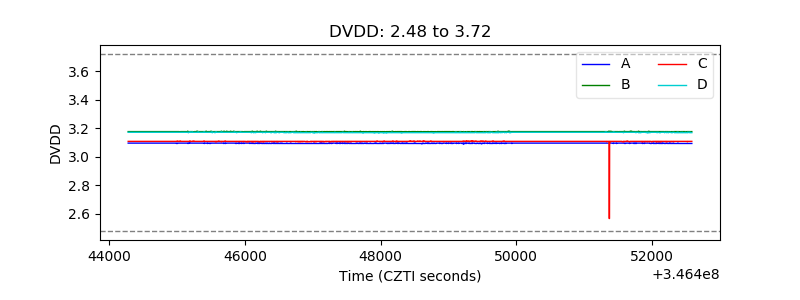 |
| Temperature 1 | 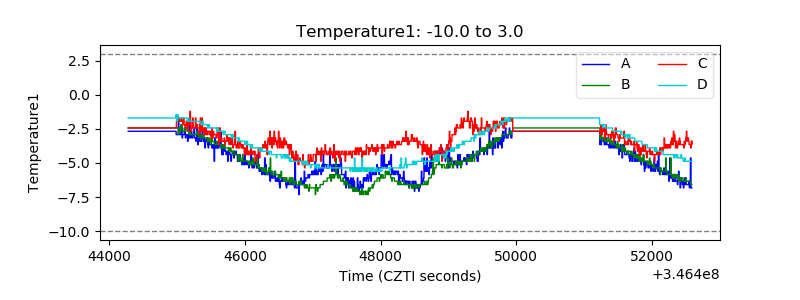 |
| Veto HV Monitor | 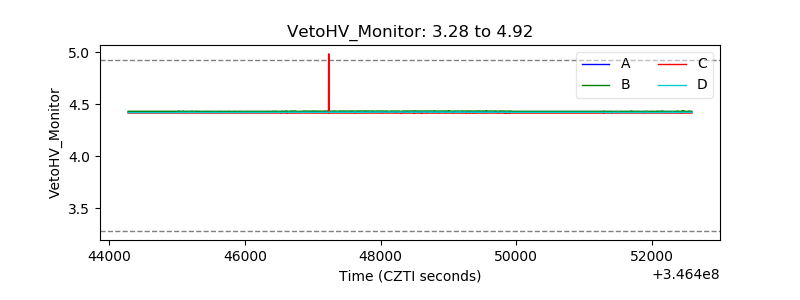 |
| Veto LLD | 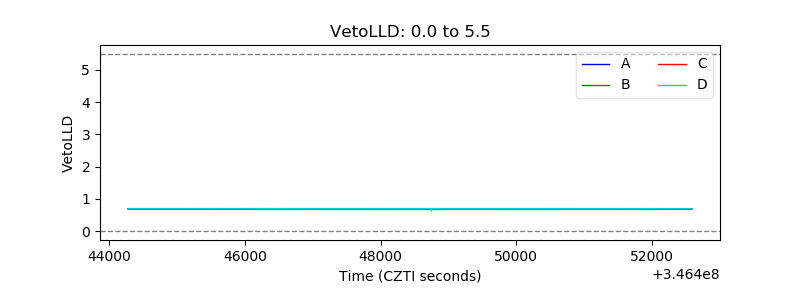 |
| Alpha Counter | 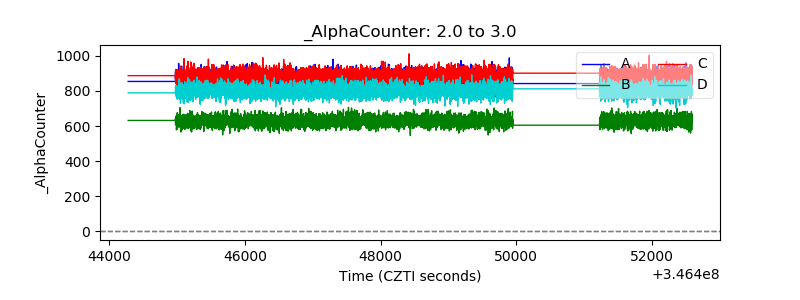 |
| _CPM_Rate | 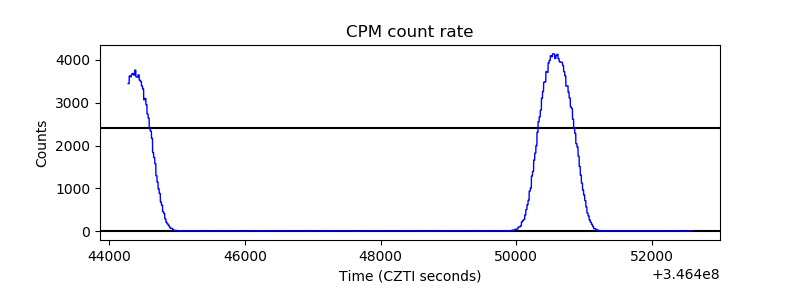 |
| CZT Counter | 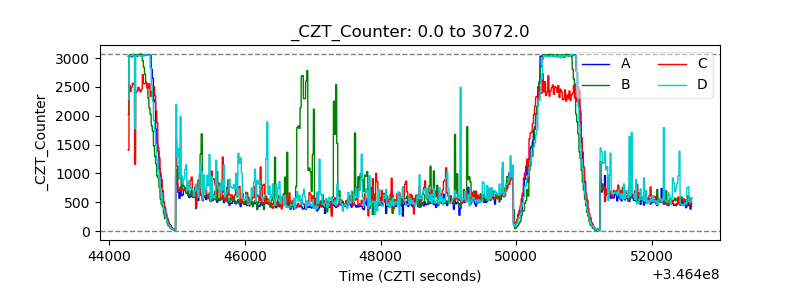 |
| +2.5 Volts monitor | 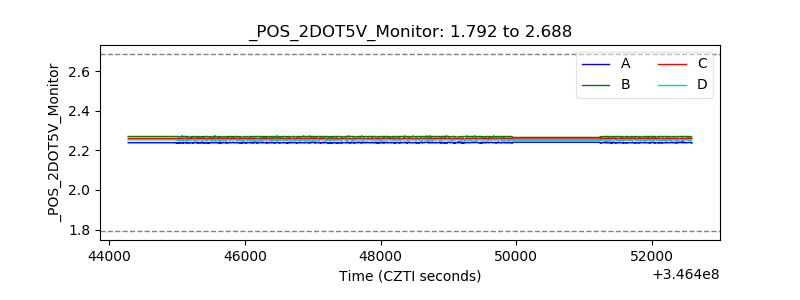 |
| +5 Volts monitor | 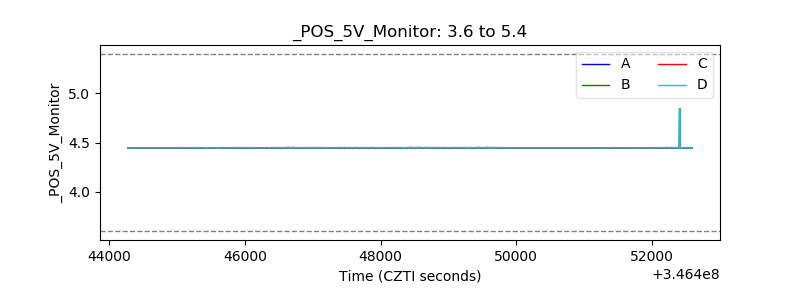 |
| _ROLL_ROT | 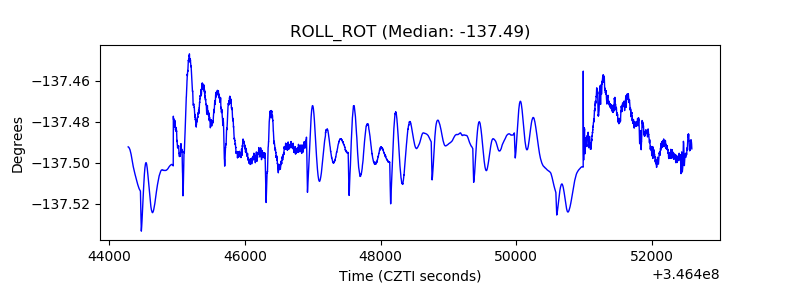 |
| _Roll_DEC | 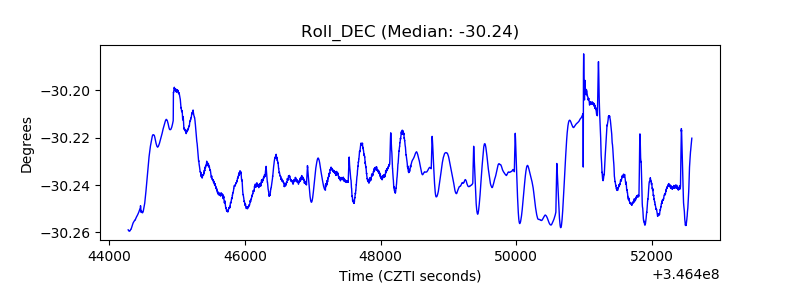 |
| _Roll_RA | 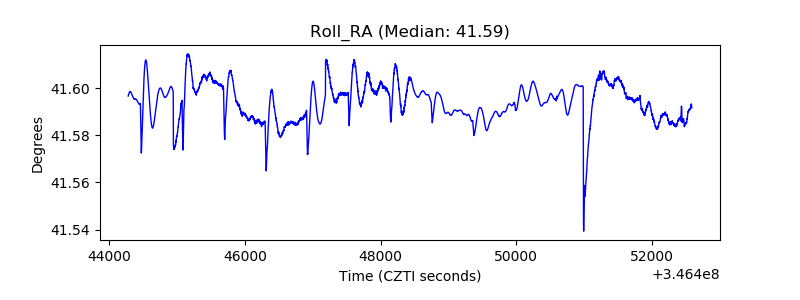 |
| Veto Counter | 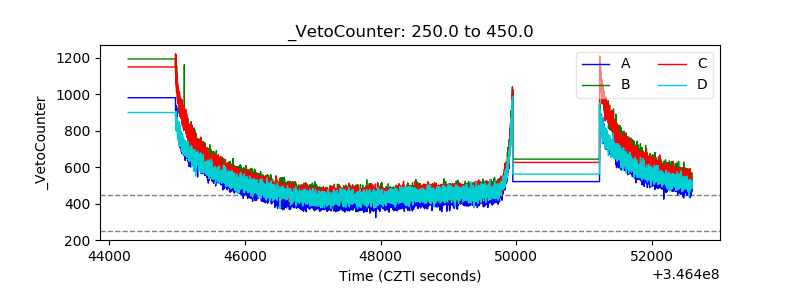 |