| Param | Original file | Final file |
|---|---|---|
| Filename | modeM0/AS1A10_116T01_9000004082_28327cztM0_level2.evt | modeM0/AS1A10_116T01_9000004082_28327cztM0_level2_quad_clean.evt |
| Size (bytes) | 519,154,560 | 96,719,040 |
| Size | 495.1 MB | 92.2 MB |
| Events in quadrant A | 3,149,958 | 638,052 |
| Events in quadrant B | 4,409,705 | 657,480 |
| Events in quadrant C | 3,517,328 | 621,213 |
| Events in quadrant D | 4,231,683 | 585,779 |
| Mode M9 | |||
|---|---|---|---|
| Quadrant | BADHDUFLAG | Total packets | Discarded packets |
| A | 0 | 14 | 0 |
| B | 0 | 15 | 0 |
| C | 0 | 15 | 0 |
| D | 0 | 15 | 0 |
| Mode M0 | |||
|---|---|---|---|
| Quadrant | BADHDUFLAG | Total packets | Discarded packets |
| A | 0 | 13017 | 0 |
| B | 0 | 16933 | 0 |
| C | 0 | 14263 | 0 |
| D | 0 | 16540 | 0 |
| Quadrant | Total seconds | Saturated seconds | Saturation percentage |
|---|---|---|---|
| A | 6108 | 16 | 0.261952% |
| B | 6108 | 414 | 6.777996% |
| C | 6107 | 75 | 1.228099% |
| D | 6107 | 133 | 2.177829% |
Noise dominated data is calculated using 1-second bins in cleaned event files. If a bin has >2000 counts, and if more than 50% of those come from <1% of pixels, then it is considered to be noise-dominated and hence unusable.
| Quadrant | # 1 sec bins | Bins with >0 counts | Bins with >2000 counts | High rate bins dominated by noise | Noise dominated (total time) | Noise dominated (detector-on time) | Marked lightcurve |
|---|---|---|---|---|---|---|---|
| A | 7508 | 6109 | 0 | 0 | 0.00% | 0.00% | 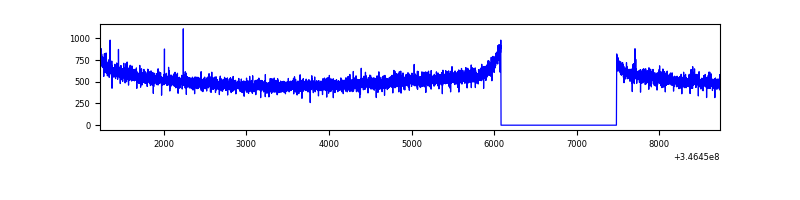 |
| B | 7508 | 6109 | 269 | 269 | 3.58% | 4.40% | 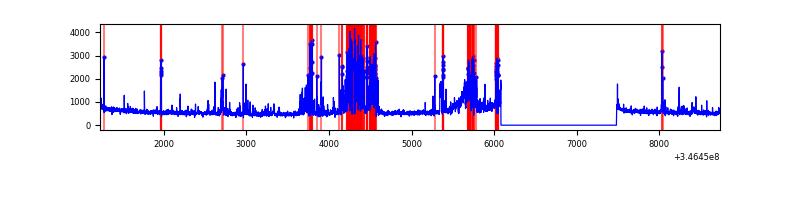 |
| C | 7507 | 6108 | 0 | 0 | 0.00% | 0.00% | 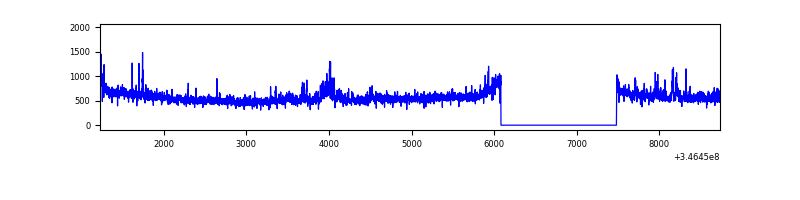 |
| D | 7507 | 6108 | 109 | 109 | 1.45% | 1.78% | 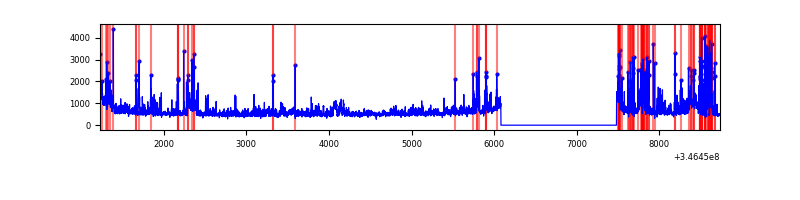 |
Top three noisy pixels from each quadrant. If the there are fewer than three noisy pixels in the level2.evt file, extra rows are filled as -1
| Pixel properties | Quadrant properties | ||||||
|---|---|---|---|---|---|---|---|
| Quadrant | DetID | PixID | Counts | Sigma | Mean | Median | Sigma |
| A | 13 | 254 | 10266 | 58.92 | 816 | 804 | 160.6 |
| A | 3 | 137 | 7422 | 41.21 | 816 | 804 | 160.6 |
| A | 0 | 226 | 6891 | 37.9 | 816 | 804 | 160.6 |
| B | 10 | 245 | 1173909 | 7823.44 | 807 | 789 | 149.9 |
| B | 10 | 246 | 54668 | 359.31 | 807 | 789 | 149.9 |
| B | 0 | 230 | 19871 | 127.25 | 807 | 789 | 149.9 |
| C | 3 | 233 | 303785 | 1656.04 | 791 | 797 | 183.0 |
| C | 14 | 238 | 130961 | 711.44 | 791 | 797 | 183.0 |
| C | 13 | 61 | 5449 | 25.43 | 791 | 797 | 183.0 |
| D | 1 | 52 | 979548 | 5290.66 | 779 | 758 | 185.0 |
| D | 8 | 195 | 261318 | 1408.41 | 779 | 758 | 185.0 |
| D | 2 | 234 | 22917 | 119.77 | 779 | 758 | 185.0 |
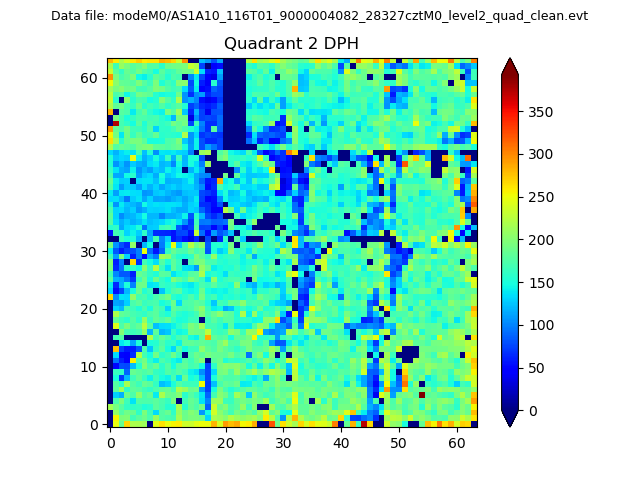
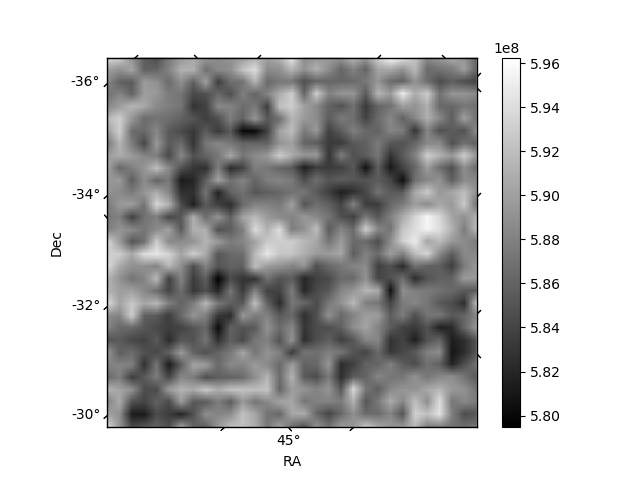
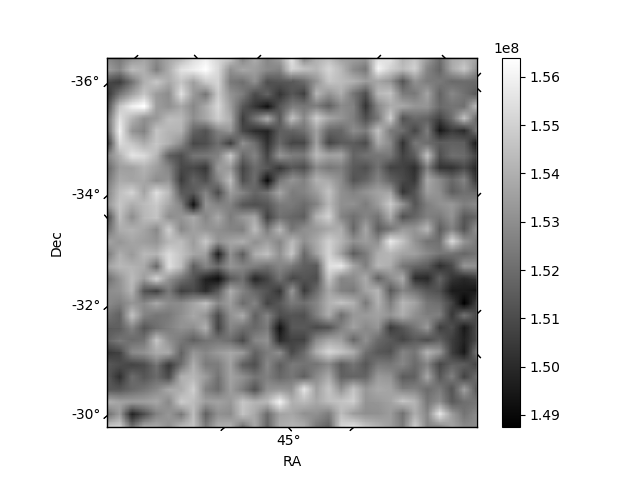
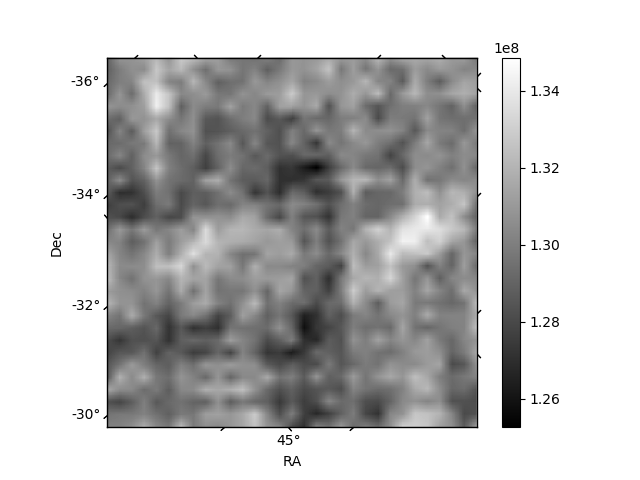
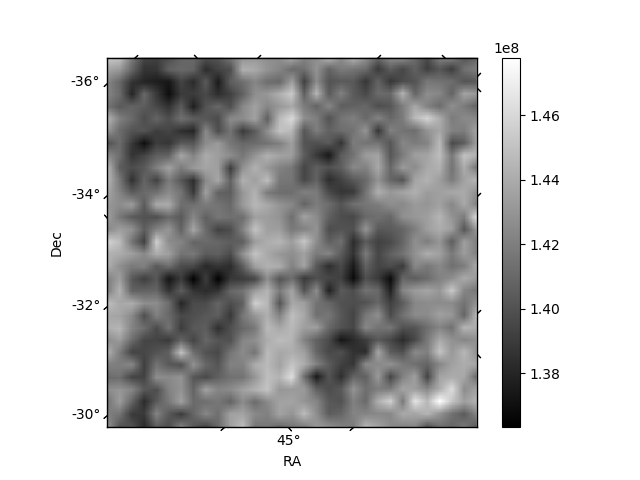
Histogram calculated using DETX and DETY for each event in the final _common_clean file
| Quadrant A | 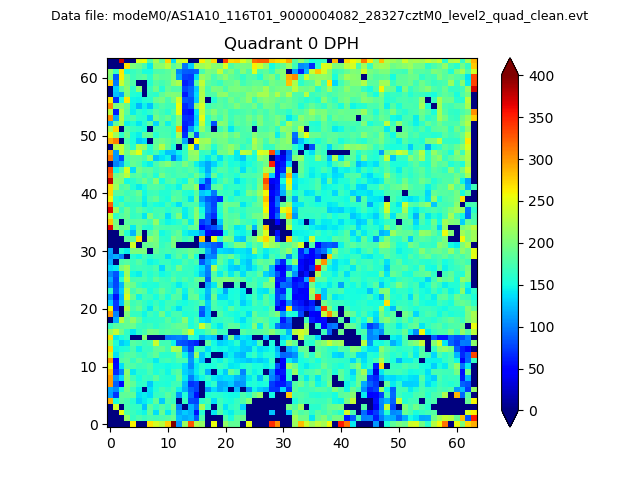 |
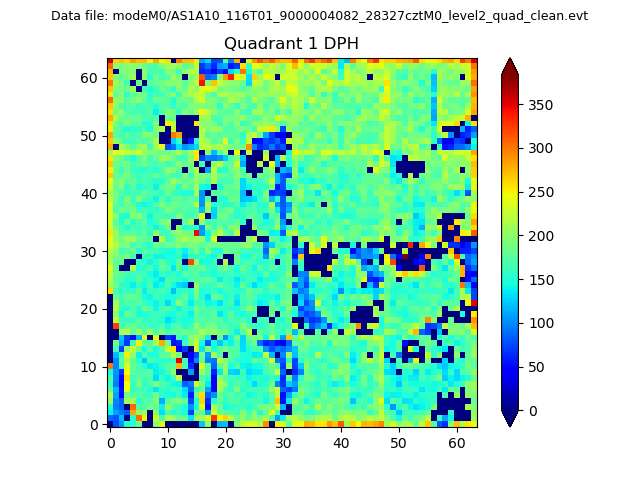 |
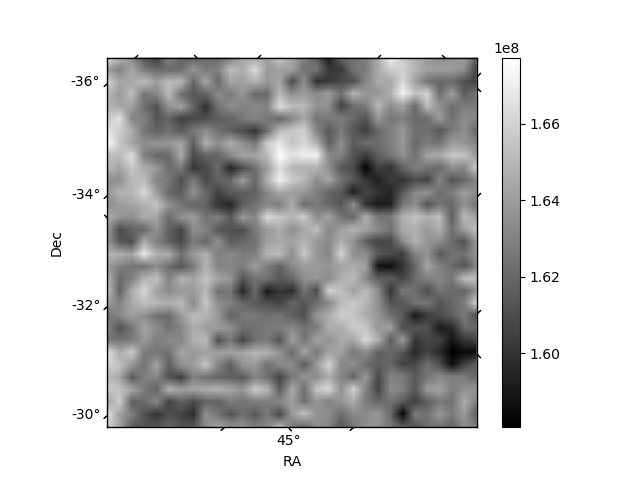
Quadrant B |
|---|---|---|---|
| Quadrant D | 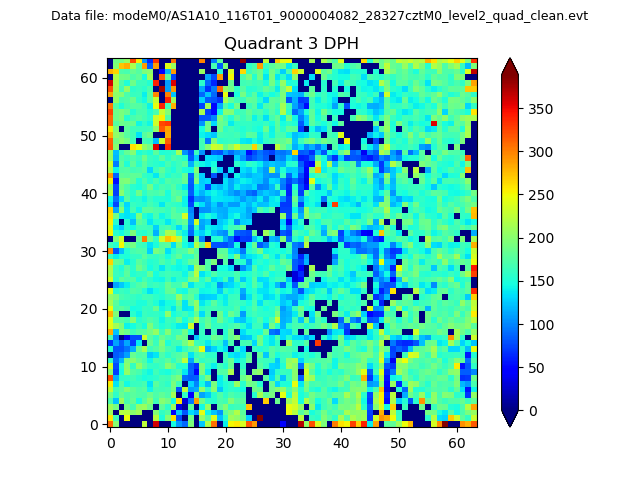 |
 |
Quadrant C |
| Plot type | Count rate plots | Images |
|---|---|---|
| Comparison with Poisson distribution Blue bars denote a histogram of data divided into 1 sec bins. Red curve is a Poisson curve with rate = median count rate of data. |
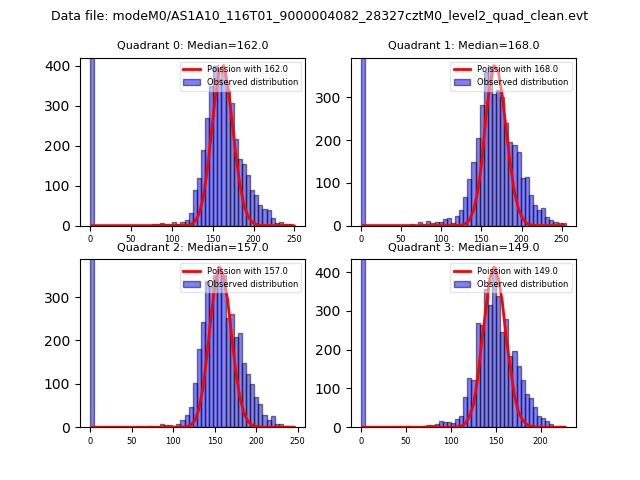 |
 |
| Quadrant-wise count rates Data is divided into 100 sec bins |
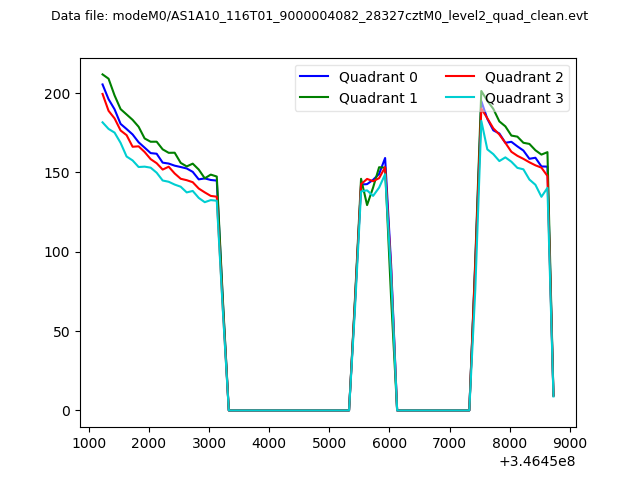 |
|
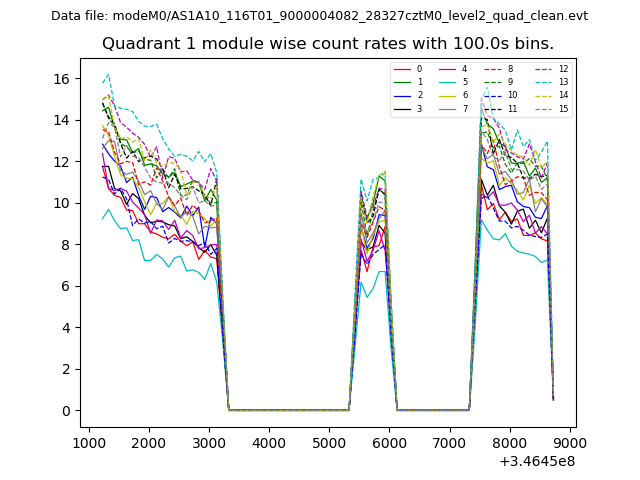
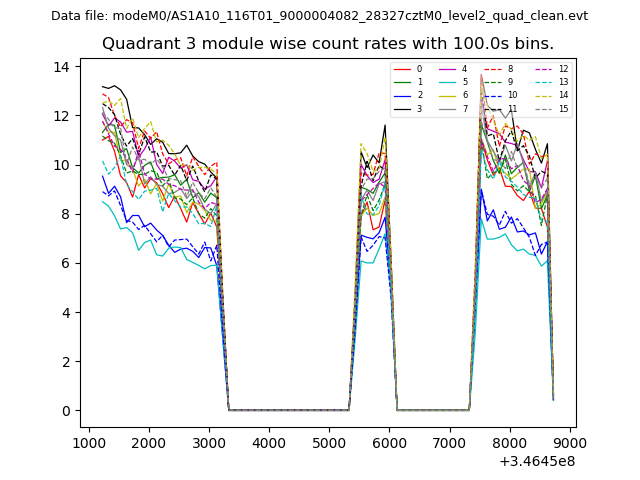
| Module-wise count rates for Quadrant A Data is divided into 100 sec bins |
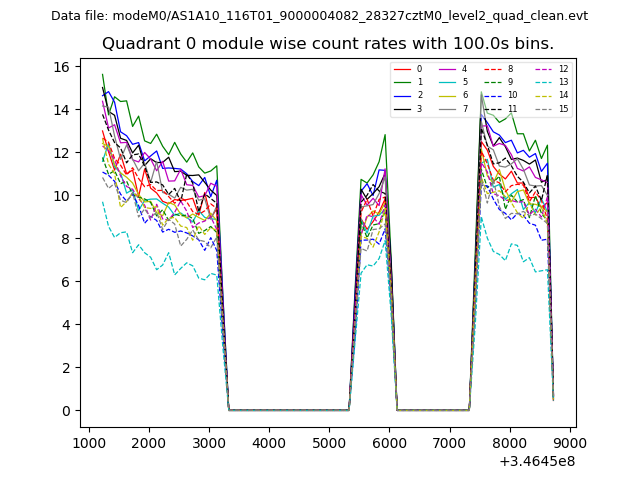 |
 |
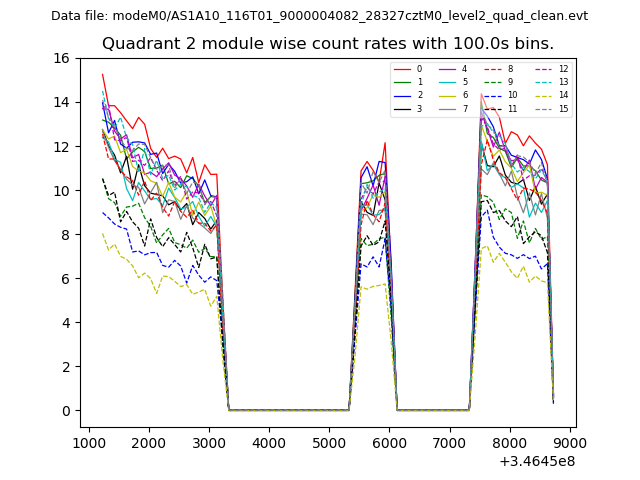
| Module-wise count rates for Quadrant B Data is divided into 100 sec bins |
 |
 |
| Module-wise count rates for Quadrant C Data is divided into 100 sec bins |
 |
 |
| Module-wise count rates for Quadrant D Data is divided into 100 sec bins |
 |
 |
| Parameter | Plot |
|---|---|
| CZT HV Monitor | 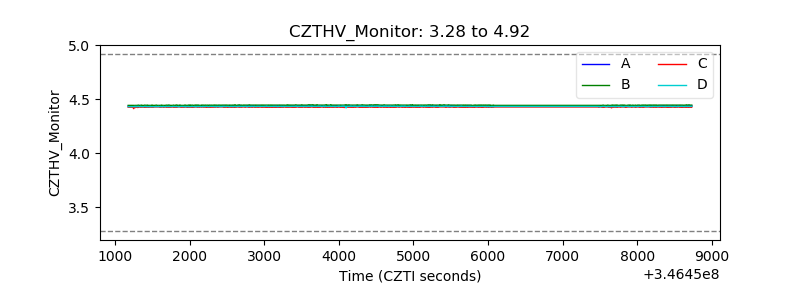 |
| D_VDD | 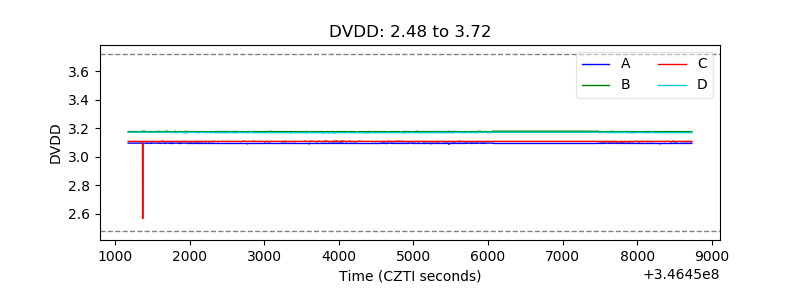 |
| Temperature 1 | 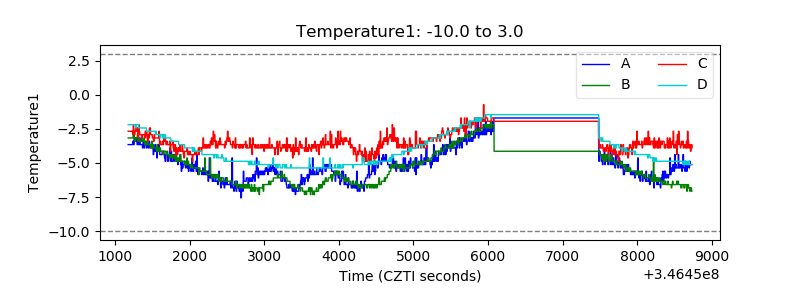 |
| Veto HV Monitor | 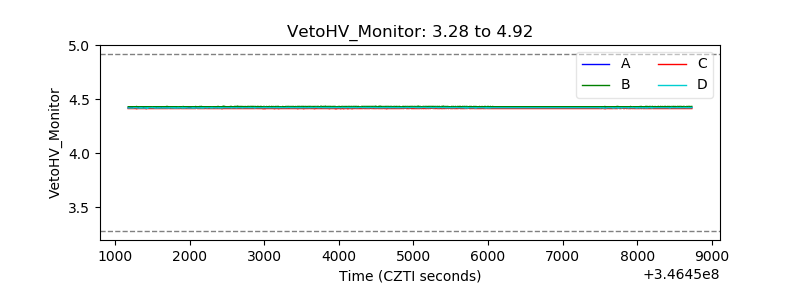 |
| Veto LLD | 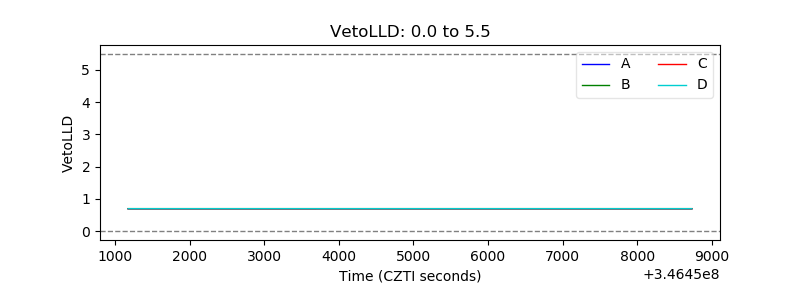 |
| Alpha Counter | 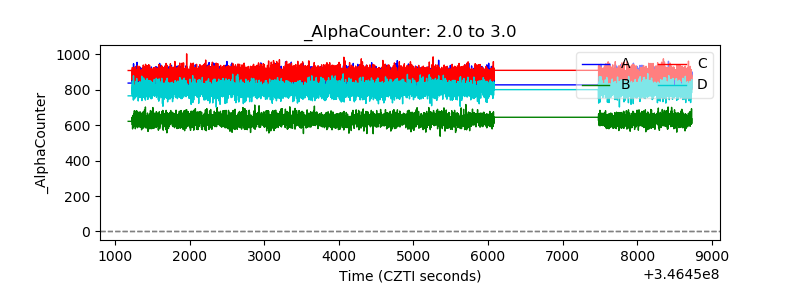 |
| _CPM_Rate | 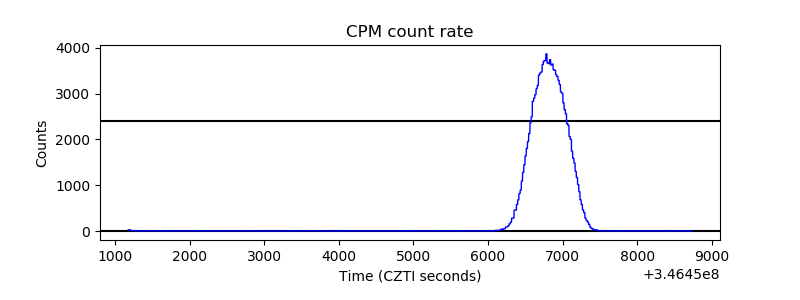 |
| CZT Counter | 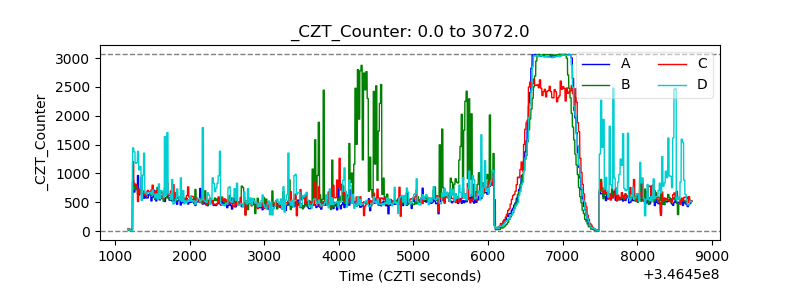 |
| +2.5 Volts monitor | 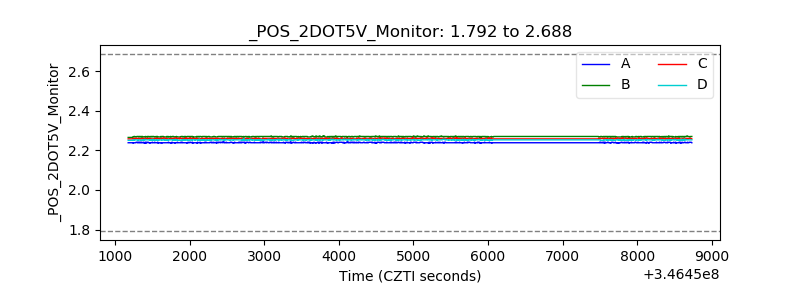 |
| +5 Volts monitor |  |
| _ROLL_ROT | 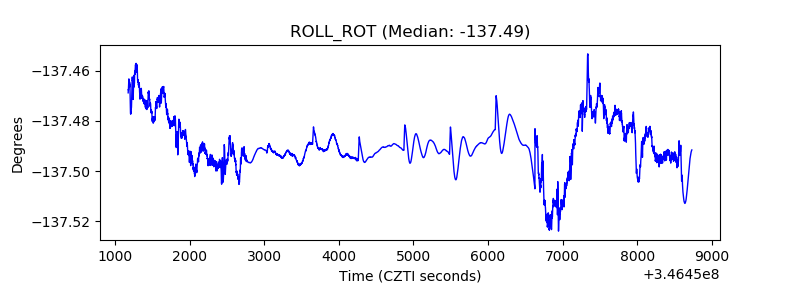 |
| _Roll_DEC |  |
| _Roll_RA | 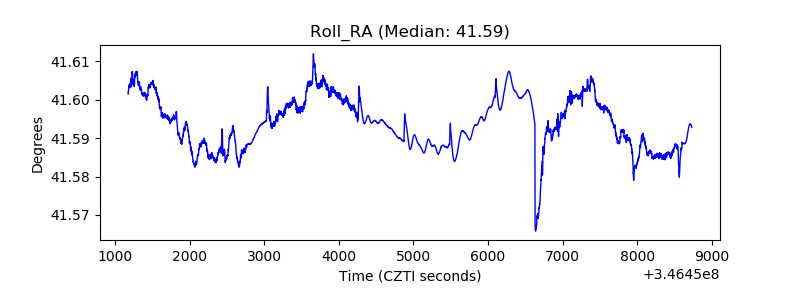 |
| Veto Counter | 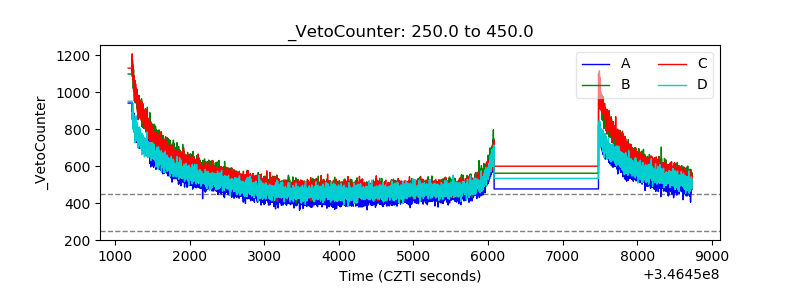 |