| Param | Original file | Final file |
|---|---|---|
| Filename | modeM0/AS1A10_116T01_9000004082_28328cztM0_level2.evt | modeM0/AS1A10_116T01_9000004082_28328cztM0_level2_quad_clean.evt |
| Size (bytes) | 529,640,640 | 96,949,440 |
| Size | 505.1 MB | 92.5 MB |
| Events in quadrant A | 3,295,296 | 630,540 |
| Events in quadrant B | 3,633,519 | 656,611 |
| Events in quadrant C | 3,918,244 | 615,774 |
| Events in quadrant D | 4,756,665 | 583,819 |
| Mode M9 | |||
|---|---|---|---|
| Quadrant | BADHDUFLAG | Total packets | Discarded packets |
| A | 0 | 18 | 0 |
| B | 0 | 19 | 0 |
| C | 0 | 19 | 0 |
| D | 0 | 19 | 0 |
| Mode M0 | |||
|---|---|---|---|
| Quadrant | BADHDUFLAG | Total packets | Discarded packets |
| A | 0 | 13607 | 0 |
| B | 0 | 14587 | 0 |
| C | 0 | 15699 | 0 |
| D | 0 | 18313 | 0 |
| Quadrant | Total seconds | Saturated seconds | Saturation percentage |
|---|---|---|---|
| A | 6442 | 43 | 0.667495% |
| B | 6442 | 101 | 1.567836% |
| C | 6442 | 160 | 2.483701% |
| D | 6442 | 277 | 4.299907% |
Noise dominated data is calculated using 1-second bins in cleaned event files. If a bin has >2000 counts, and if more than 50% of those come from <1% of pixels, then it is considered to be noise-dominated and hence unusable.
| Quadrant | # 1 sec bins | Bins with >0 counts | Bins with >2000 counts | High rate bins dominated by noise | Noise dominated (total time) | Noise dominated (detector-on time) | Marked lightcurve |
|---|---|---|---|---|---|---|---|
| A | 7757 | 6443 | 0 | 0 | 0.00% | 0.00% | 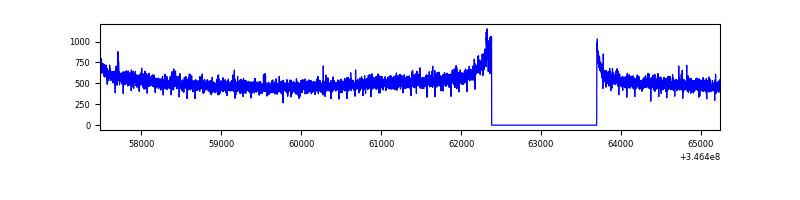 |
| B | 7757 | 6443 | 8 | 8 | 0.10% | 0.12% | 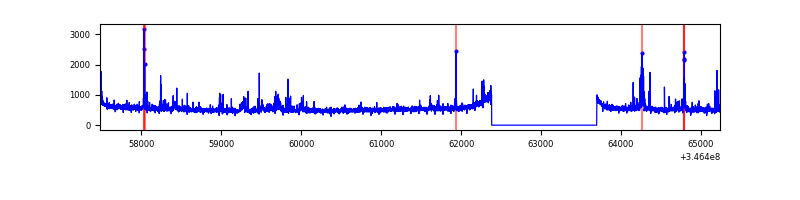 |
| C | 7757 | 6442 | 6 | 6 | 0.08% | 0.09% | 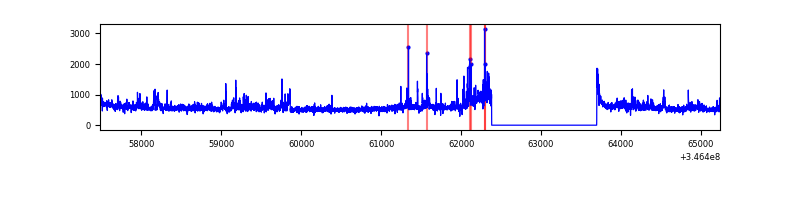 |
| D | 7757 | 6443 | 202 | 202 | 2.60% | 3.14% | 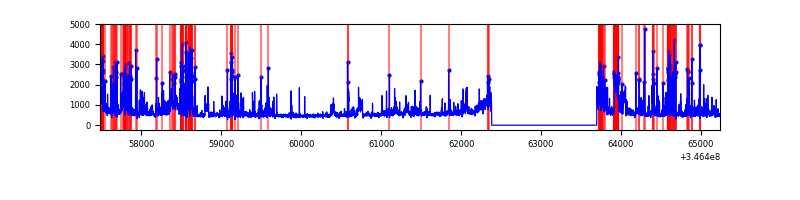 |
Top three noisy pixels from each quadrant. If the there are fewer than three noisy pixels in the level2.evt file, extra rows are filled as -1
| Pixel properties | Quadrant properties | ||||||
|---|---|---|---|---|---|---|---|
| Quadrant | DetID | PixID | Counts | Sigma | Mean | Median | Sigma |
| A | 13 | 254 | 11162 | 61.2 | 852 | 836 | 168.7 |
| A | 1 | 113 | 7969 | 42.27 | 852 | 836 | 168.7 |
| A | 3 | 137 | 7868 | 41.67 | 852 | 836 | 168.7 |
| B | 10 | 245 | 177148 | 1095.16 | 861 | 843 | 161.0 |
| B | 10 | 246 | 52066 | 318.18 | 861 | 843 | 161.0 |
| B | 12 | 111 | 19263 | 114.42 | 861 | 843 | 161.0 |
| C | 3 | 233 | 544753 | 2829.36 | 831 | 837 | 192.2 |
| C | 14 | 238 | 135858 | 702.36 | 831 | 837 | 192.2 |
| C | 13 | 61 | 5637 | 24.97 | 831 | 837 | 192.2 |
| D | 1 | 52 | 1327461 | 6845.48 | 817 | 798 | 193.8 |
| D | 8 | 195 | 174086 | 894.15 | 817 | 798 | 193.8 |
| D | 7 | 238 | 95054 | 486.35 | 817 | 798 | 193.8 |
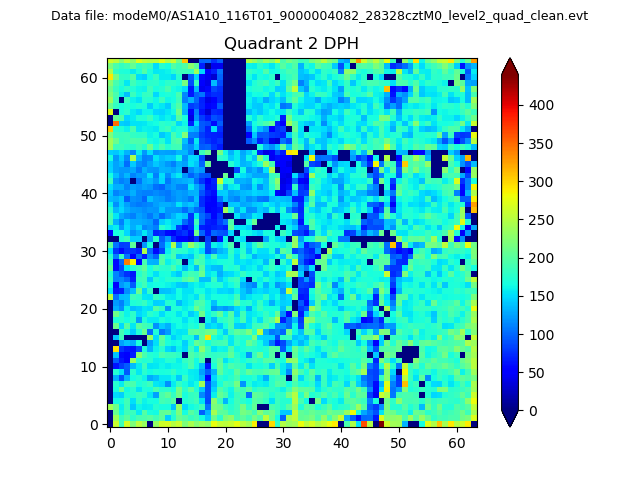
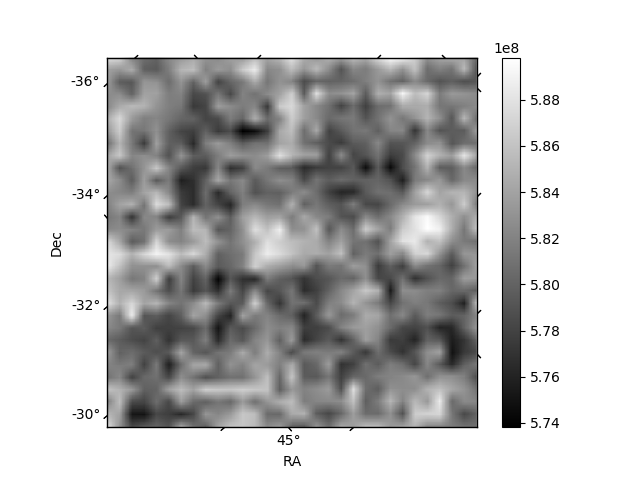
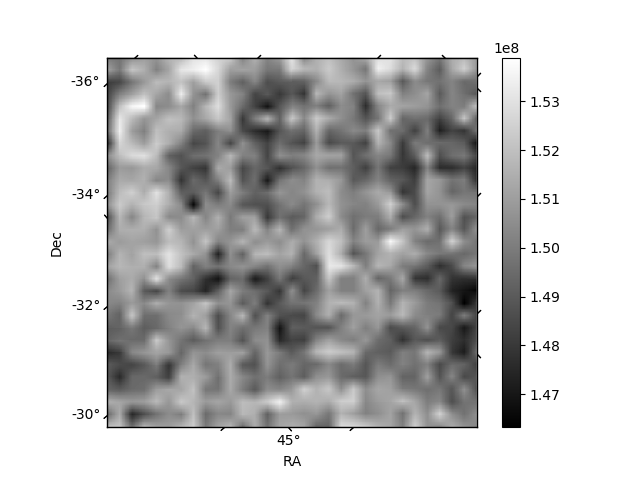
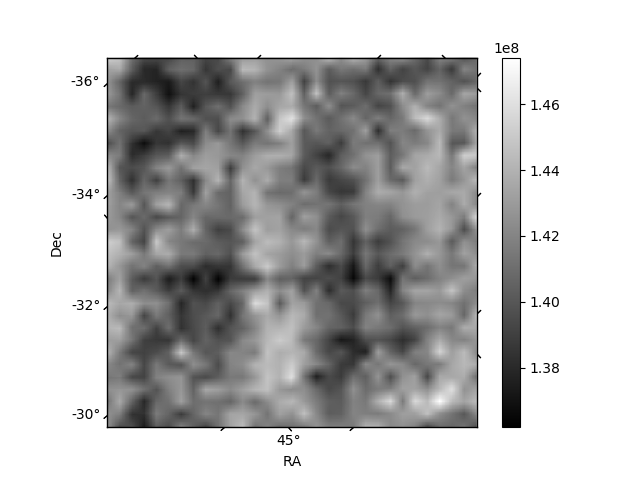
Histogram calculated using DETX and DETY for each event in the final _common_clean file
| Quadrant A | 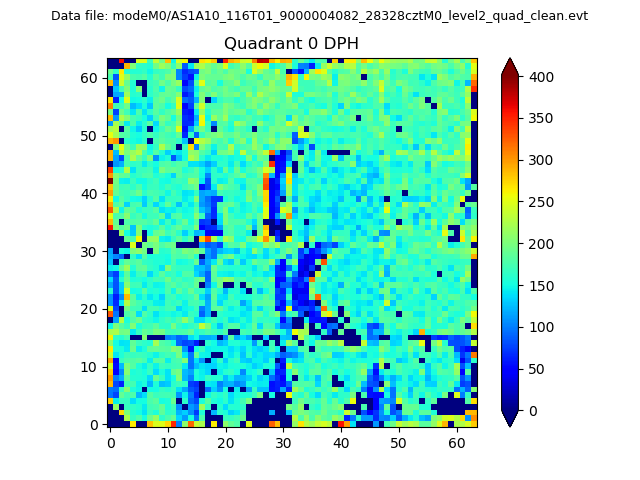 |
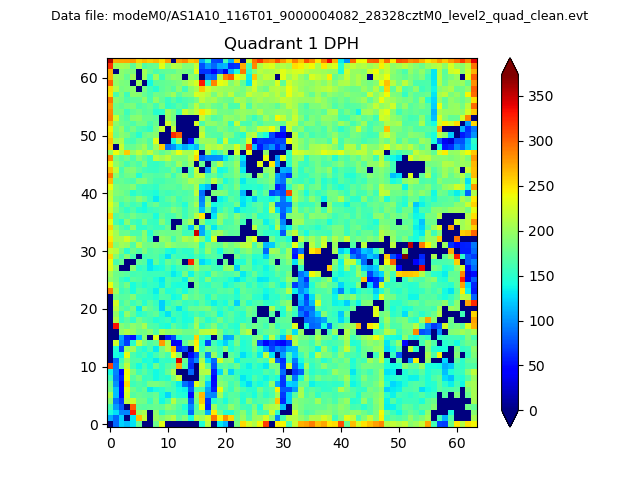 |
Quadrant B |
|---|---|---|---|
| Quadrant D | 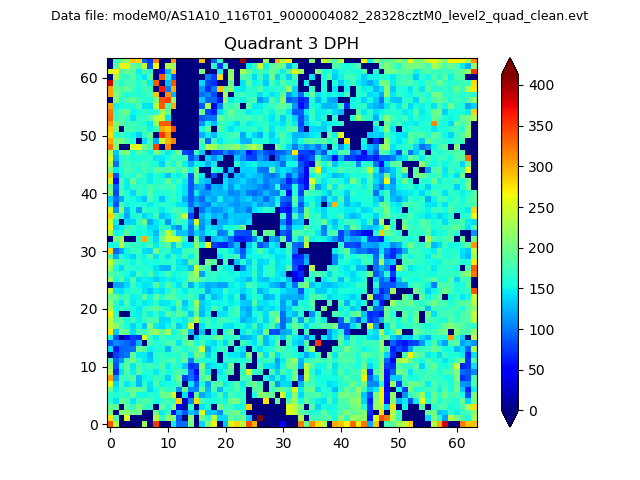 |
 |
Quadrant C |
| Plot type | Count rate plots | Images |
|---|---|---|
| Comparison with Poisson distribution Blue bars denote a histogram of data divided into 1 sec bins. Red curve is a Poisson curve with rate = median count rate of data. |
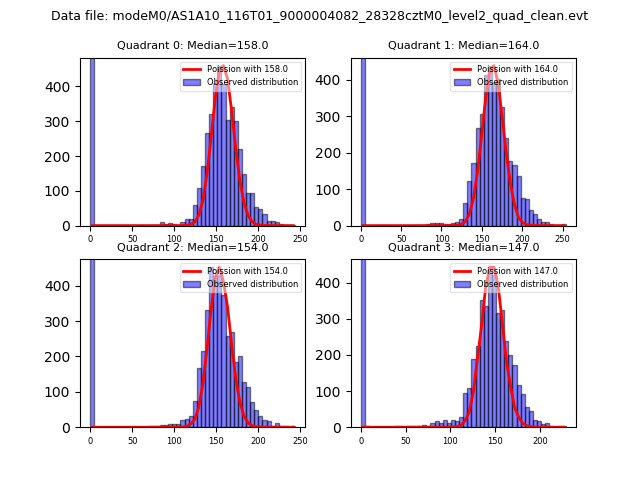 |
 |
| Quadrant-wise count rates Data is divided into 100 sec bins |
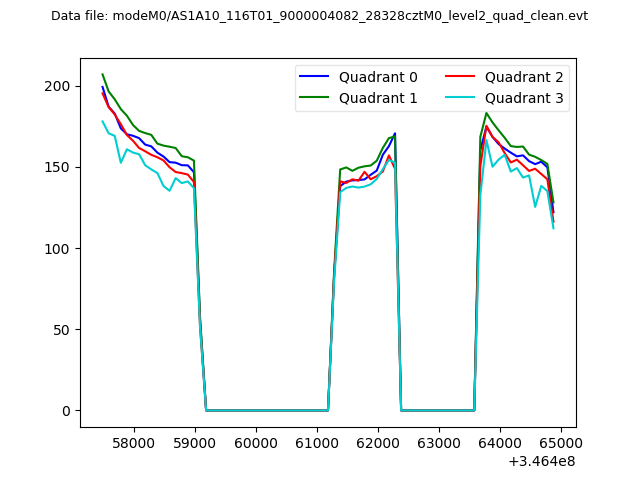 |
|
| Module-wise count rates for Quadrant A Data is divided into 100 sec bins |
 |
 |
| Module-wise count rates for Quadrant B Data is divided into 100 sec bins |
 |
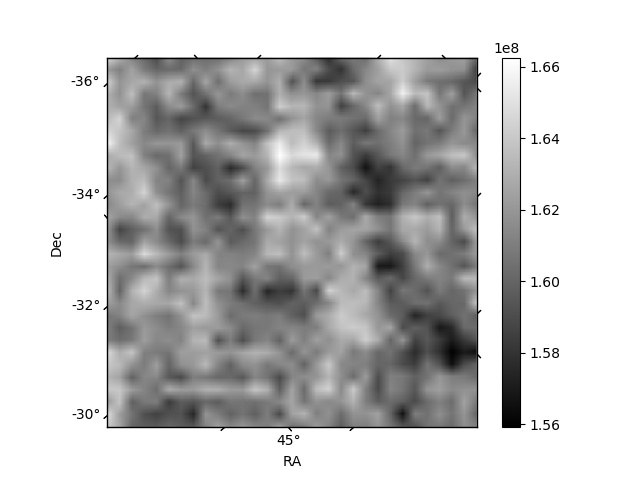 |
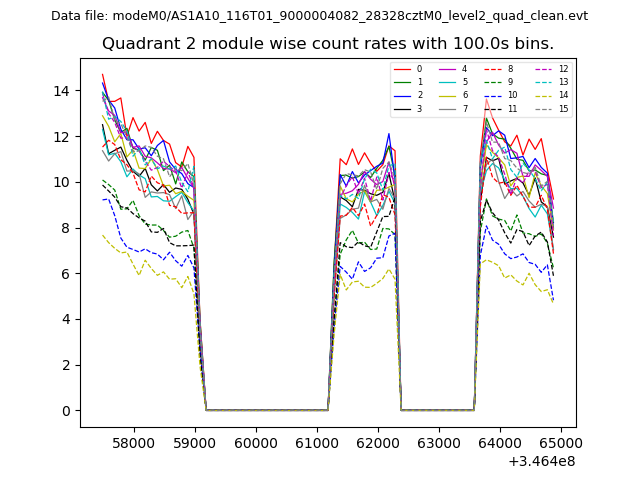
| Module-wise count rates for Quadrant C Data is divided into 100 sec bins |
 |
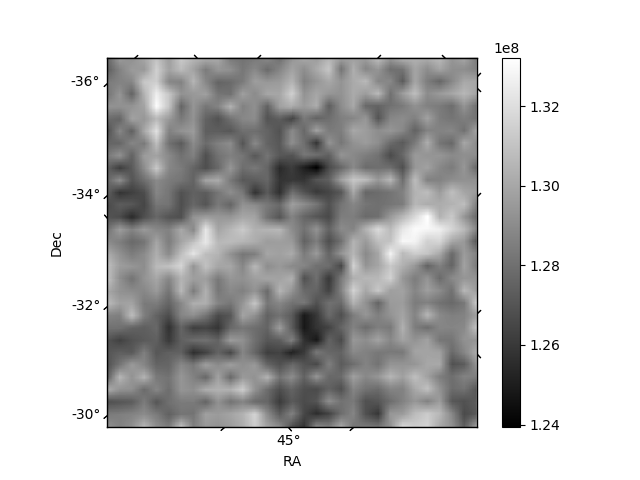 |
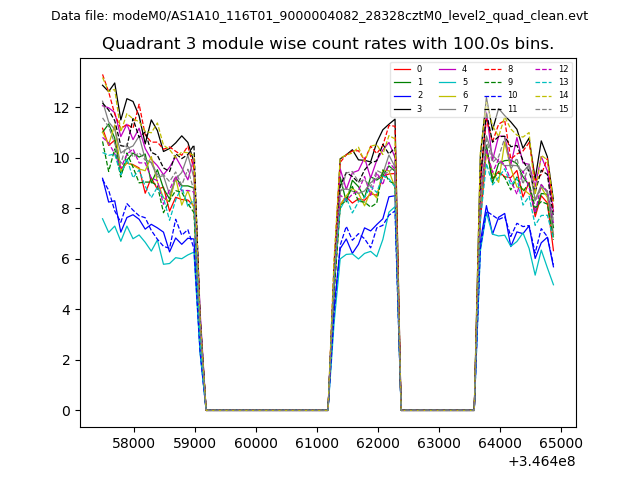
| Module-wise count rates for Quadrant D Data is divided into 100 sec bins |
 |
 |
| Parameter | Plot |
|---|---|
| CZT HV Monitor |  |
| D_VDD | 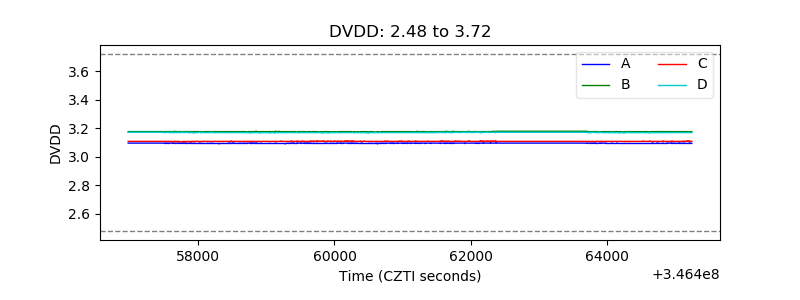 |
| Temperature 1 | 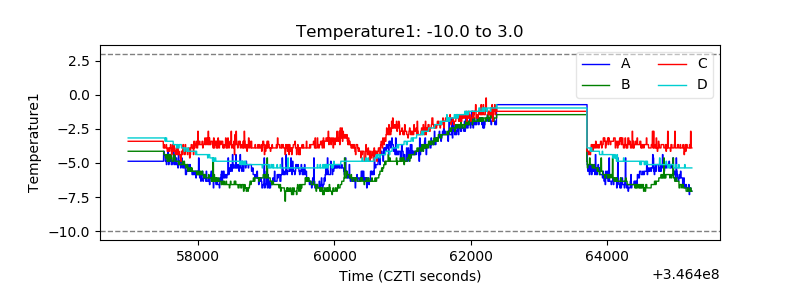 |
| Veto HV Monitor | 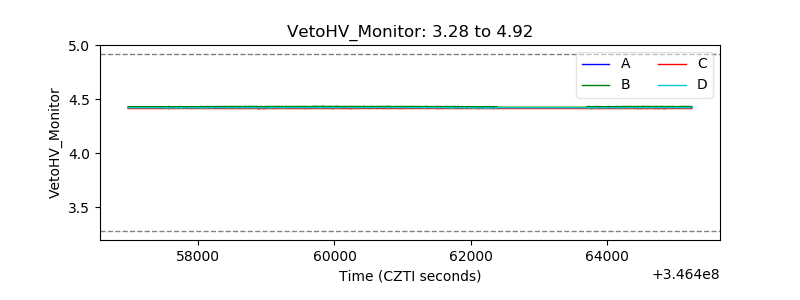 |
| Veto LLD | 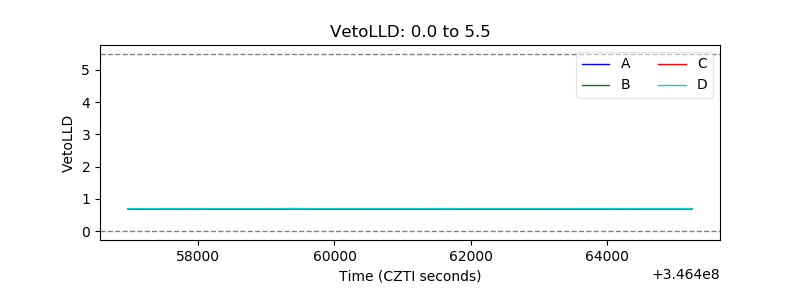 |
| Alpha Counter | 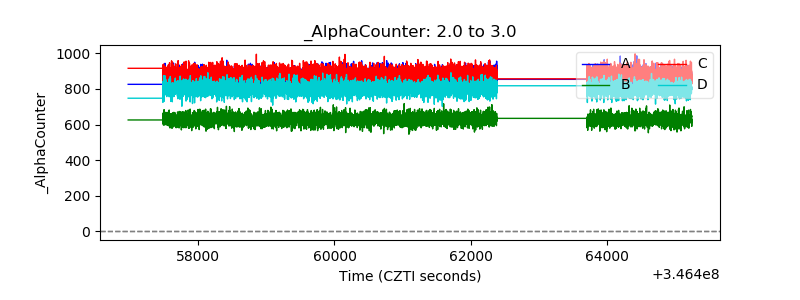 |
| _CPM_Rate | 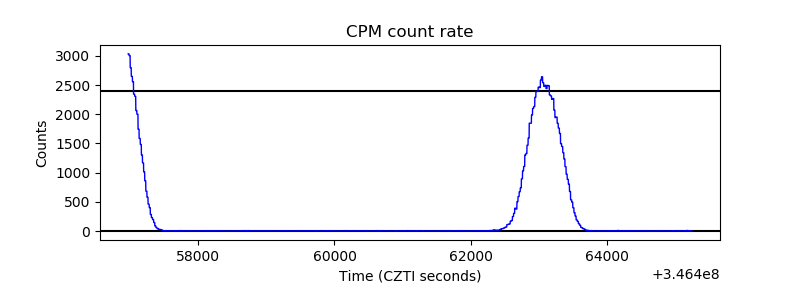 |
| CZT Counter | 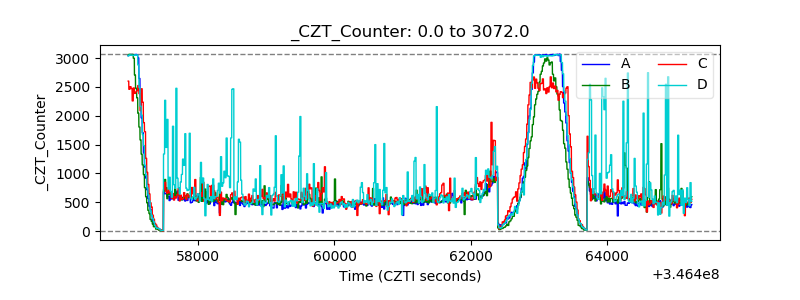 |
| +2.5 Volts monitor |  |
| +5 Volts monitor |  |
| _ROLL_ROT | 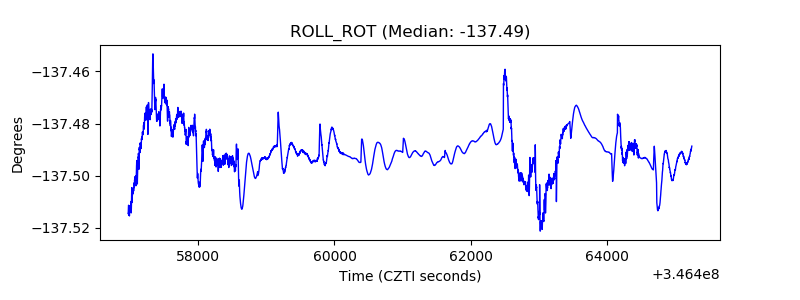 |
| _Roll_DEC | 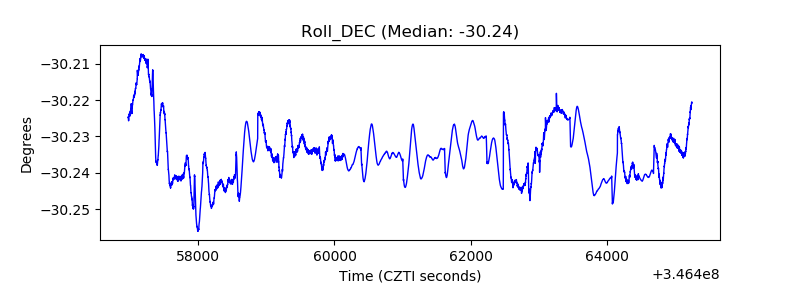 |
| _Roll_RA | 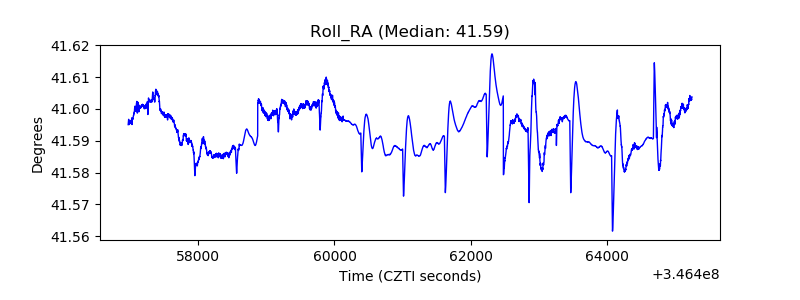 |
| Veto Counter | 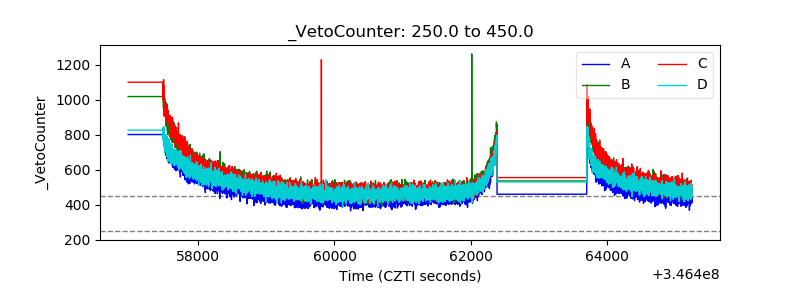 |