| Param | Original file | Final file |
|---|---|---|
| Filename | modeM0/AS1A10_116T01_9000004082_28329cztM0_level2.evt | modeM0/AS1A10_116T01_9000004082_28329cztM0_level2_quad_clean.evt |
| Size (bytes) | 551,574,720 | 87,428,160 |
| Size | 526.0 MB | 83.4 MB |
| Events in quadrant A | 3,300,657 | 556,490 |
| Events in quadrant B | 3,677,688 | 572,988 |
| Events in quadrant C | 3,940,227 | 543,916 |
| Events in quadrant D | 5,334,192 | 509,452 |
| Mode M9 | |||
|---|---|---|---|
| Quadrant | BADHDUFLAG | Total packets | Discarded packets |
| A | 0 | 20 | 0 |
| B | 0 | 21 | 0 |
| C | 0 | 21 | 0 |
| D | 0 | 21 | 0 |
| Mode M0 | |||
|---|---|---|---|
| Quadrant | BADHDUFLAG | Total packets | Discarded packets |
| A | 0 | 13800 | 0 |
| B | 0 | 14891 | 0 |
| C | 0 | 15742 | 0 |
| D | 0 | 20265 | 0 |
| Quadrant | Total seconds | Saturated seconds | Saturation percentage |
|---|---|---|---|
| A | 6669 | 34 | 0.509822% |
| B | 6668 | 115 | 1.724655% |
| C | 6668 | 161 | 2.414517% |
| D | 6668 | 350 | 5.248950% |
Noise dominated data is calculated using 1-second bins in cleaned event files. If a bin has >2000 counts, and if more than 50% of those come from <1% of pixels, then it is considered to be noise-dominated and hence unusable.
| Quadrant | # 1 sec bins | Bins with >0 counts | Bins with >2000 counts | High rate bins dominated by noise | Noise dominated (total time) | Noise dominated (detector-on time) | Marked lightcurve |
|---|---|---|---|---|---|---|---|
| A | 7864 | 6671 | 0 | 0 | 0.00% | 0.00% | 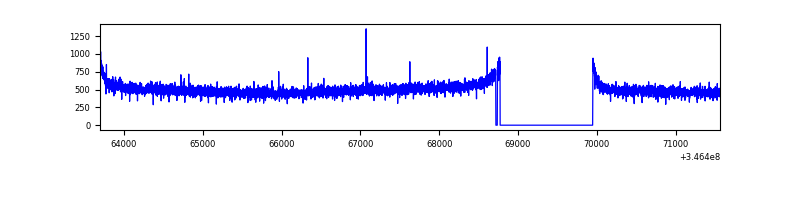 |
| B | 7863 | 6670 | 17 | 17 | 0.22% | 0.25% | 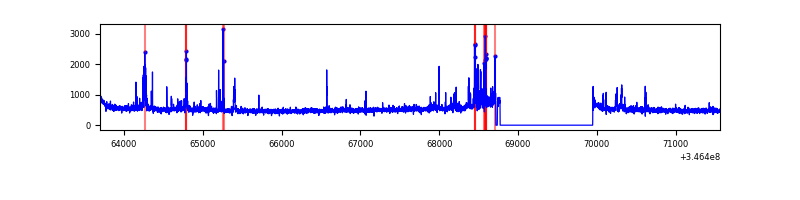 |
| C | 7863 | 6669 | 23 | 23 | 0.29% | 0.34% | 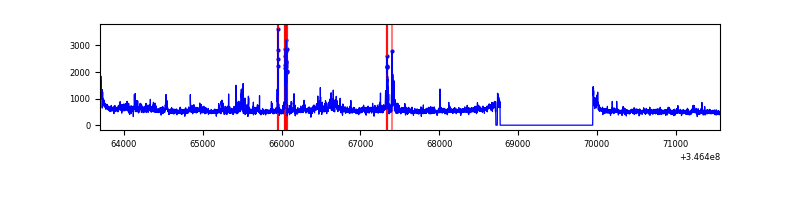 |
| D | 7863 | 6670 | 295 | 295 | 3.75% | 4.42% | 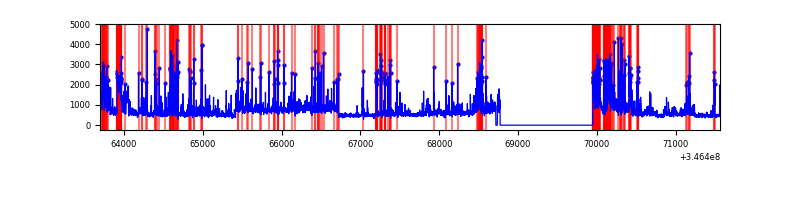 |
Top three noisy pixels from each quadrant. If the there are fewer than three noisy pixels in the level2.evt file, extra rows are filled as -1
| Pixel properties | Quadrant properties | ||||||
|---|---|---|---|---|---|---|---|
| Quadrant | DetID | PixID | Counts | Sigma | Mean | Median | Sigma |
| A | 13 | 254 | 10879 | 58.96 | 855 | 839 | 170.3 |
| A | 3 | 137 | 8037 | 42.27 | 855 | 839 | 170.3 |
| A | 0 | 226 | 7156 | 37.09 | 855 | 839 | 170.3 |
| B | 10 | 245 | 270940 | 1655.32 | 860 | 840 | 163.2 |
| B | 12 | 111 | 19724 | 115.73 | 860 | 840 | 163.2 |
| B | 11 | 111 | 17862 | 104.32 | 860 | 840 | 163.2 |
| C | 3 | 233 | 562503 | 2904.27 | 832 | 838 | 193.4 |
| C | 14 | 238 | 135355 | 695.56 | 832 | 838 | 193.4 |
| C | 13 | 61 | 5771 | 25.51 | 832 | 838 | 193.4 |
| D | 1 | 52 | 1152452 | 5919.11 | 819 | 798 | 194.6 |
| D | 8 | 195 | 849098 | 4359.97 | 819 | 798 | 194.6 |
| D | 7 | 238 | 90129 | 459.13 | 819 | 798 | 194.6 |
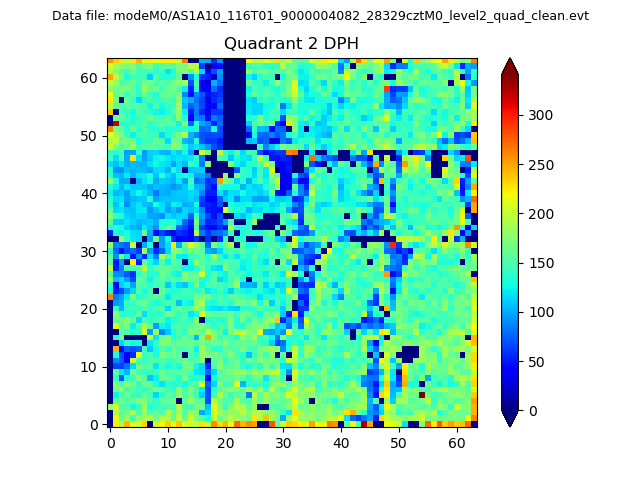
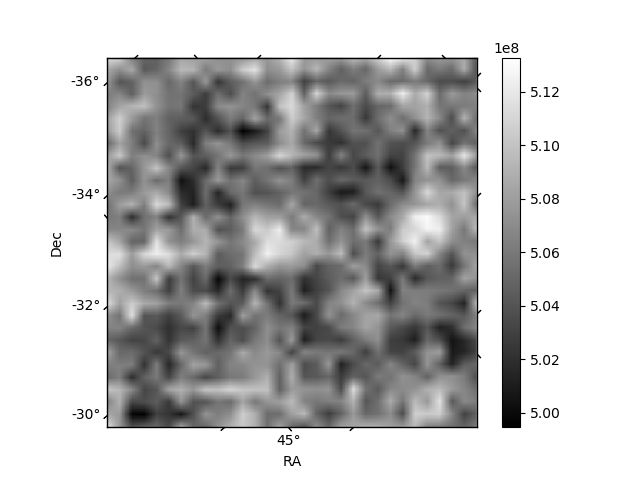
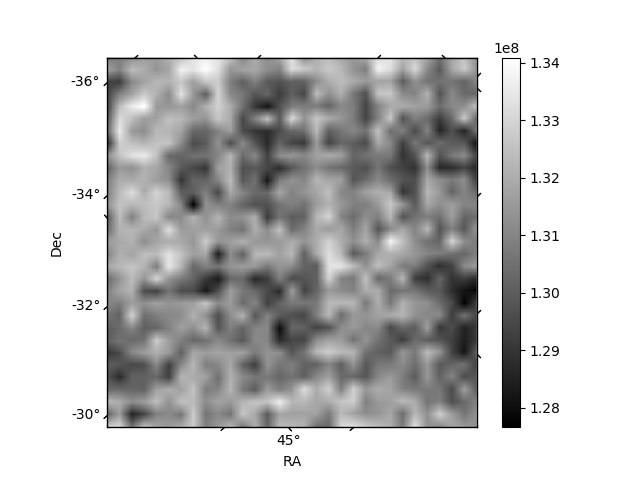
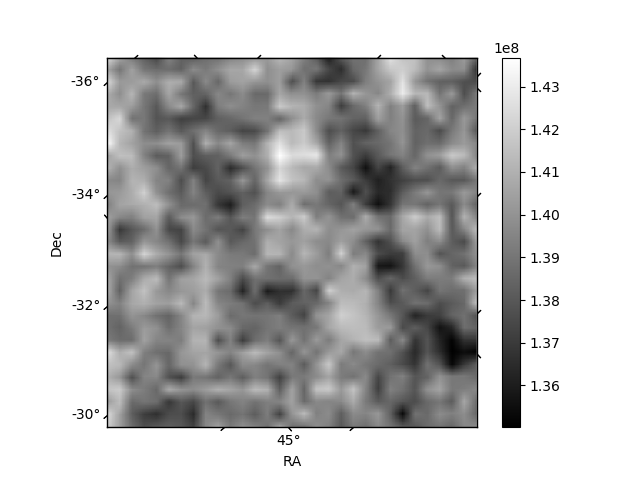
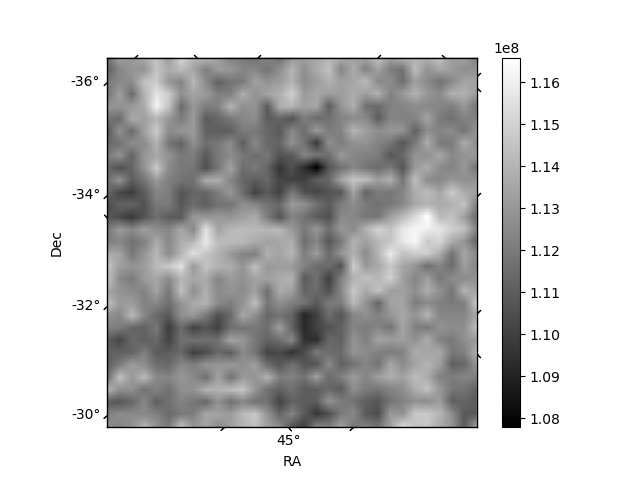
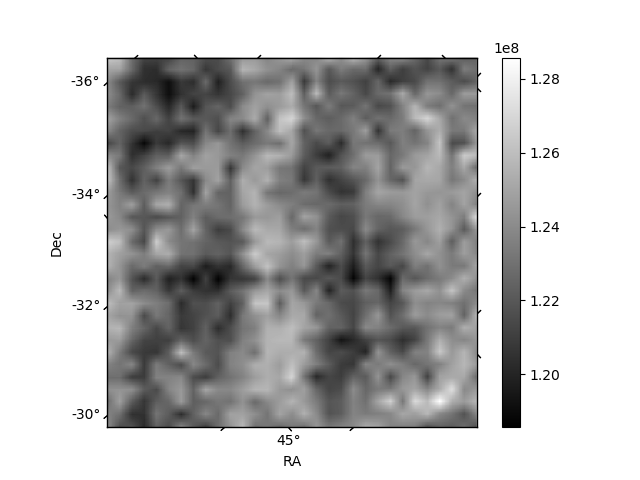
Histogram calculated using DETX and DETY for each event in the final _common_clean file
| Quadrant A | 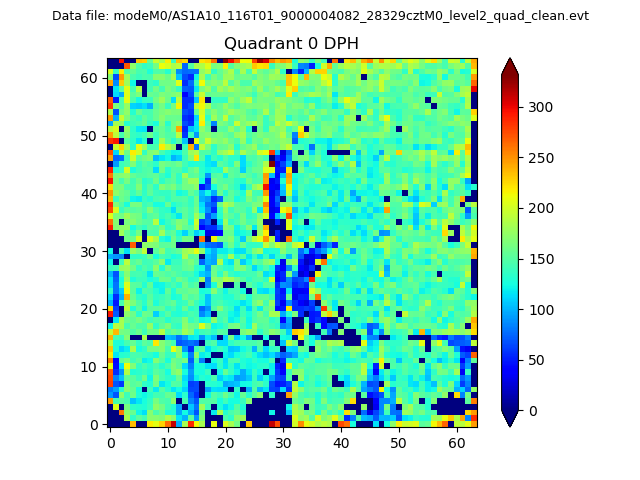 |
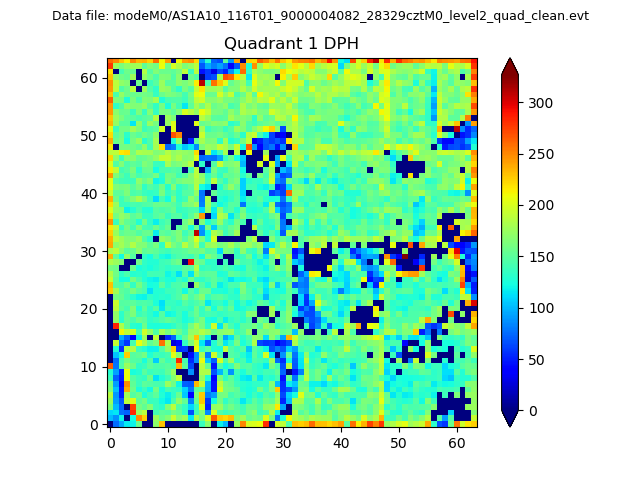 |
Quadrant B |
|---|---|---|---|
| Quadrant D | 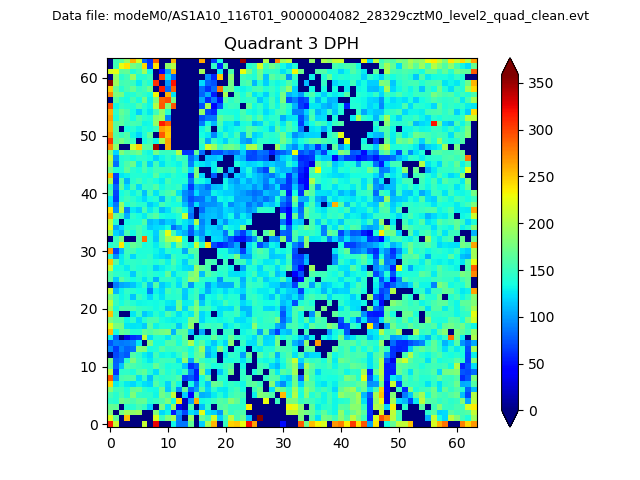 |
 |
Quadrant C |
| Plot type | Count rate plots | Images |
|---|---|---|
| Comparison with Poisson distribution Blue bars denote a histogram of data divided into 1 sec bins. Red curve is a Poisson curve with rate = median count rate of data. |
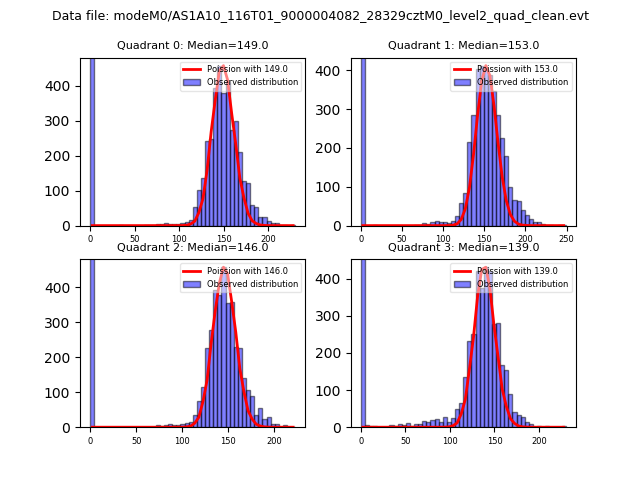 |
 |
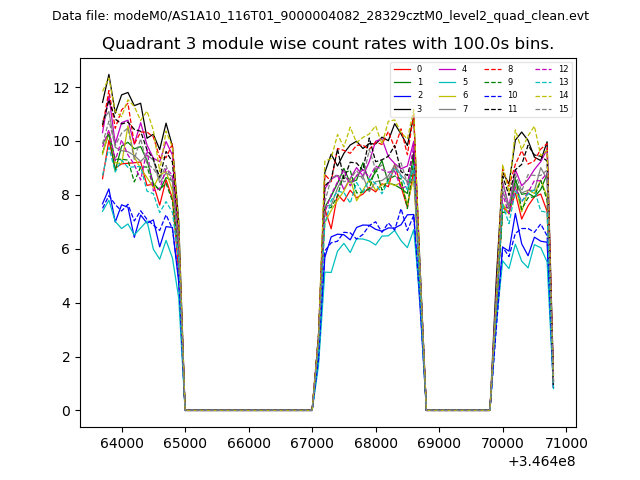
| Quadrant-wise count rates Data is divided into 100 sec bins |
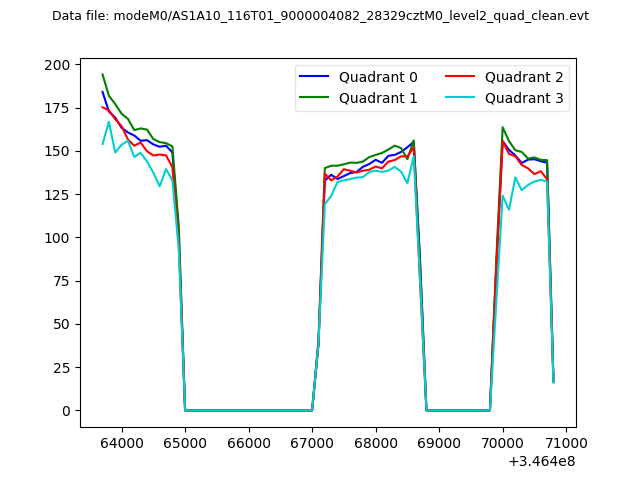 |
|
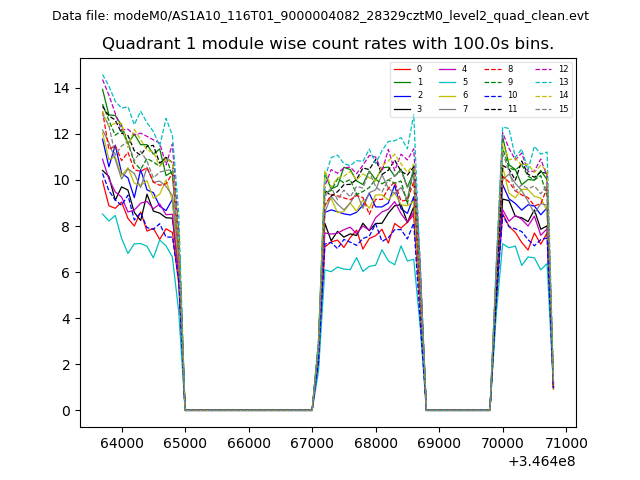
| Module-wise count rates for Quadrant A Data is divided into 100 sec bins |
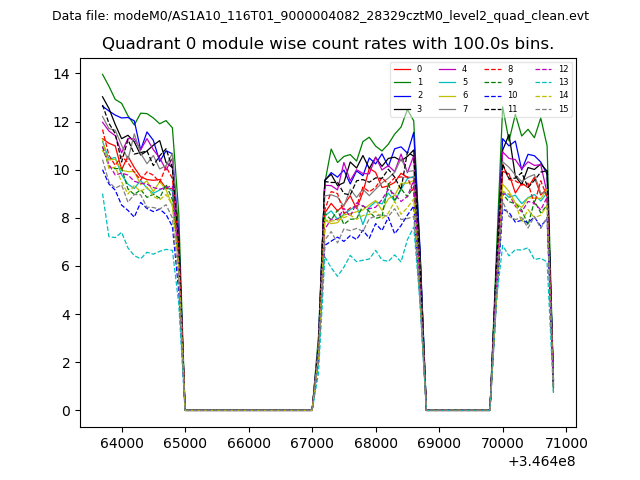 |
 |
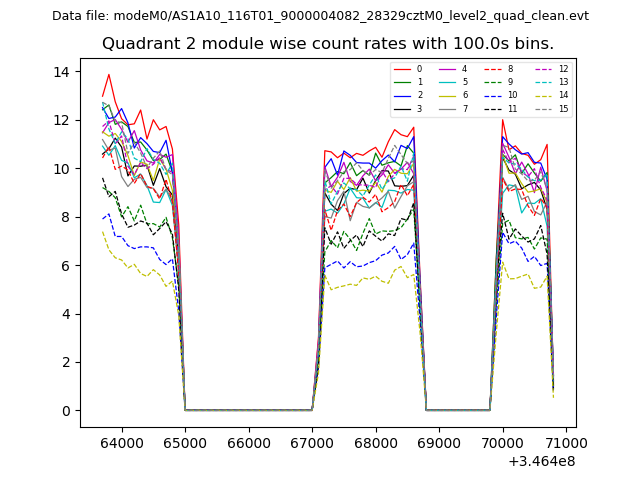
| Module-wise count rates for Quadrant B Data is divided into 100 sec bins |
 |
 |
| Module-wise count rates for Quadrant C Data is divided into 100 sec bins |
 |
 |
| Module-wise count rates for Quadrant D Data is divided into 100 sec bins |
 |
 |
| Parameter | Plot |
|---|---|
| CZT HV Monitor | 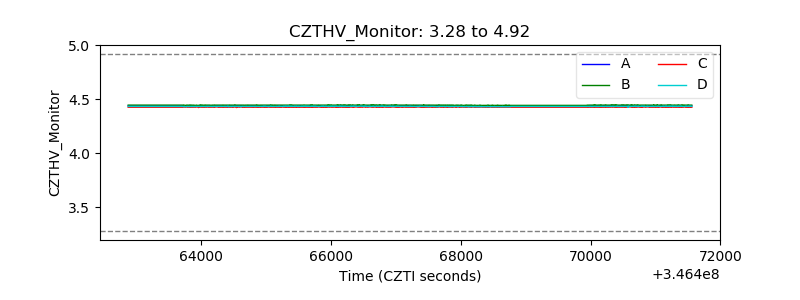 |
| D_VDD | 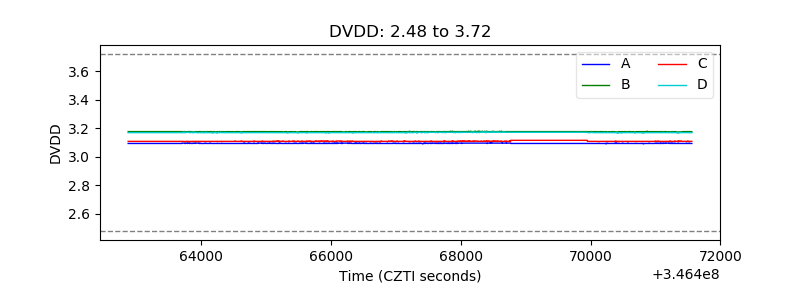 |
| Temperature 1 | 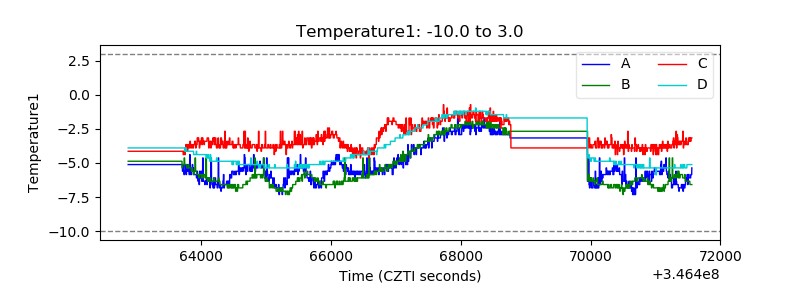 |
| Veto HV Monitor | 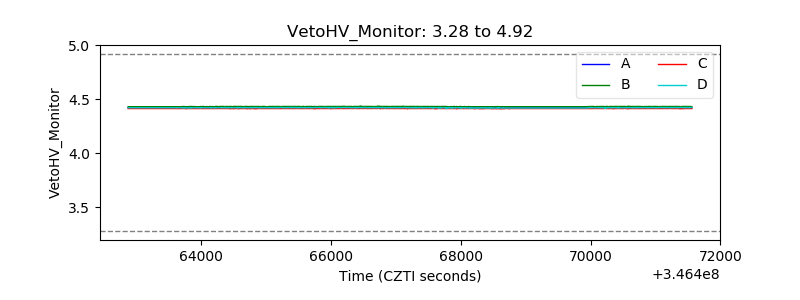 |
| Veto LLD | 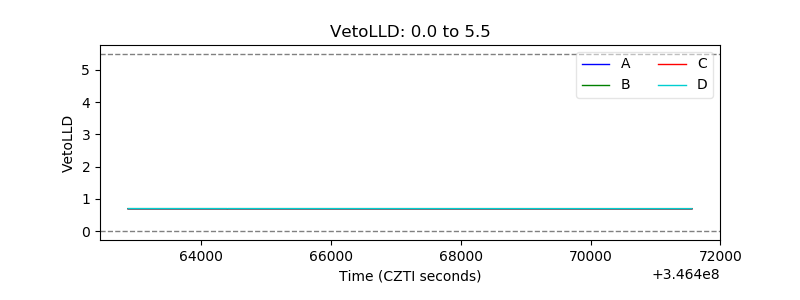 |
| Alpha Counter | 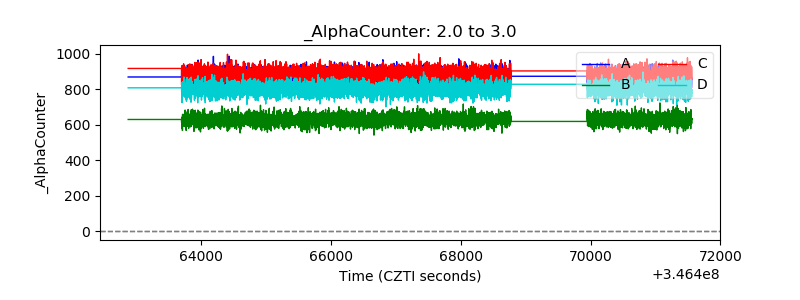 |
| _CPM_Rate | 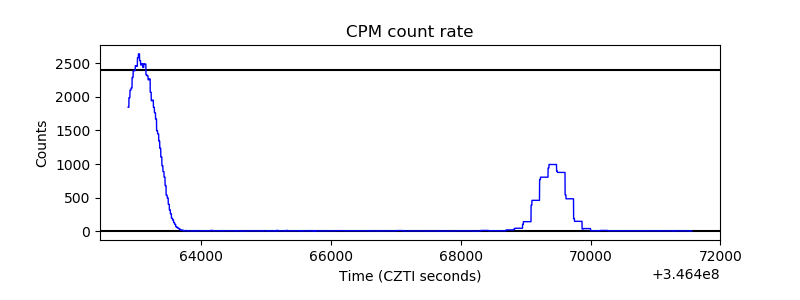 |
| CZT Counter |  |
| +2.5 Volts monitor |  |
| +5 Volts monitor |  |
| _ROLL_ROT | 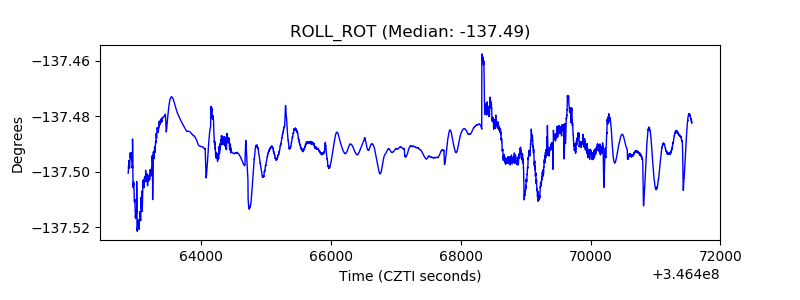 |
| _Roll_DEC | 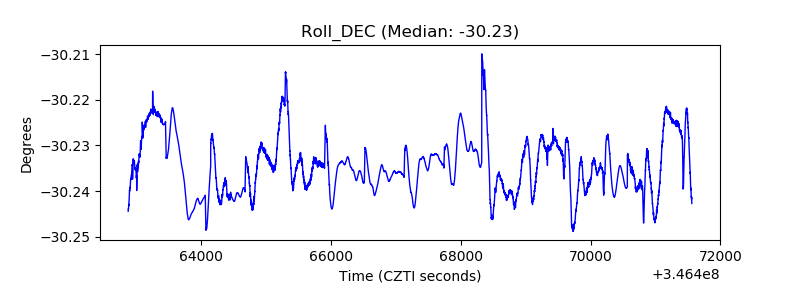 |
| _Roll_RA | 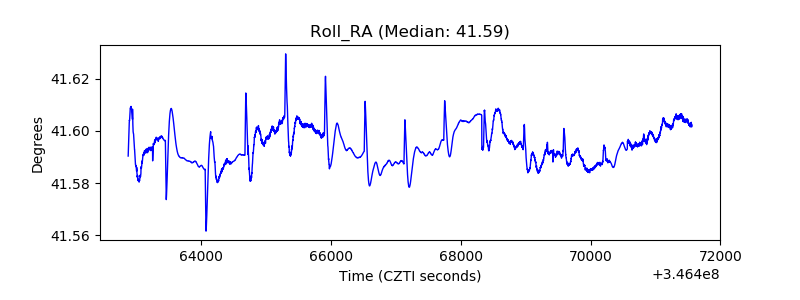 |
| Veto Counter |  |