| Param | Original file | Final file |
|---|---|---|
| Filename | modeM0/AS1A10_116T01_9000004082_28330cztM0_level2.evt | modeM0/AS1A10_116T01_9000004082_28330cztM0_level2_quad_clean.evt |
| Size (bytes) | 516,453,120 | 75,965,760 |
| Size | 492.5 MB | 72.4 MB |
| Events in quadrant A | 3,149,210 | 470,577 |
| Events in quadrant B | 3,619,729 | 478,918 |
| Events in quadrant C | 3,968,956 | 452,857 |
| Events in quadrant D | 4,454,256 | 436,624 |
| Mode M9 | |||
|---|---|---|---|
| Quadrant | BADHDUFLAG | Total packets | Discarded packets |
| A | 0 | 9 | 0 |
| B | 0 | 9 | 0 |
| C | 0 | 9 | 0 |
| D | 0 | 9 | 0 |
| Mode M0 | |||
|---|---|---|---|
| Quadrant | BADHDUFLAG | Total packets | Discarded packets |
| A | 0 | 13465 | 0 |
| B | 0 | 14775 | 0 |
| C | 0 | 15972 | 0 |
| D | 0 | 17514 | 0 |
| Quadrant | Total seconds | Saturated seconds | Saturation percentage |
|---|---|---|---|
| A | 6621 | 43 | 0.649449% |
| B | 6622 | 95 | 1.434612% |
| C | 6622 | 132 | 1.993355% |
| D | 6622 | 212 | 3.201450% |
Noise dominated data is calculated using 1-second bins in cleaned event files. If a bin has >2000 counts, and if more than 50% of those come from <1% of pixels, then it is considered to be noise-dominated and hence unusable.
| Quadrant | # 1 sec bins | Bins with >0 counts | Bins with >2000 counts | High rate bins dominated by noise | Noise dominated (total time) | Noise dominated (detector-on time) | Marked lightcurve |
|---|---|---|---|---|---|---|---|
| A | 7486 | 6622 | 0 | 0 | 0.00% | 0.00% | 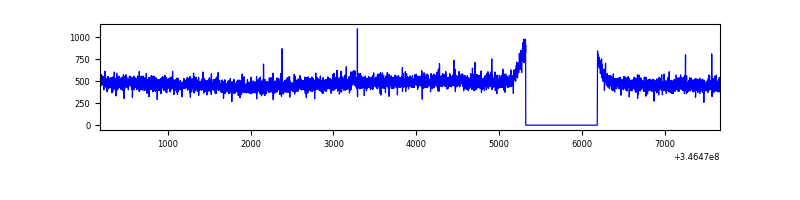 |
| B | 7487 | 6623 | 14 | 14 | 0.19% | 0.21% | 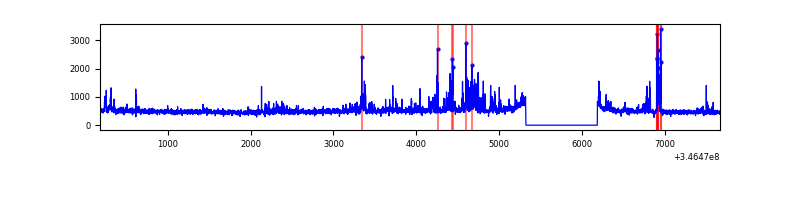 |
| C | 7487 | 6622 | 4 | 4 | 0.05% | 0.06% | 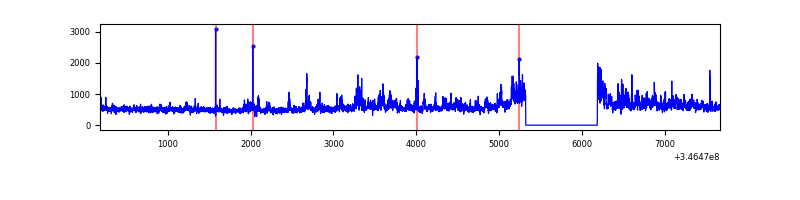 |
| D | 7487 | 6623 | 156 | 156 | 2.08% | 2.36% | 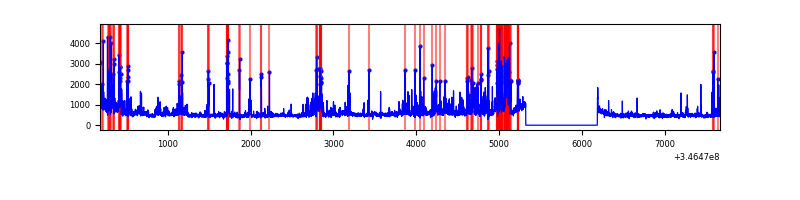 |
Top three noisy pixels from each quadrant. If the there are fewer than three noisy pixels in the level2.evt file, extra rows are filled as -1
| Pixel properties | Quadrant properties | ||||||
|---|---|---|---|---|---|---|---|
| Quadrant | DetID | PixID | Counts | Sigma | Mean | Median | Sigma |
| A | 13 | 254 | 9944 | 55.83 | 814 | 797 | 163.8 |
| A | 3 | 137 | 8063 | 44.35 | 814 | 797 | 163.8 |
| A | 0 | 226 | 6826 | 36.8 | 814 | 797 | 163.8 |
| B | 10 | 245 | 359798 | 2297.62 | 813 | 794 | 156.3 |
| B | 0 | 183 | 26421 | 164.01 | 813 | 794 | 156.3 |
| B | 10 | 246 | 21529 | 132.7 | 813 | 794 | 156.3 |
| C | 3 | 233 | 782882 | 4281.61 | 785 | 791 | 182.7 |
| C | 14 | 238 | 125040 | 680.21 | 785 | 791 | 182.7 |
| C | 13 | 61 | 5320 | 24.79 | 785 | 791 | 182.7 |
| D | 1 | 52 | 1160368 | 6191.5 | 783 | 762 | 187.3 |
| D | 8 | 195 | 255740 | 1361.41 | 783 | 762 | 187.3 |
| D | 7 | 238 | 28216 | 146.59 | 783 | 762 | 187.3 |
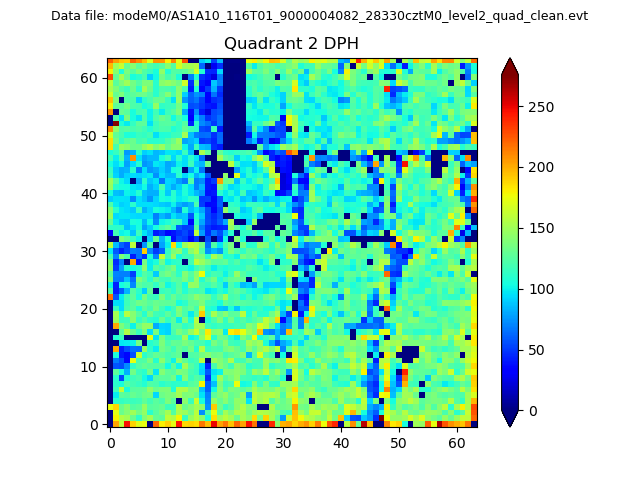
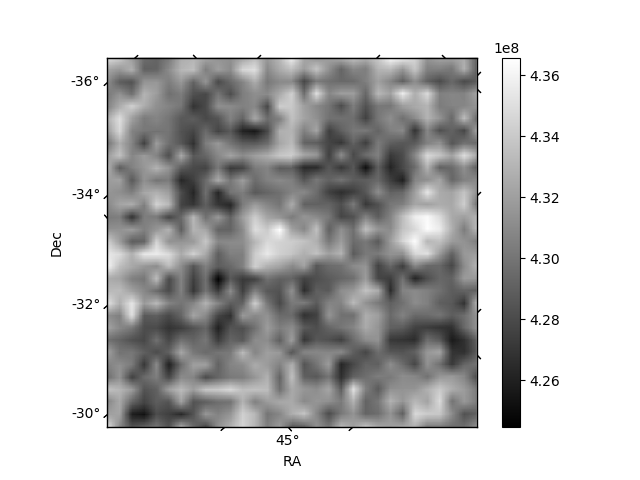
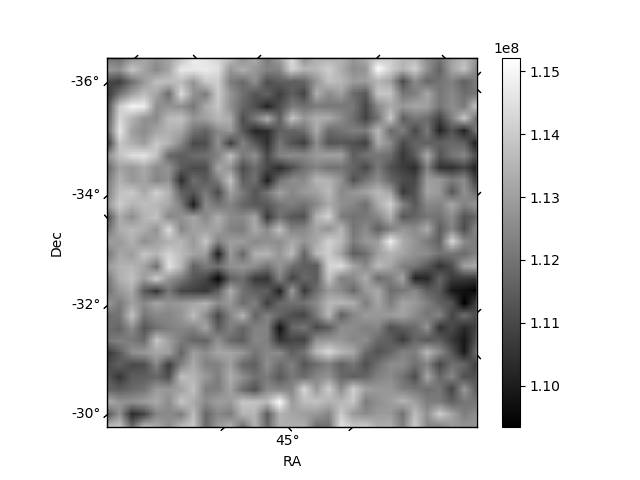
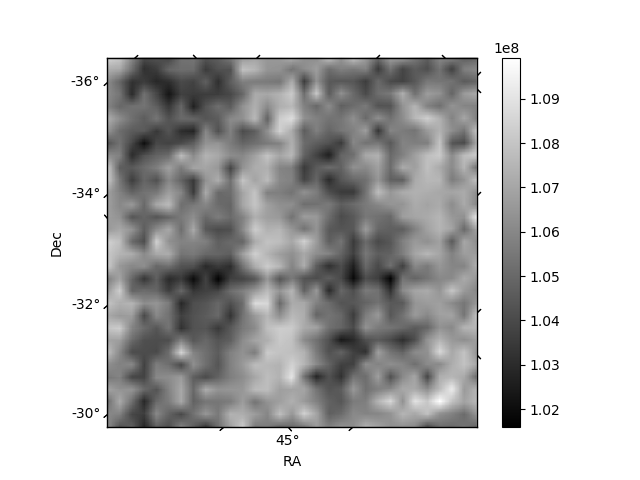
Histogram calculated using DETX and DETY for each event in the final _common_clean file
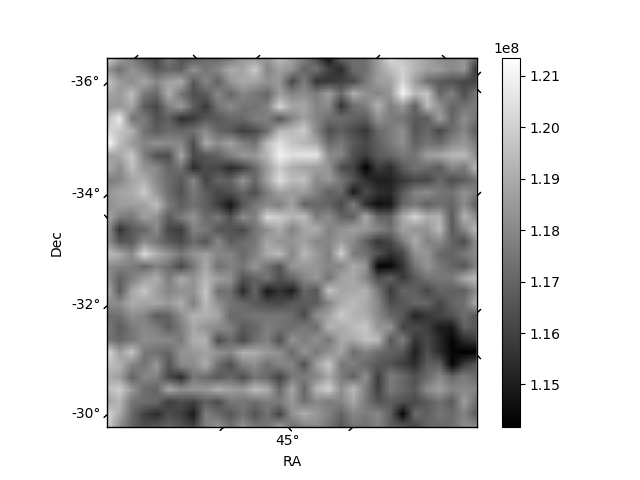
| Quadrant A | 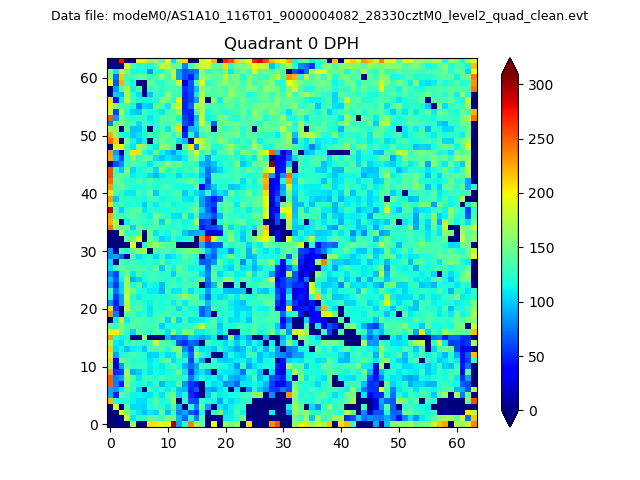 |
 |
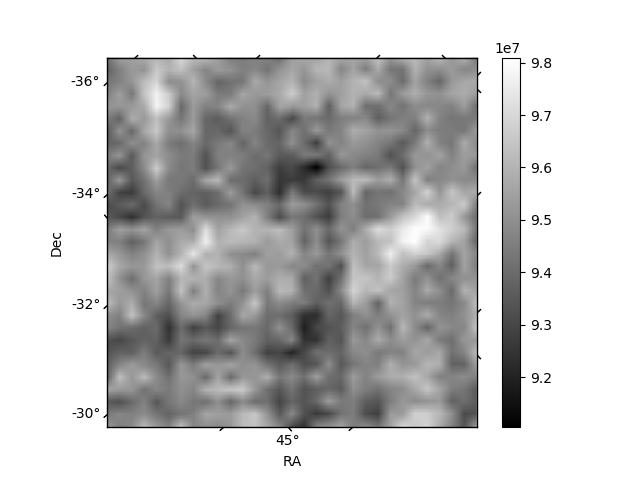
Quadrant B |
|---|---|---|---|
| Quadrant D | 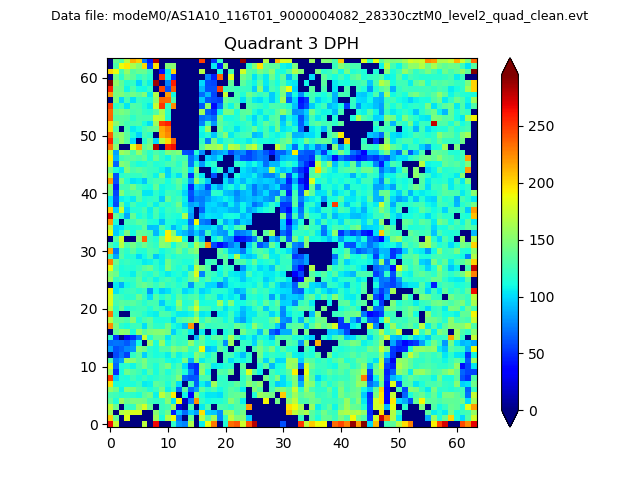 |
 |
Quadrant C |
| Plot type | Count rate plots | Images |
|---|---|---|
| Comparison with Poisson distribution Blue bars denote a histogram of data divided into 1 sec bins. Red curve is a Poisson curve with rate = median count rate of data. |
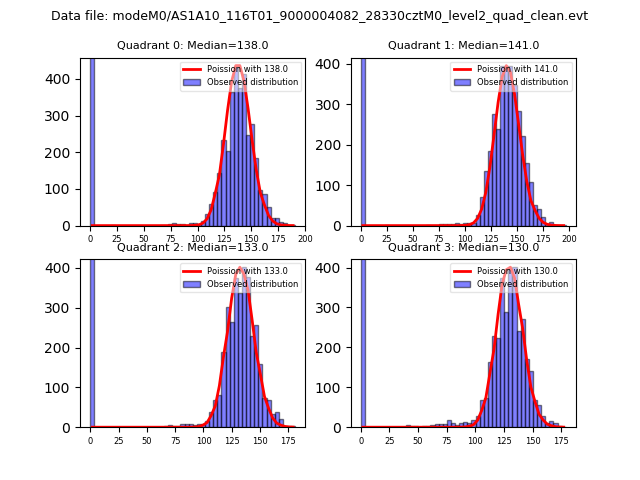 |
 |
| Quadrant-wise count rates Data is divided into 100 sec bins |
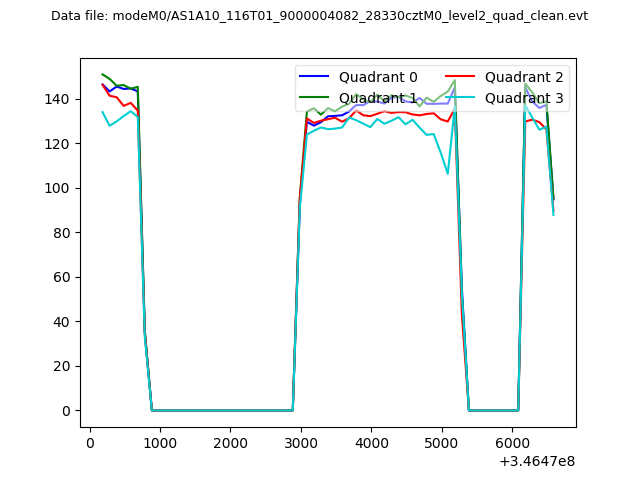 |
|
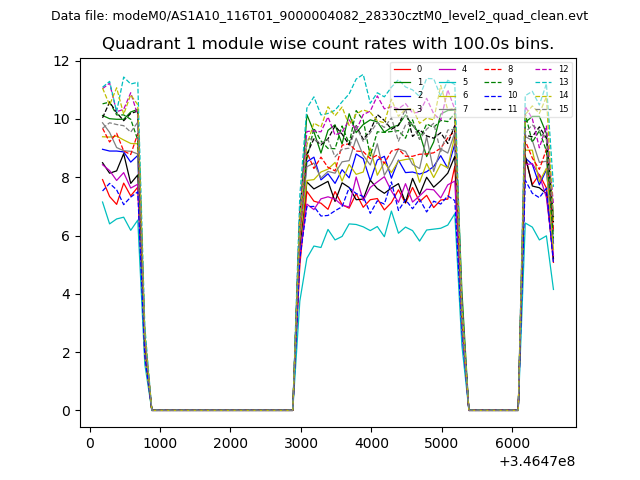
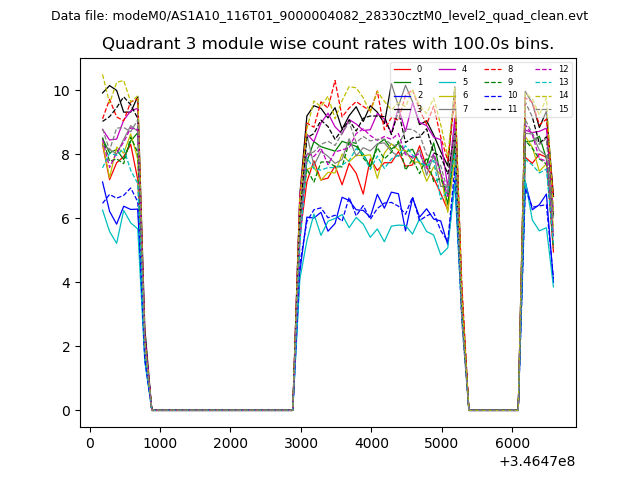
| Module-wise count rates for Quadrant A Data is divided into 100 sec bins |
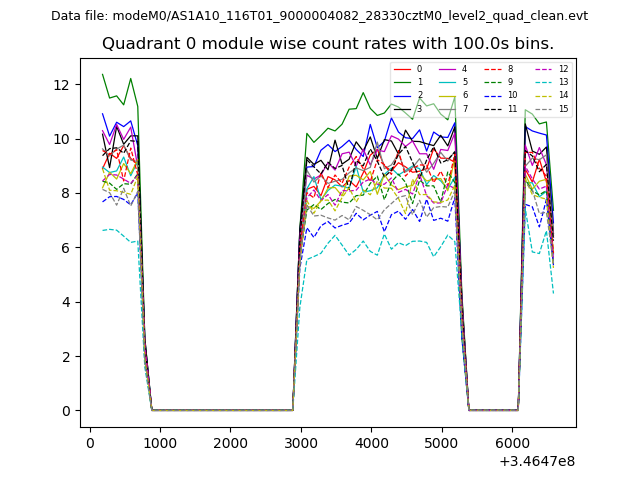 |
 |
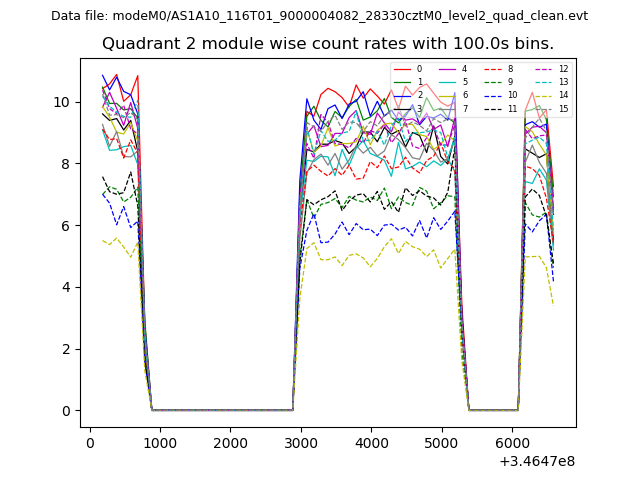
| Module-wise count rates for Quadrant B Data is divided into 100 sec bins |
 |
 |
| Module-wise count rates for Quadrant C Data is divided into 100 sec bins |
 |
 |
| Module-wise count rates for Quadrant D Data is divided into 100 sec bins |
 |
 |
| Parameter | Plot |
|---|---|
| CZT HV Monitor | 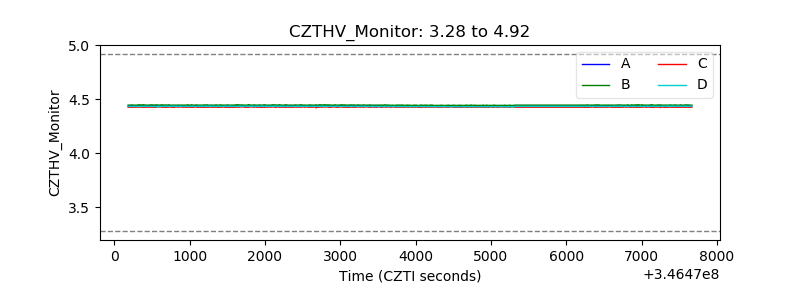 |
| D_VDD | 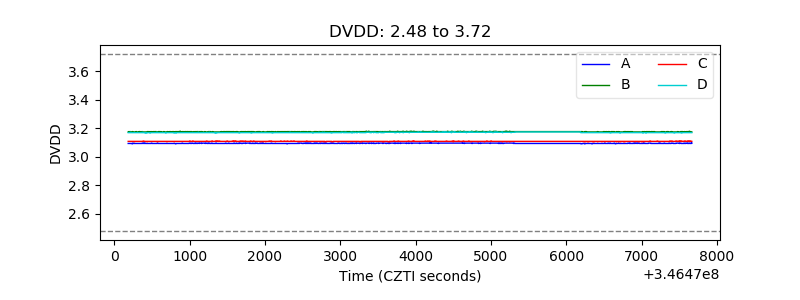 |
| Temperature 1 | 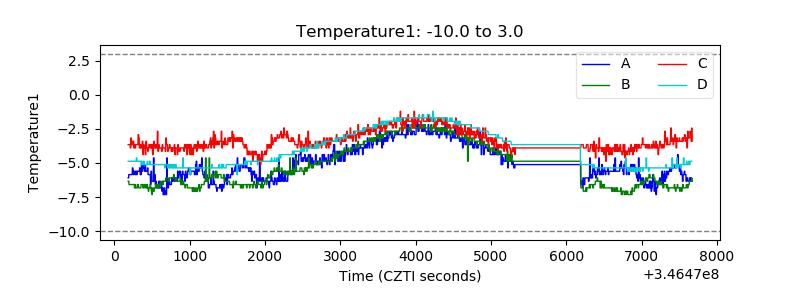 |
| Veto HV Monitor | 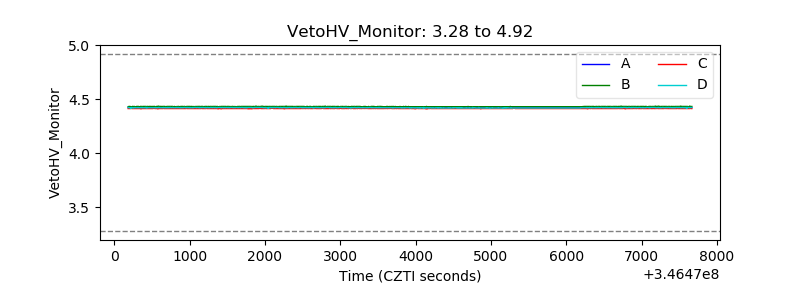 |
| Veto LLD | 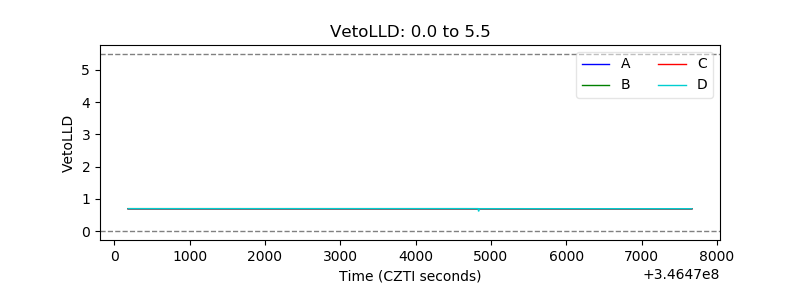 |
| Alpha Counter | 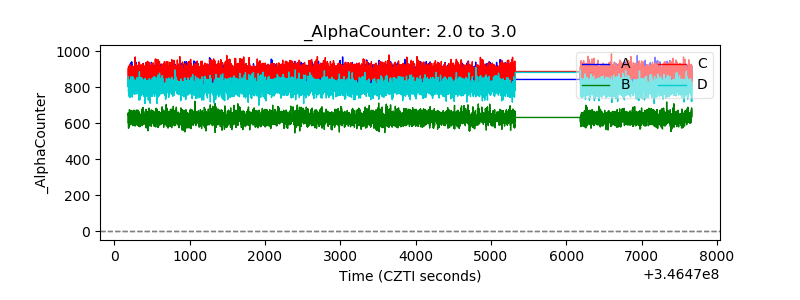 |
| _CPM_Rate | 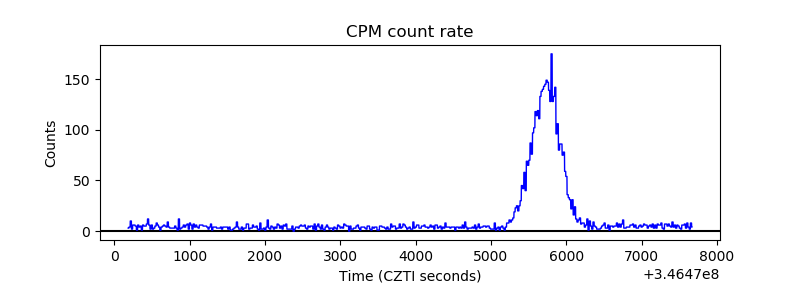 |
| CZT Counter | 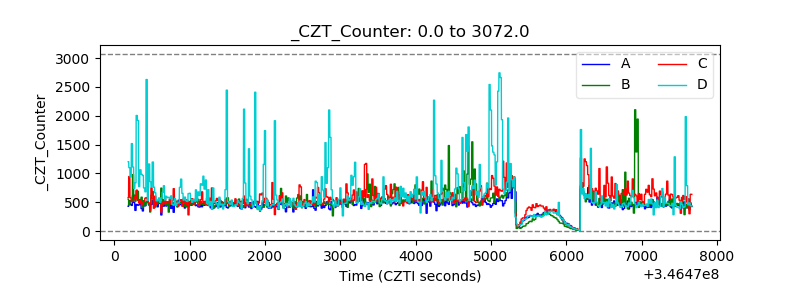 |
| +2.5 Volts monitor |  |
| +5 Volts monitor |  |
| _ROLL_ROT | 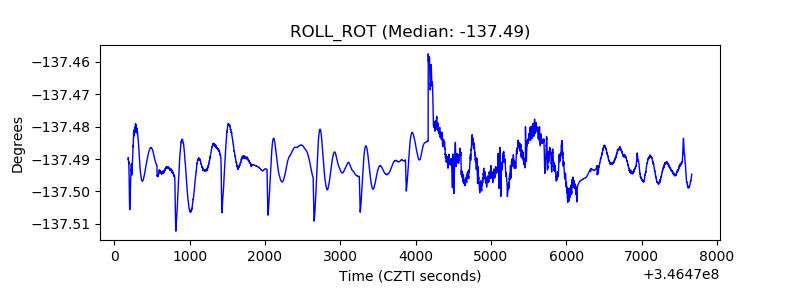 |
| _Roll_DEC | 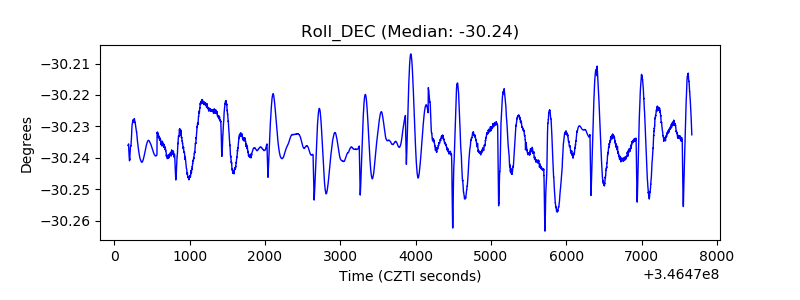 |
| _Roll_RA | 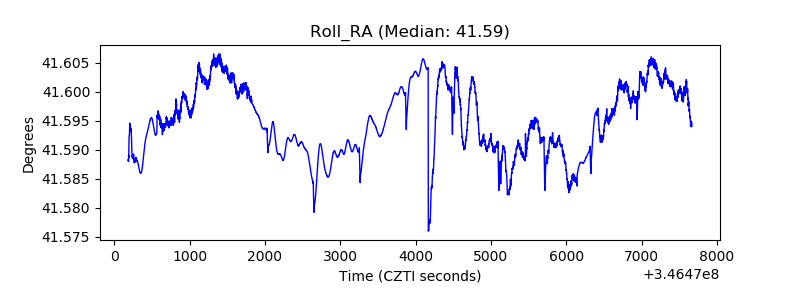 |
| Veto Counter | 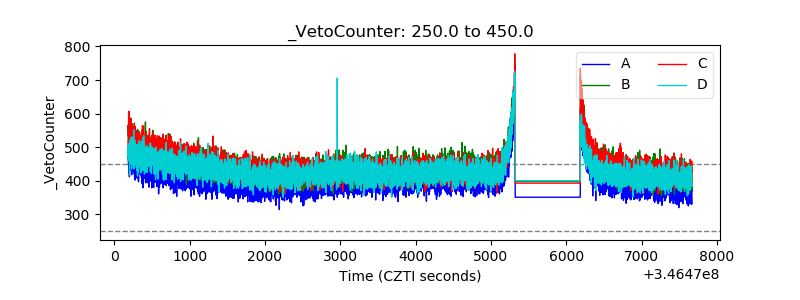 |