| Param | Original file | Final file |
|---|---|---|
| Filename | modeM0/AS1A10_116T01_9000004082_28331cztM0_level2.evt | modeM0/AS1A10_116T01_9000004082_28331cztM0_level2_quad_clean.evt |
| Size (bytes) | 611,228,160 | 83,200,320 |
| Size | 582.9 MB | 79.3 MB |
| Events in quadrant A | 3,590,622 | 513,113 |
| Events in quadrant B | 4,225,429 | 518,700 |
| Events in quadrant C | 4,797,317 | 490,992 |
| Events in quadrant D | 5,391,053 | 475,775 |
| Mode M9 | |||
|---|---|---|---|
| Quadrant | BADHDUFLAG | Total packets | Discarded packets |
| A | 0 | 4 | 0 |
| B | 0 | 5 | 0 |
| C | 0 | 5 | 0 |
| D | 0 | 5 | 0 |
| Mode M0 | |||
|---|---|---|---|
| Quadrant | BADHDUFLAG | Total packets | Discarded packets |
| A | 0 | 15569 | 0 |
| B | 0 | 17245 | 0 |
| C | 0 | 19304 | 0 |
| D | 0 | 20973 | 0 |
| Quadrant | Total seconds | Saturated seconds | Saturation percentage |
|---|---|---|---|
| A | 7478 | 146 | 1.952394% |
| B | 7478 | 281 | 3.757689% |
| C | 7478 | 272 | 3.637336% |
| D | 7478 | 351 | 4.693768% |
Noise dominated data is calculated using 1-second bins in cleaned event files. If a bin has >2000 counts, and if more than 50% of those come from <1% of pixels, then it is considered to be noise-dominated and hence unusable.
| Quadrant | # 1 sec bins | Bins with >0 counts | Bins with >2000 counts | High rate bins dominated by noise | Noise dominated (total time) | Noise dominated (detector-on time) | Marked lightcurve |
|---|---|---|---|---|---|---|---|
| A | 7753 | 7480 | 0 | 0 | 0.00% | 0.00% | 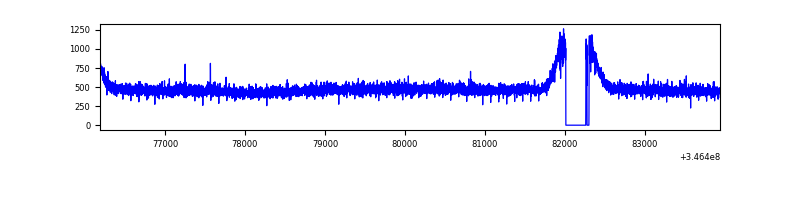 |
| B | 7753 | 7480 | 65 | 65 | 0.84% | 0.87% | 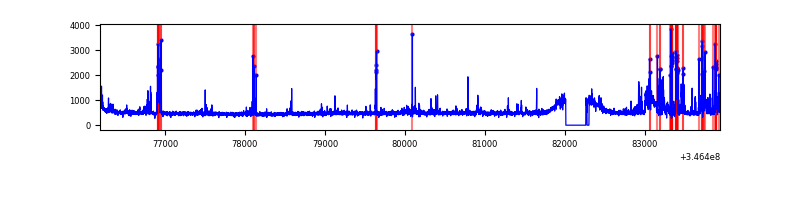 |
| C | 7753 | 7480 | 2 | 2 | 0.03% | 0.03% | 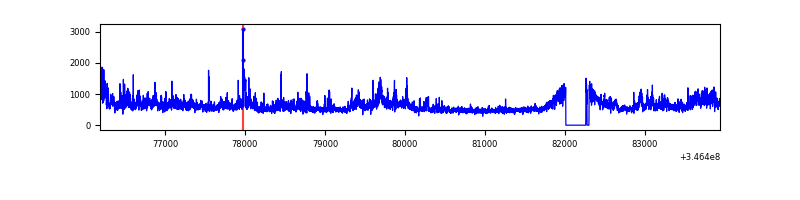 |
| D | 7753 | 7480 | 192 | 192 | 2.48% | 2.57% | 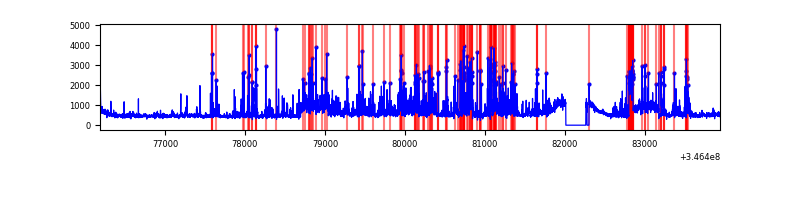 |
Top three noisy pixels from each quadrant. If the there are fewer than three noisy pixels in the level2.evt file, extra rows are filled as -1
| Pixel properties | Quadrant properties | ||||||
|---|---|---|---|---|---|---|---|
| Quadrant | DetID | PixID | Counts | Sigma | Mean | Median | Sigma |
| A | 13 | 254 | 11719 | 57.42 | 931 | 910 | 188.2 |
| A | 3 | 137 | 9307 | 44.61 | 931 | 910 | 188.2 |
| A | 0 | 226 | 7832 | 36.77 | 931 | 910 | 188.2 |
| B | 10 | 245 | 428423 | 2378.94 | 923 | 899 | 179.7 |
| B | 10 | 246 | 131764 | 728.19 | 923 | 899 | 179.7 |
| B | 0 | 183 | 24252 | 129.95 | 923 | 899 | 179.7 |
| C | 3 | 233 | 1165168 | 5449.34 | 896 | 901 | 213.7 |
| C | 14 | 238 | 141134 | 656.36 | 896 | 901 | 213.7 |
| C | 13 | 61 | 6037 | 24.04 | 896 | 901 | 213.7 |
| D | 1 | 52 | 1388412 | 6441.21 | 895 | 870 | 215.4 |
| D | 8 | 195 | 421949 | 1954.72 | 895 | 870 | 215.4 |
| D | 2 | 250 | 118049 | 543.97 | 895 | 870 | 215.4 |
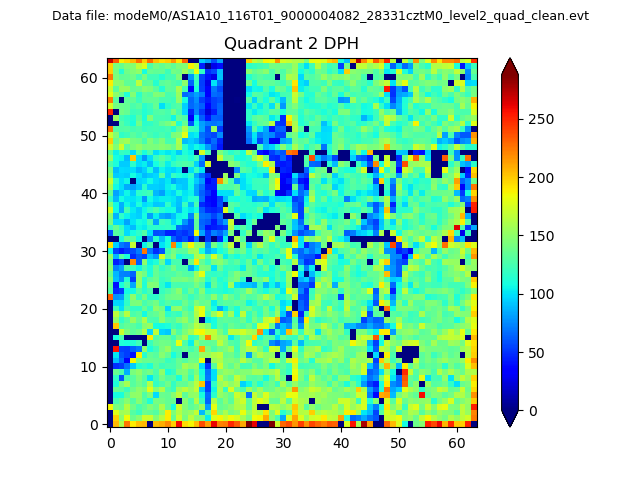
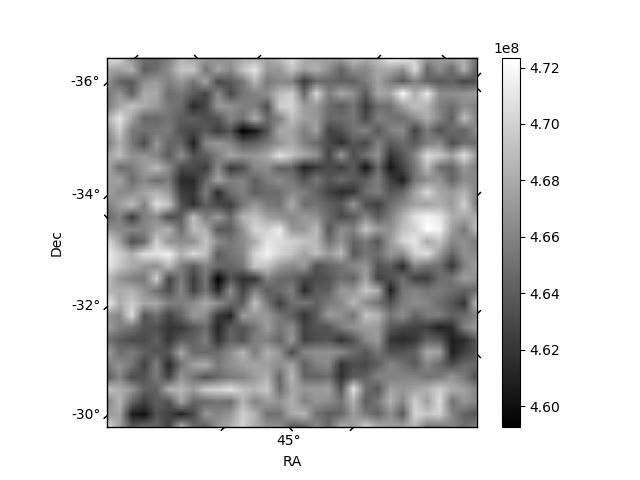
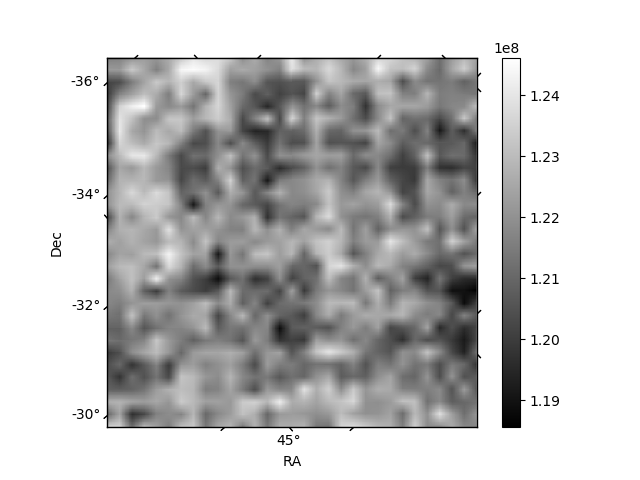
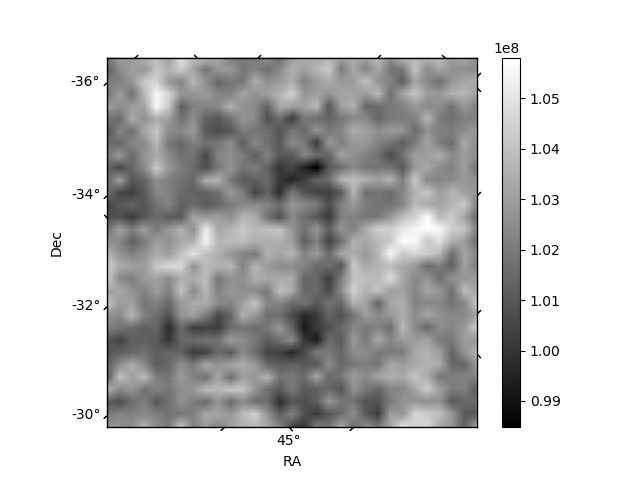
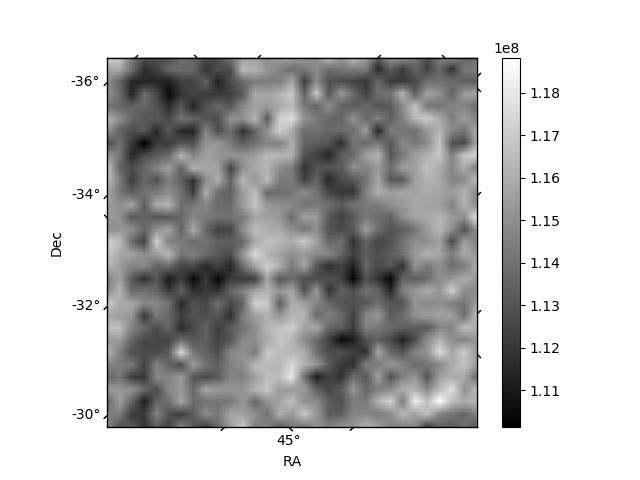
Histogram calculated using DETX and DETY for each event in the final _common_clean file
| Quadrant A | 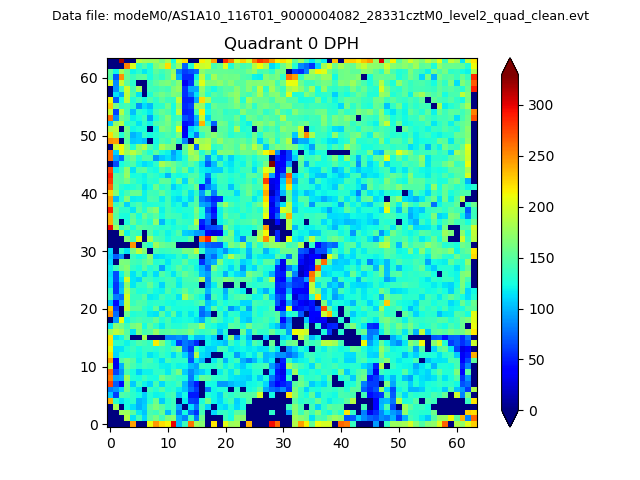 |
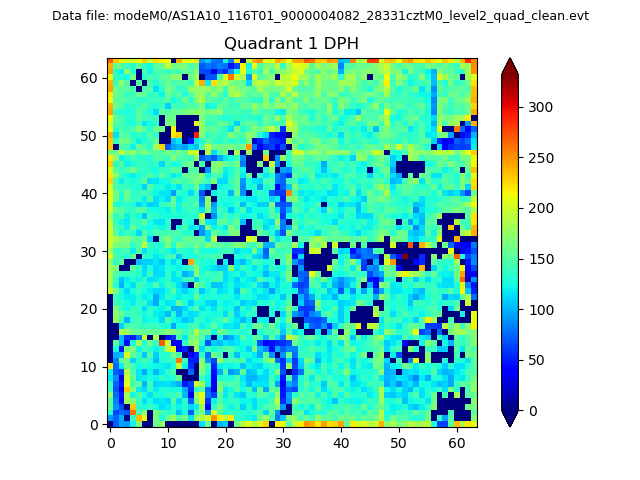 |
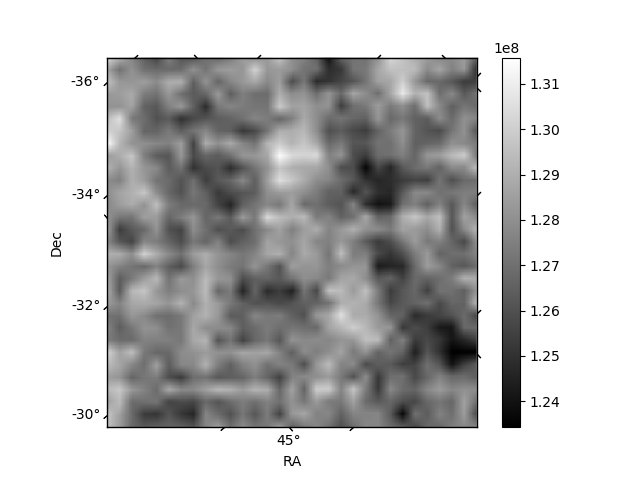
Quadrant B |
|---|---|---|---|
| Quadrant D | 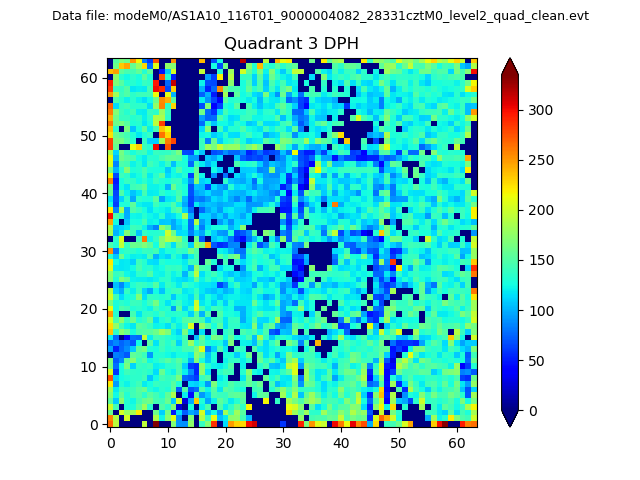 |
 |
Quadrant C |
| Plot type | Count rate plots | Images |
|---|---|---|
| Comparison with Poisson distribution Blue bars denote a histogram of data divided into 1 sec bins. Red curve is a Poisson curve with rate = median count rate of data. |
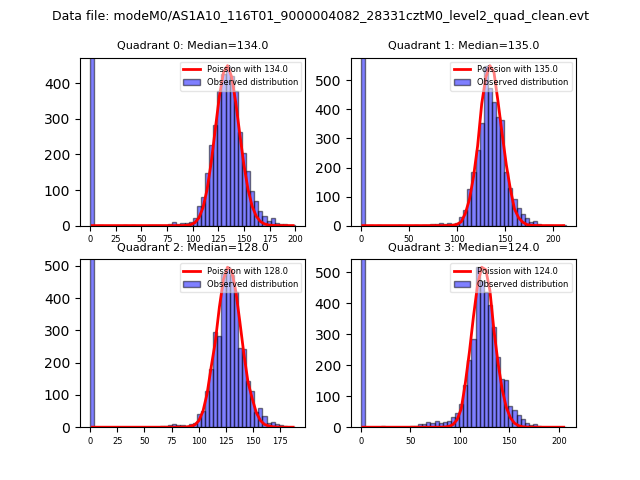 |
 |
| Quadrant-wise count rates Data is divided into 100 sec bins |
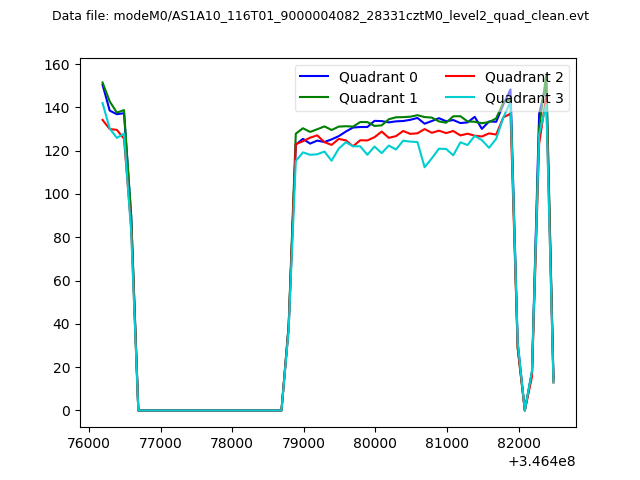 |
|
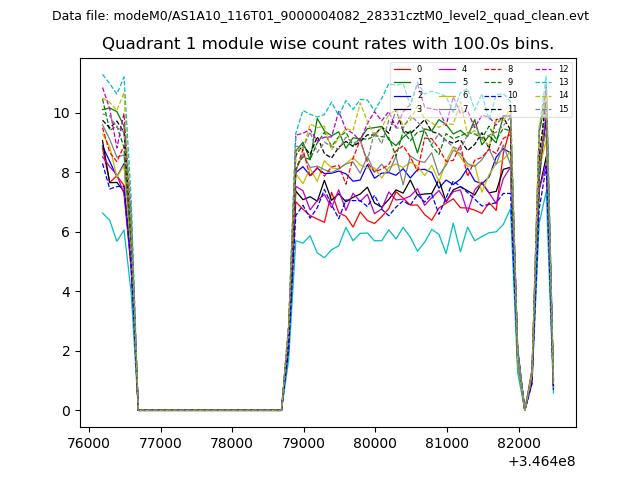
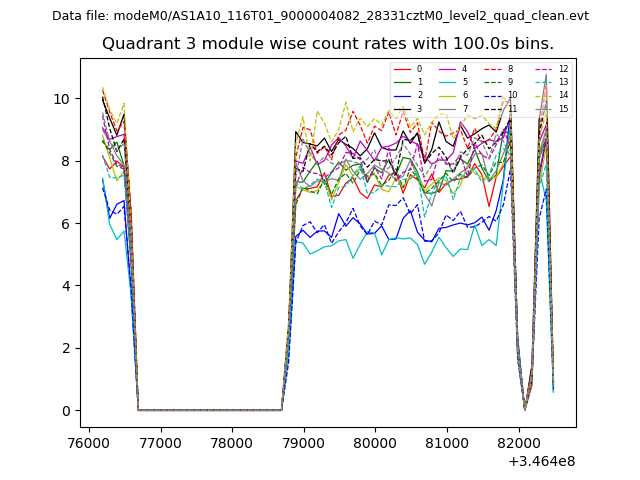
| Module-wise count rates for Quadrant A Data is divided into 100 sec bins |
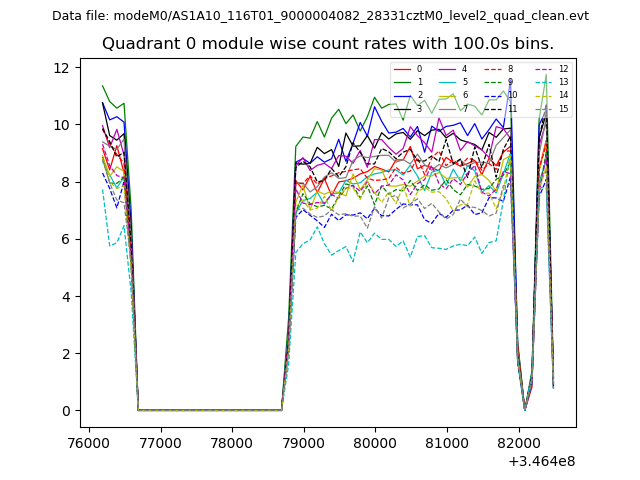 |
 |
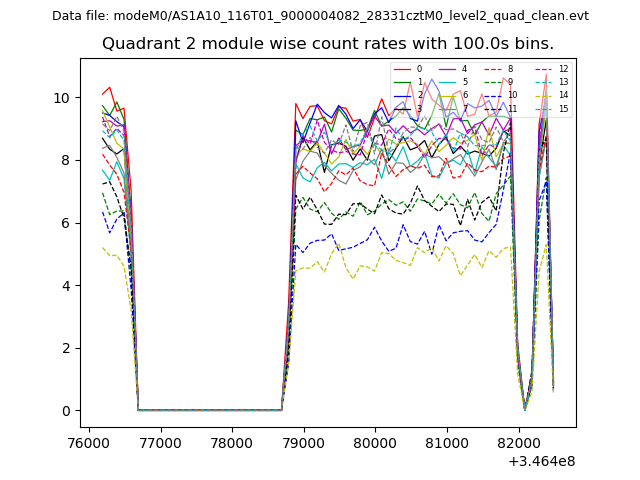
| Module-wise count rates for Quadrant B Data is divided into 100 sec bins |
 |
 |
| Module-wise count rates for Quadrant C Data is divided into 100 sec bins |
 |
 |
| Module-wise count rates for Quadrant D Data is divided into 100 sec bins |
 |
 |
| Parameter | Plot |
|---|---|
| CZT HV Monitor | 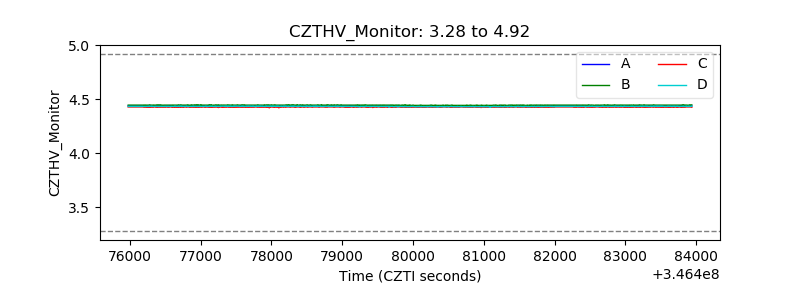 |
| D_VDD | 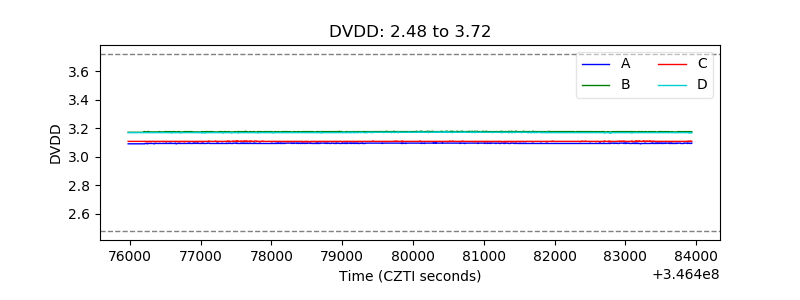 |
| Temperature 1 | 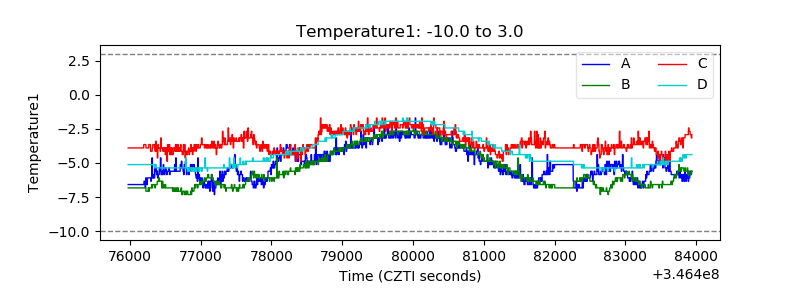 |
| Veto HV Monitor | 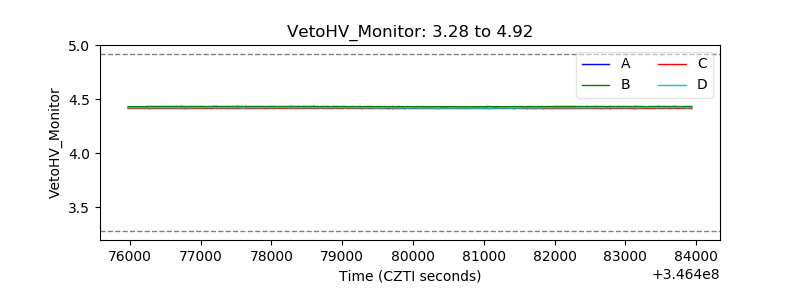 |
| Veto LLD | 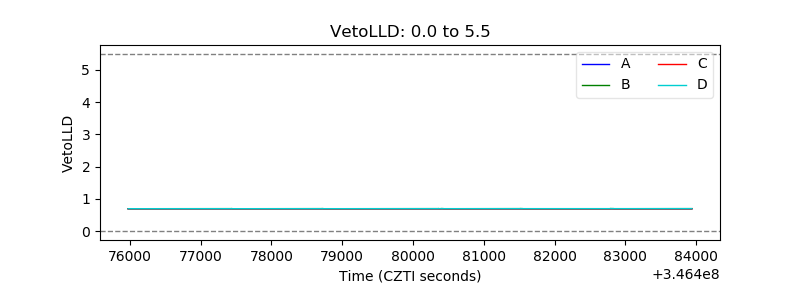 |
| Alpha Counter | 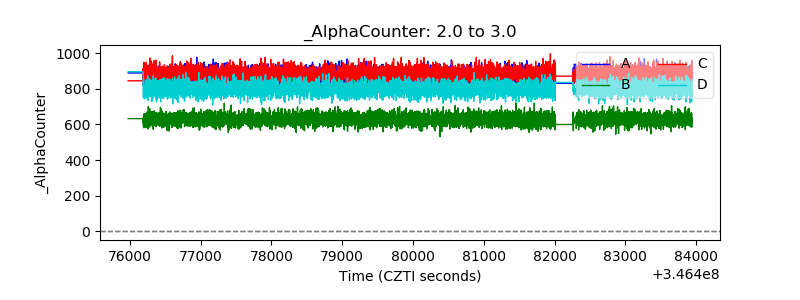 |
| _CPM_Rate | 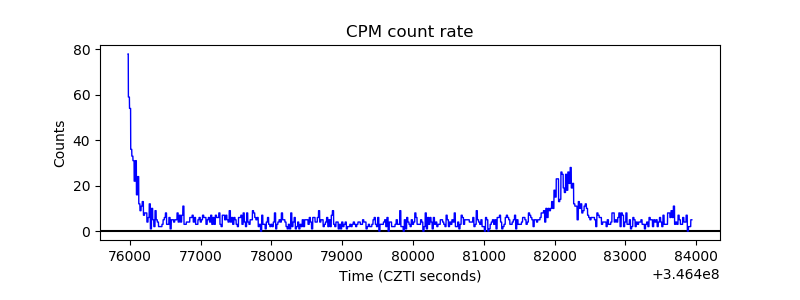 |
| CZT Counter | 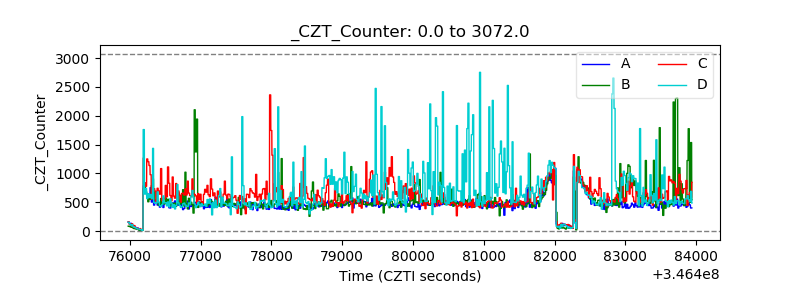 |
| +2.5 Volts monitor |  |
| +5 Volts monitor | 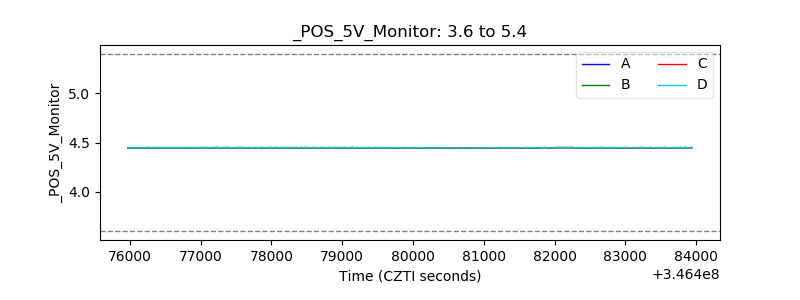 |
| _ROLL_ROT | 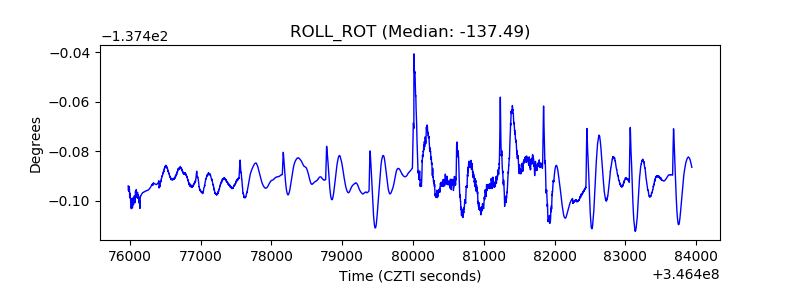 |
| _Roll_DEC | 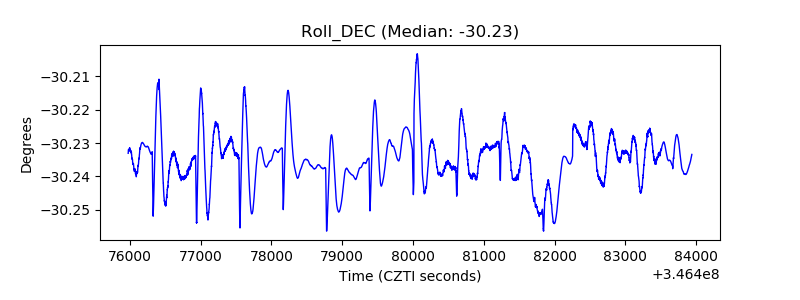 |
| _Roll_RA | 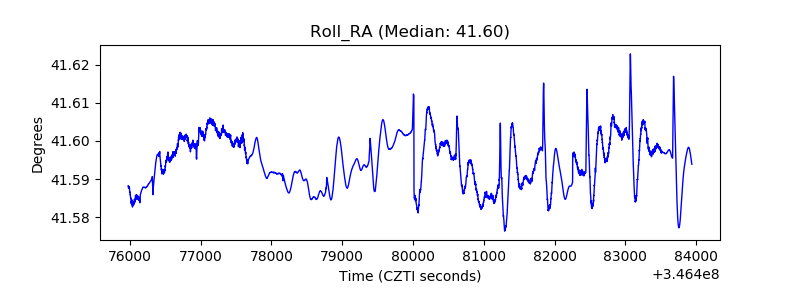 |
| Veto Counter | 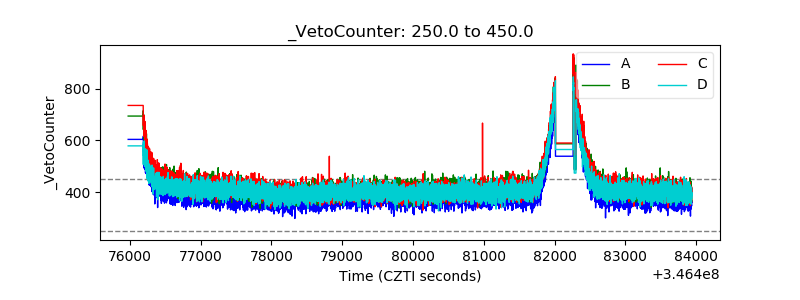 |