| Param | Original file | Final file |
|---|---|---|
| Filename | modeM0/AS1A10_116T01_9000004082_28332cztM0_level2.evt | modeM0/AS1A10_116T01_9000004082_28332cztM0_level2_quad_clean.evt |
| Size (bytes) | 656,167,680 | 76,694,400 |
| Size | 625.8 MB | 73.1 MB |
| Events in quadrant A | 3,597,183 | 466,684 |
| Events in quadrant B | 4,937,299 | 456,814 |
| Events in quadrant C | 4,393,182 | 450,474 |
| Events in quadrant D | 6,434,721 | 424,208 |
| Mode M9 | |||
|---|---|---|---|
| Quadrant | BADHDUFLAG | Total packets | Discarded packets |
| A | 0 | 1 | 0 |
| B | 0 | 1 | 0 |
| C | 0 | 1 | 0 |
| D | 0 | 1 | 0 |
| Mode M0 | |||
|---|---|---|---|
| Quadrant | BADHDUFLAG | Total packets | Discarded packets |
| A | 0 | 15705 | 0 |
| B | 0 | 19475 | 0 |
| C | 0 | 17785 | 0 |
| D | 0 | 24136 | 0 |
| Quadrant | Total seconds | Saturated seconds | Saturation percentage |
|---|---|---|---|
| A | 7531 | 163 | 2.164387% |
| B | 7532 | 552 | 7.328731% |
| C | 7532 | 277 | 3.677642% |
| D | 7532 | 524 | 6.956984% |
Noise dominated data is calculated using 1-second bins in cleaned event files. If a bin has >2000 counts, and if more than 50% of those come from <1% of pixels, then it is considered to be noise-dominated and hence unusable.
| Quadrant | # 1 sec bins | Bins with >0 counts | Bins with >2000 counts | High rate bins dominated by noise | Noise dominated (total time) | Noise dominated (detector-on time) | Marked lightcurve |
|---|---|---|---|---|---|---|---|
| A | 7561 | 7532 | 0 | 0 | 0.00% | 0.00% |  |
| B | 7562 | 7533 | 239 | 239 | 3.16% | 3.17% |  |
| C | 7562 | 7533 | 0 | 0 | 0.00% | 0.00% |  |
| D | 7562 | 7533 | 343 | 343 | 4.54% | 4.55% |  |
Top three noisy pixels from each quadrant. If the there are fewer than three noisy pixels in the level2.evt file, extra rows are filled as -1
| Pixel properties | Quadrant properties | ||||||
|---|---|---|---|---|---|---|---|
| Quadrant | DetID | PixID | Counts | Sigma | Mean | Median | Sigma |
| A | 13 | 254 | 11932 | 58.28 | 930 | 908 | 189.2 |
| A | 3 | 137 | 9484 | 45.34 | 930 | 908 | 189.2 |
| A | 0 | 226 | 7797 | 36.42 | 930 | 908 | 189.2 |
| B | 10 | 245 | 1286341 | 7172.6 | 908 | 883 | 179.2 |
| B | 10 | 246 | 78516 | 433.18 | 908 | 883 | 179.2 |
| B | 12 | 111 | 22775 | 122.15 | 908 | 883 | 179.2 |
| C | 3 | 233 | 755932 | 3547.7 | 895 | 899 | 212.8 |
| C | 14 | 238 | 141584 | 661.04 | 895 | 899 | 212.8 |
| C | 13 | 61 | 5975 | 23.85 | 895 | 899 | 212.8 |
| D | 1 | 52 | 2087195 | 9731.32 | 891 | 867 | 214.4 |
| D | 8 | 195 | 588083 | 2738.97 | 891 | 867 | 214.4 |
| D | 2 | 250 | 235165 | 1092.84 | 891 | 867 | 214.4 |
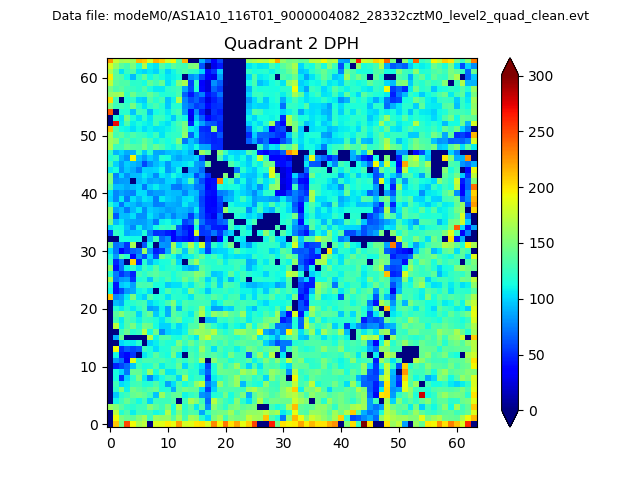
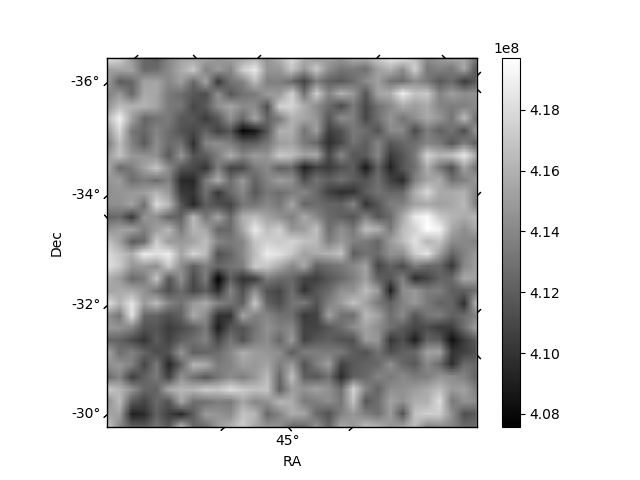
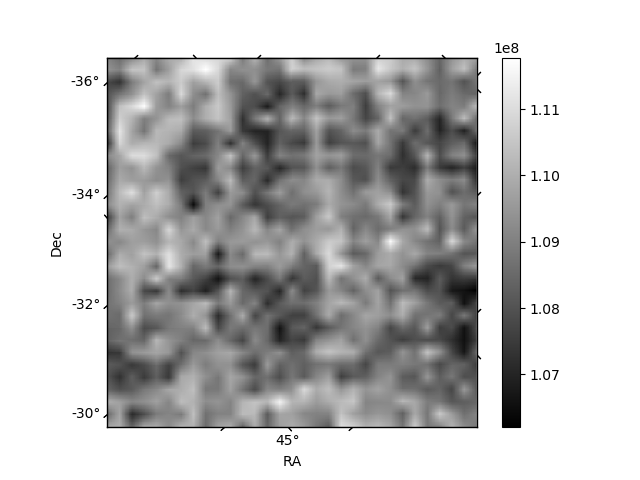
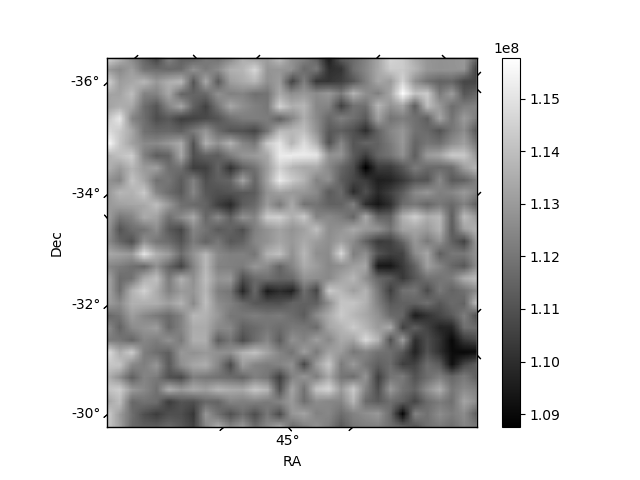
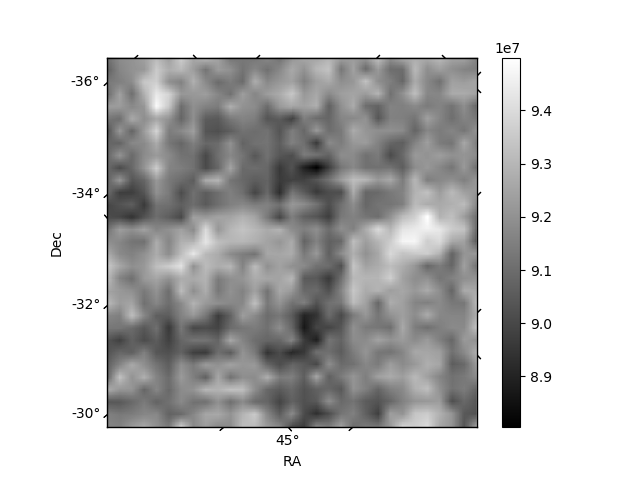
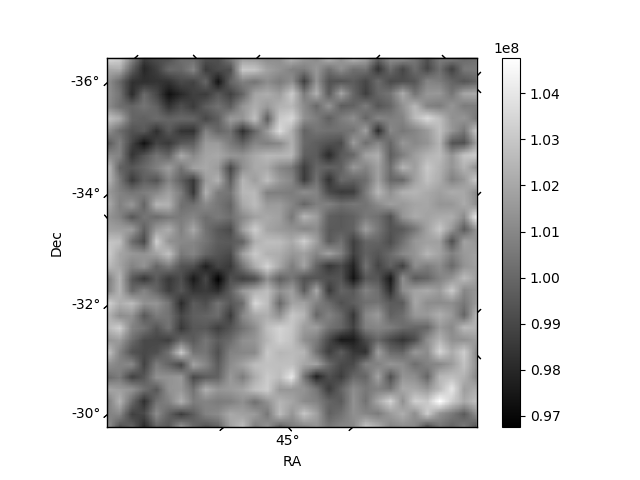
Histogram calculated using DETX and DETY for each event in the final _common_clean file
| Quadrant A | 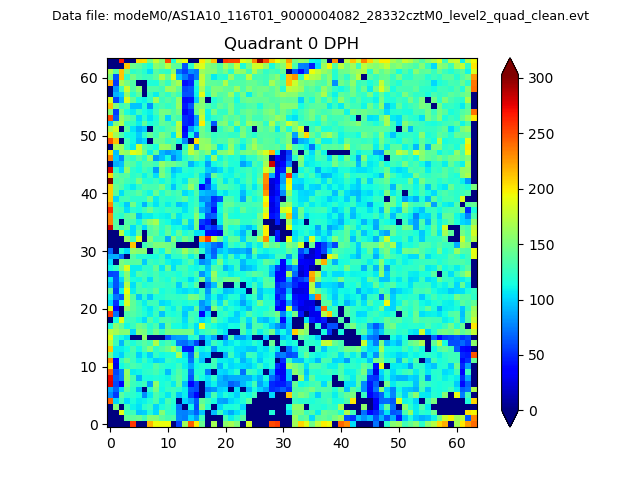 |
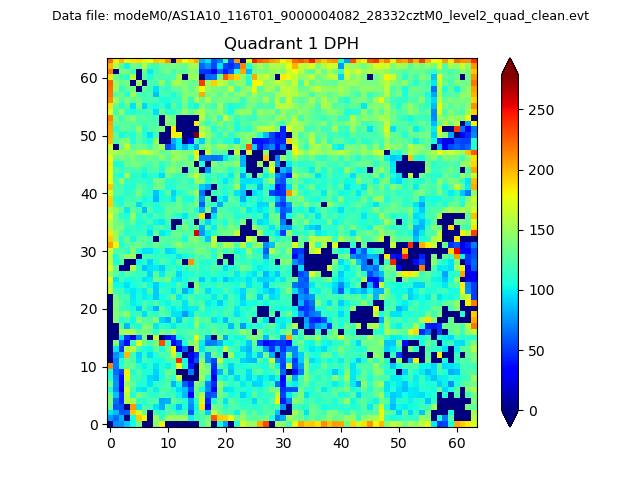 |
Quadrant B |
|---|---|---|---|
| Quadrant D | 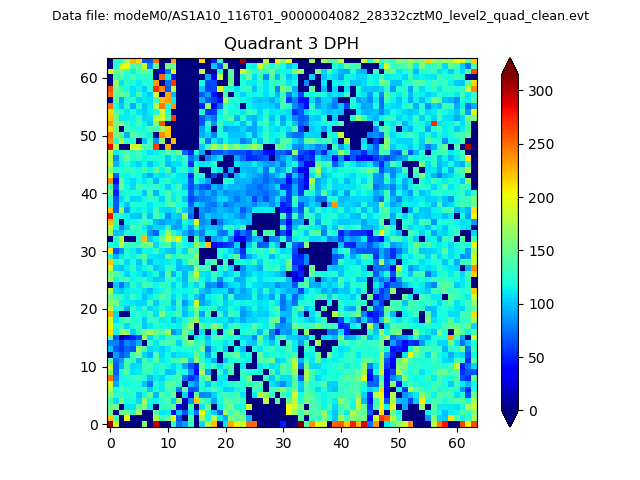 |
 |
Quadrant C |
| Plot type | Count rate plots | Images |
|---|---|---|
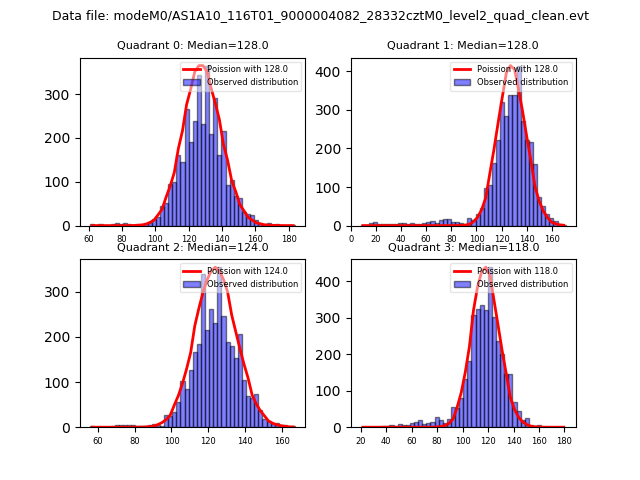
| Comparison with Poisson distribution Blue bars denote a histogram of data divided into 1 sec bins. Red curve is a Poisson curve with rate = median count rate of data. |
 |
 |
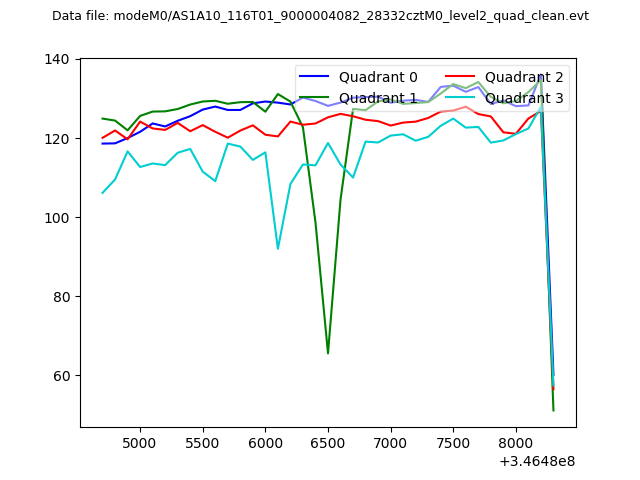
| Quadrant-wise count rates Data is divided into 100 sec bins |
 |
|
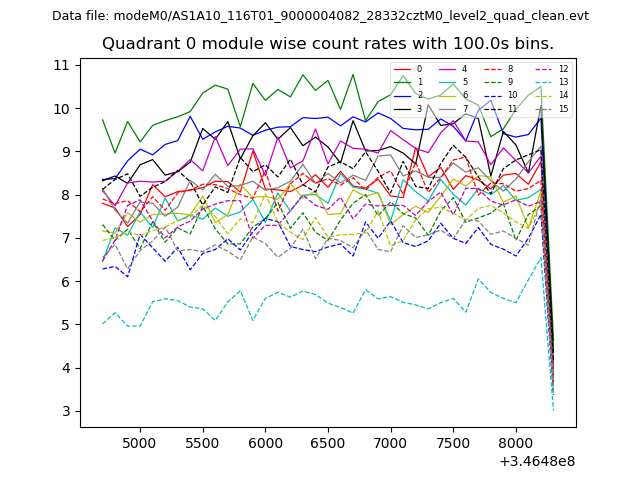
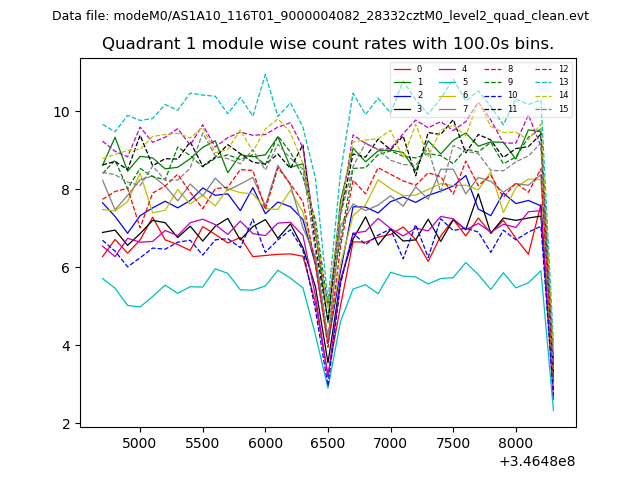
| Module-wise count rates for Quadrant A Data is divided into 100 sec bins |
 |
 |
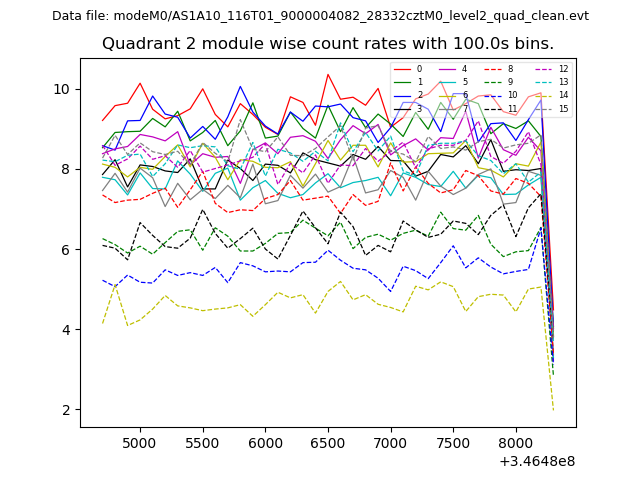
| Module-wise count rates for Quadrant B Data is divided into 100 sec bins |
 |
 |
| Module-wise count rates for Quadrant C Data is divided into 100 sec bins |
 |
 |
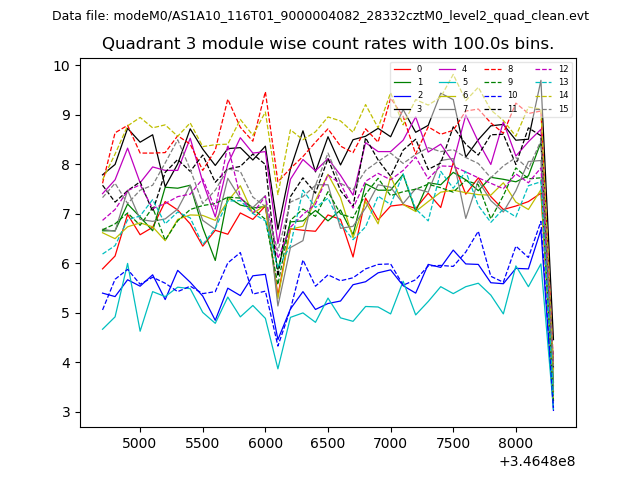
| Module-wise count rates for Quadrant D Data is divided into 100 sec bins |
 |
 |
| Parameter | Plot |
|---|---|
| CZT HV Monitor | 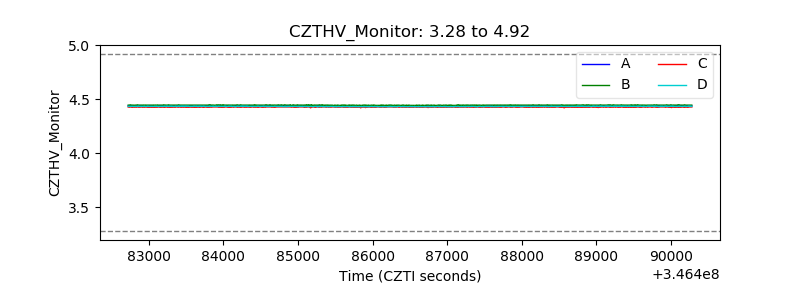 |
| D_VDD | 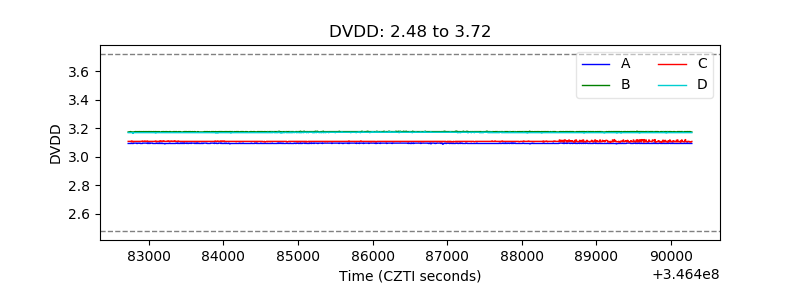 |
| Temperature 1 | 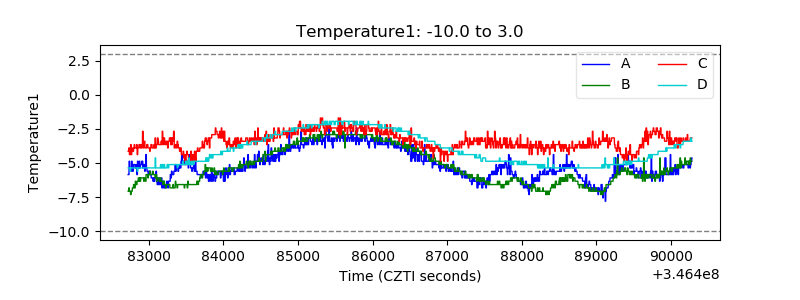 |
| Veto HV Monitor | 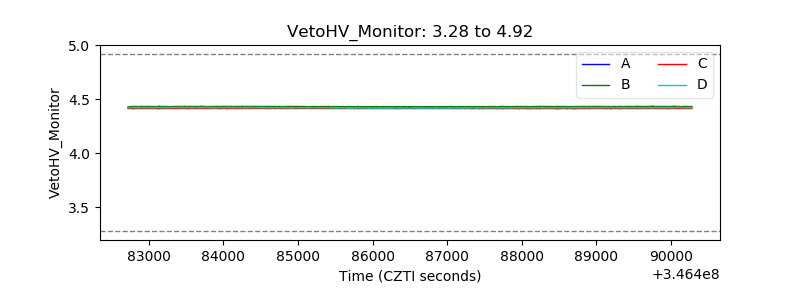 |
| Veto LLD | 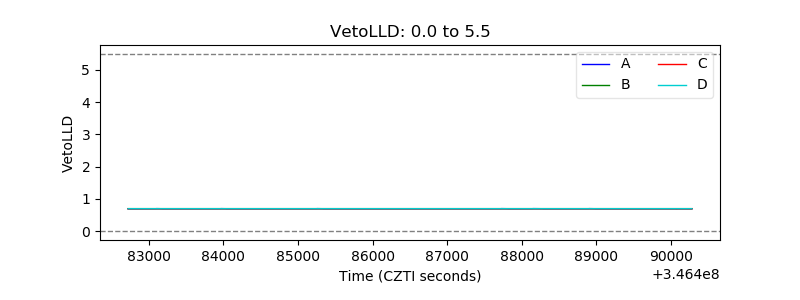 |
| Alpha Counter | 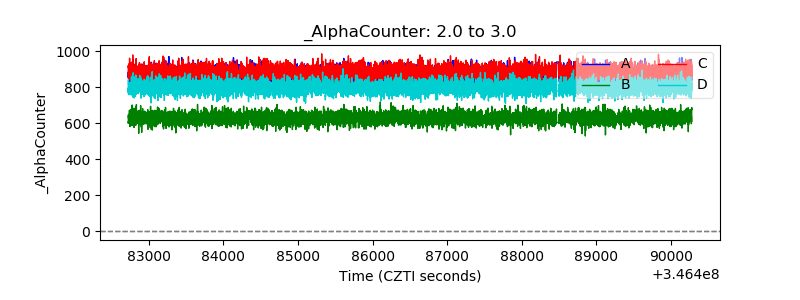 |
| _CPM_Rate | 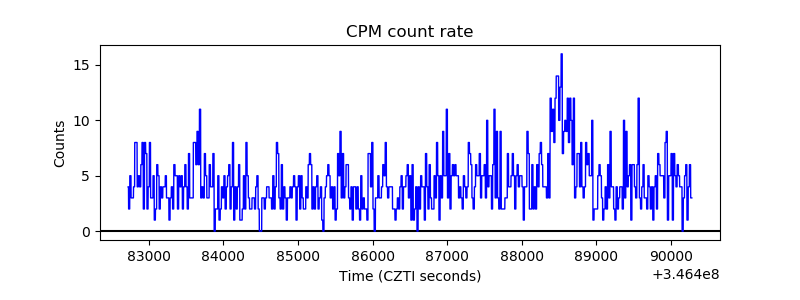 |
| CZT Counter | 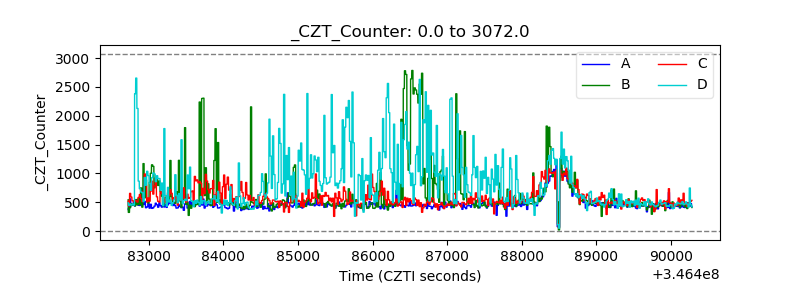 |
| +2.5 Volts monitor |  |
| +5 Volts monitor |  |
| _ROLL_ROT | 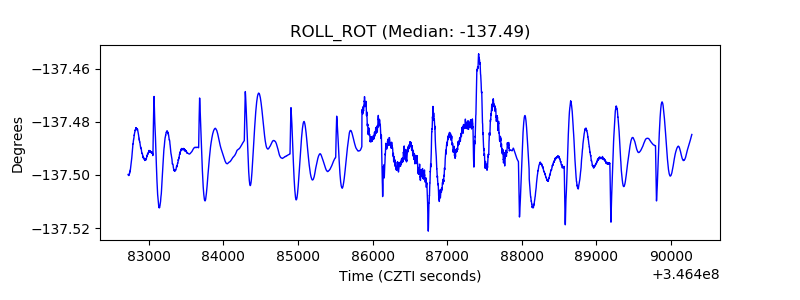 |
| _Roll_DEC | 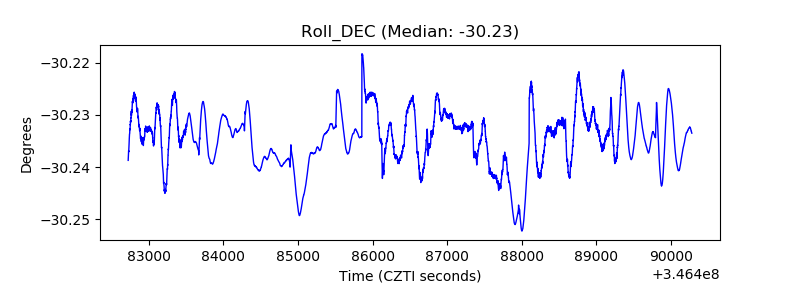 |
| _Roll_RA | 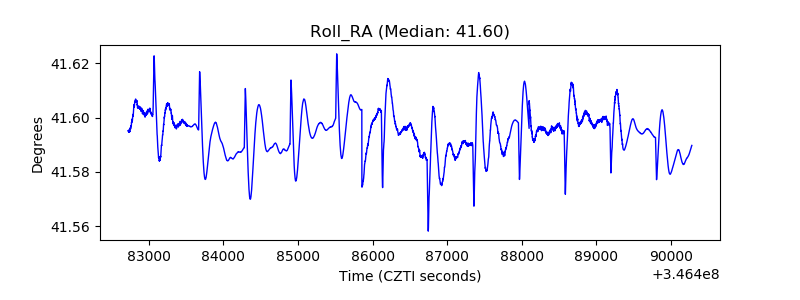 |
| Veto Counter | 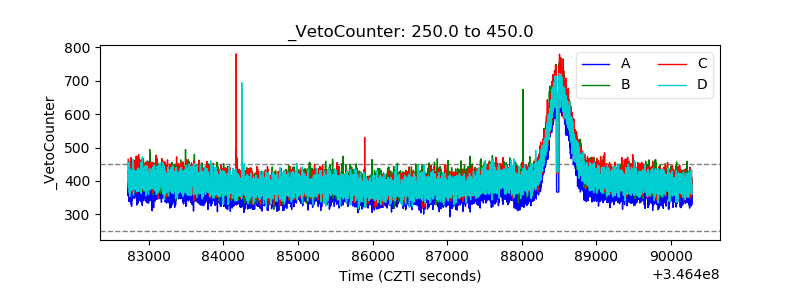 |