| Param | Original file | Final file |
|---|---|---|
| Filename | modeM0/AS1A10_116T01_9000004082_28333cztM0_level2.evt | modeM0/AS1A10_116T01_9000004082_28333cztM0_level2_quad_clean.evt |
| Size (bytes) | 544,487,040 | 79,894,080 |
| Size | 519.3 MB | 76.2 MB |
| Events in quadrant A | 3,501,844 | 484,618 |
| Events in quadrant B | 3,731,911 | 490,968 |
| Events in quadrant C | 3,701,982 | 470,550 |
| Events in quadrant D | 5,045,800 | 451,988 |
| Mode M9 | |||
|---|---|---|---|
| Quadrant | BADHDUFLAG | Total packets | Discarded packets |
| A | 0 | 2 | 0 |
| B | 0 | 2 | 0 |
| C | 0 | 2 | 0 |
| D | 0 | 2 | 0 |
| Mode M0 | |||
|---|---|---|---|
| Quadrant | BADHDUFLAG | Total packets | Discarded packets |
| A | 0 | 15318 | 0 |
| B | 0 | 15754 | 0 |
| C | 0 | 15505 | 0 |
| D | 0 | 19871 | 0 |
| Quadrant | Total seconds | Saturated seconds | Saturation percentage |
|---|---|---|---|
| A | 7487 | 120 | 1.602778% |
| B | 7488 | 171 | 2.283654% |
| C | 7488 | 161 | 2.150107% |
| D | 7488 | 224 | 2.991453% |
Noise dominated data is calculated using 1-second bins in cleaned event files. If a bin has >2000 counts, and if more than 50% of those come from <1% of pixels, then it is considered to be noise-dominated and hence unusable.
| Quadrant | # 1 sec bins | Bins with >0 counts | Bins with >2000 counts | High rate bins dominated by noise | Noise dominated (total time) | Noise dominated (detector-on time) | Marked lightcurve |
|---|---|---|---|---|---|---|---|
| A | 7722 | 7488 | 0 | 0 | 0.00% | 0.00% | 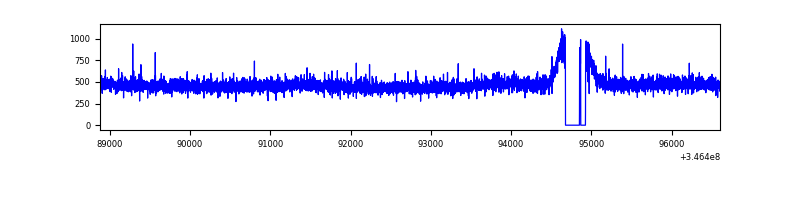 |
| B | 7723 | 7488 | 13 | 13 | 0.17% | 0.17% | 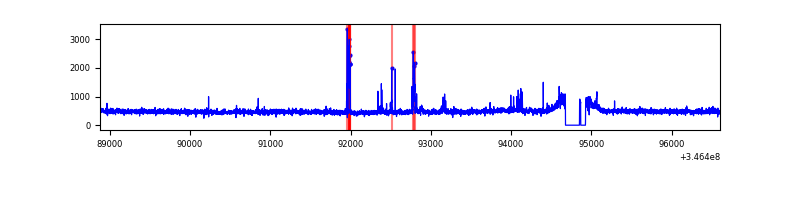 |
| C | 7723 | 7490 | 0 | 0 | 0.00% | 0.00% | 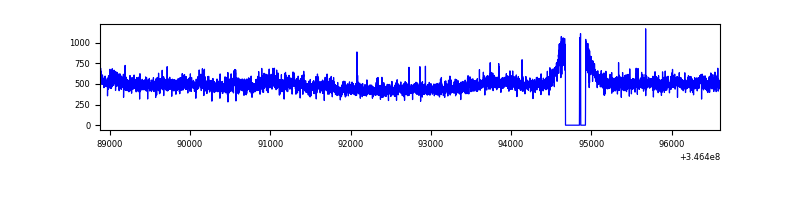 |
| D | 7723 | 7489 | 118 | 118 | 1.53% | 1.58% | 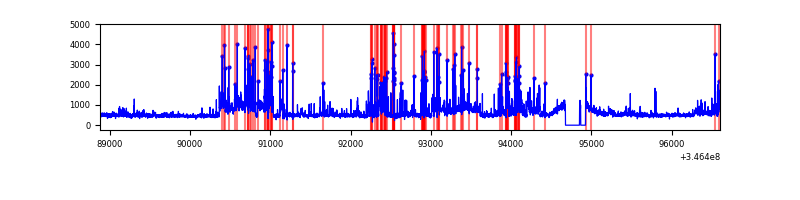 |
Top three noisy pixels from each quadrant. If the there are fewer than three noisy pixels in the level2.evt file, extra rows are filled as -1
| Pixel properties | Quadrant properties | ||||||
|---|---|---|---|---|---|---|---|
| Quadrant | DetID | PixID | Counts | Sigma | Mean | Median | Sigma |
| A | 13 | 254 | 12546 | 63.18 | 907 | 887 | 184.5 |
| A | 3 | 137 | 9266 | 45.4 | 907 | 887 | 184.5 |
| A | 0 | 226 | 7545 | 36.08 | 907 | 887 | 184.5 |
| B | 10 | 245 | 100816 | 568.93 | 904 | 881 | 175.7 |
| B | 15 | 32 | 41486 | 231.16 | 904 | 881 | 175.7 |
| B | 10 | 246 | 22958 | 125.68 | 904 | 881 | 175.7 |
| C | 14 | 238 | 138246 | 668.66 | 876 | 880 | 205.4 |
| C | 3 | 233 | 126290 | 610.46 | 876 | 880 | 205.4 |
| C | 8 | 128 | 12990 | 58.95 | 876 | 880 | 205.4 |
| D | 1 | 52 | 841392 | 4009.41 | 876 | 851 | 209.6 |
| D | 8 | 195 | 797616 | 3800.6 | 876 | 851 | 209.6 |
| D | 2 | 250 | 91475 | 432.28 | 876 | 851 | 209.6 |
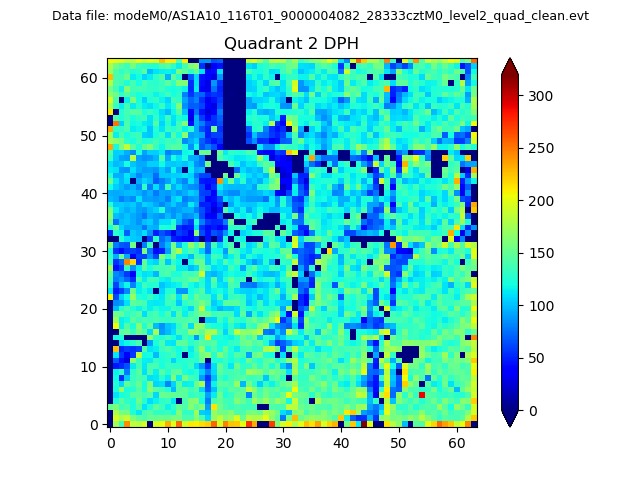
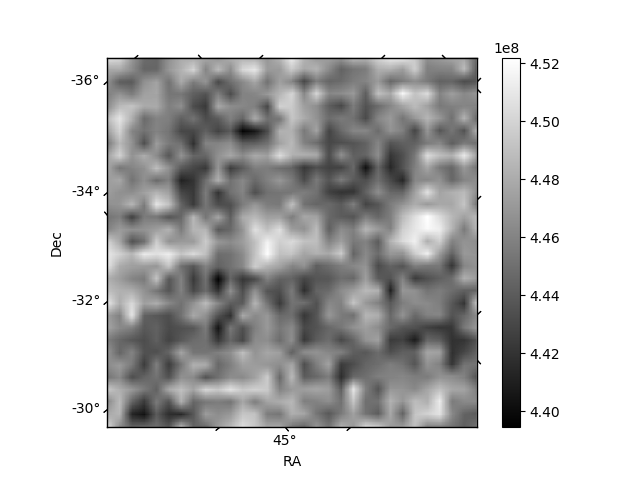
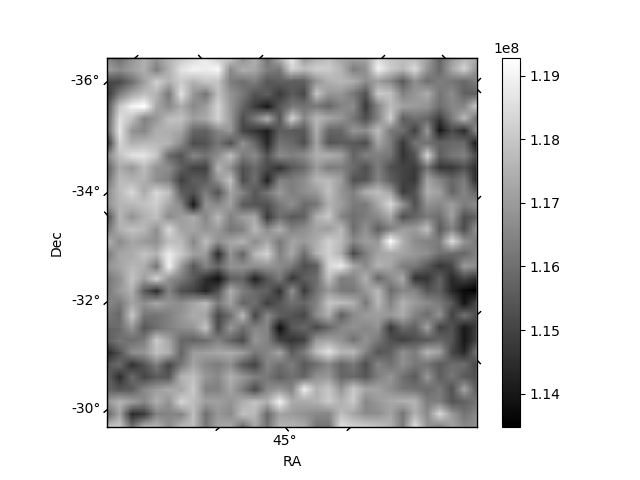
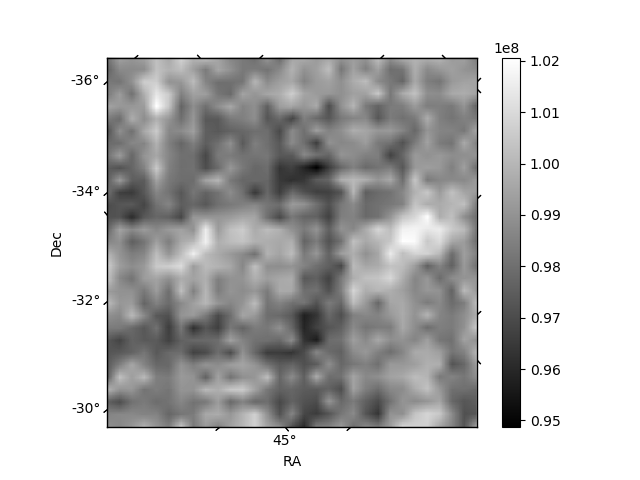
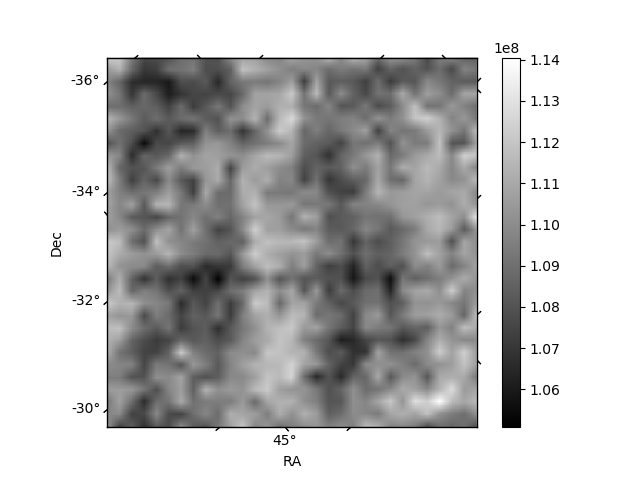
Histogram calculated using DETX and DETY for each event in the final _common_clean file
| Quadrant A | 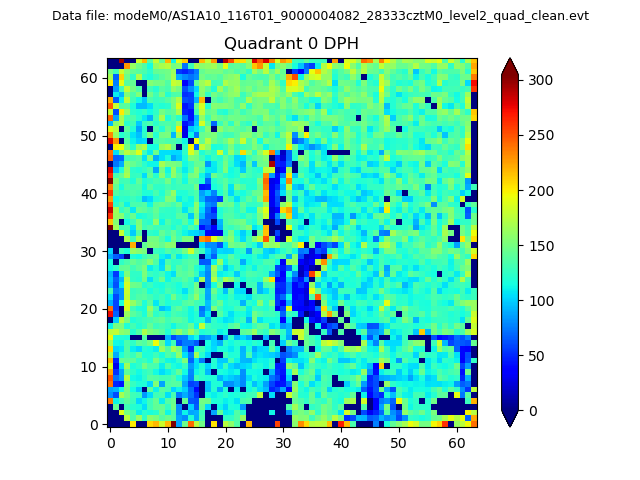 |
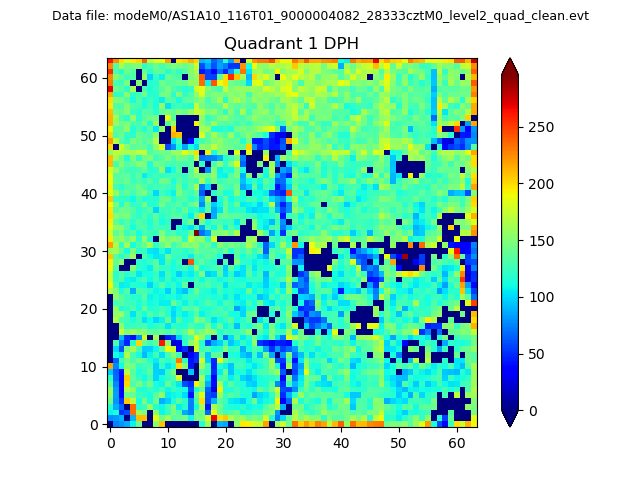 |
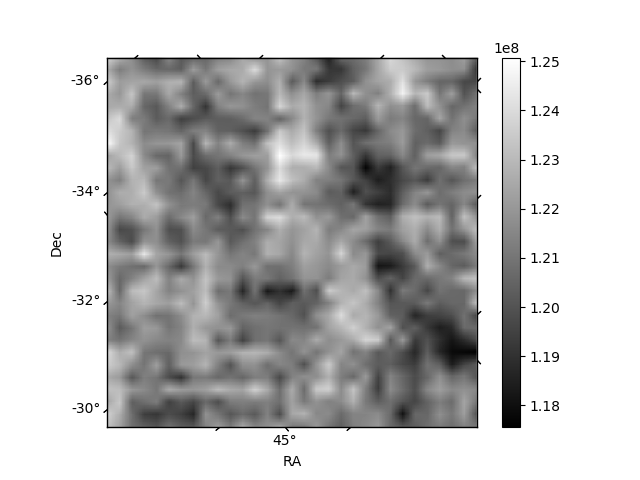
Quadrant B |
|---|---|---|---|
| Quadrant D | 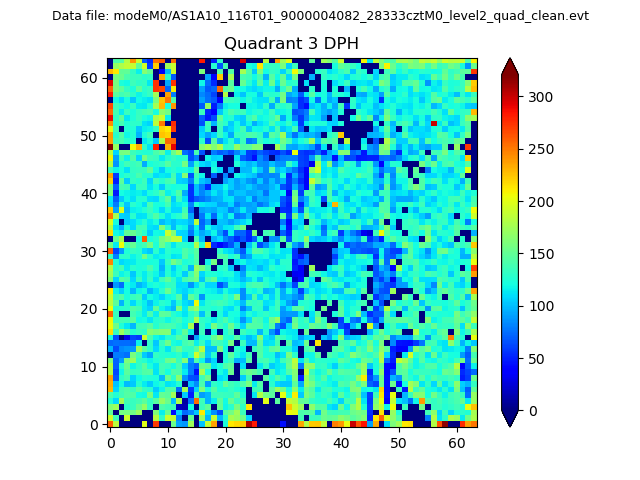 |
 |
Quadrant C |
| Plot type | Count rate plots | Images |
|---|---|---|
| Comparison with Poisson distribution Blue bars denote a histogram of data divided into 1 sec bins. Red curve is a Poisson curve with rate = median count rate of data. |
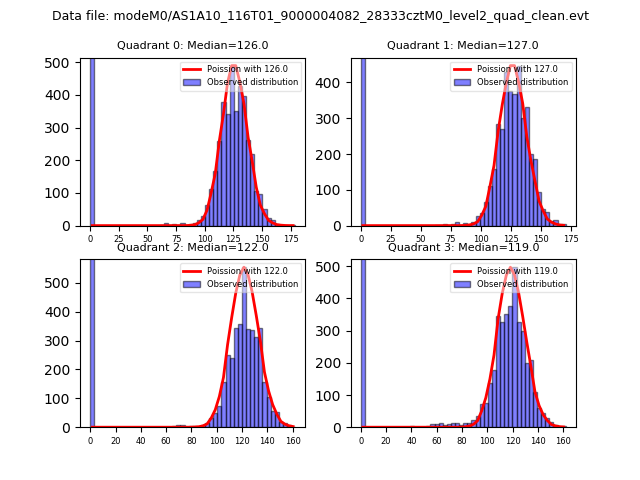 |
 |
| Quadrant-wise count rates Data is divided into 100 sec bins |
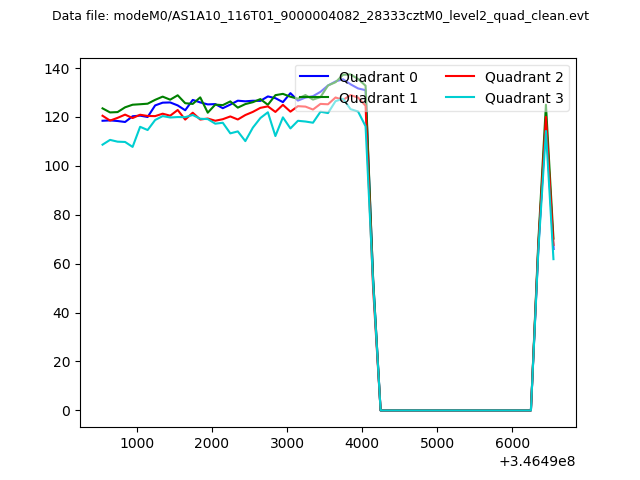 |
|
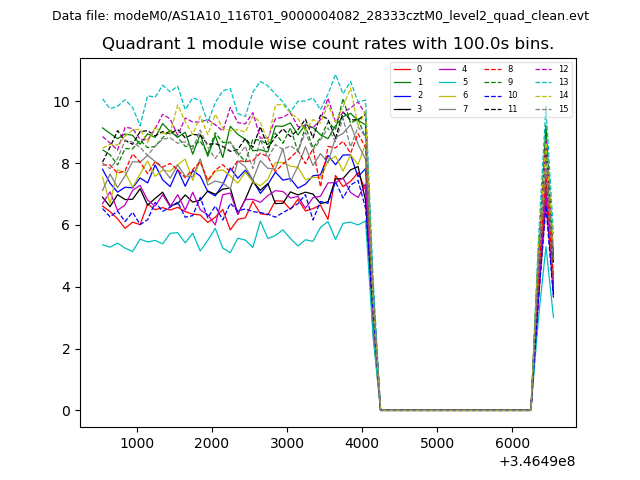
| Module-wise count rates for Quadrant A Data is divided into 100 sec bins |
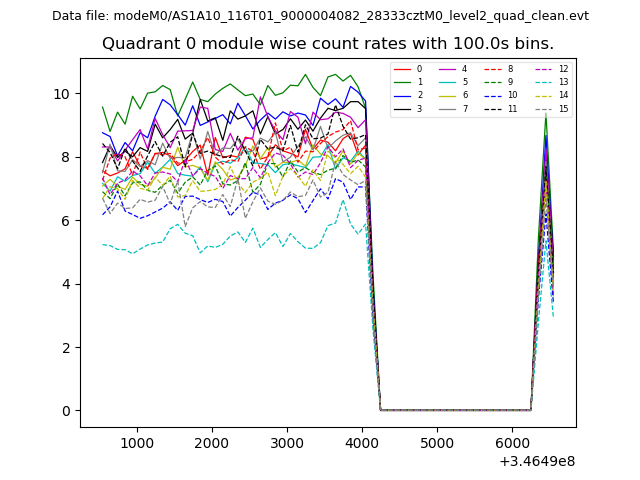 |
 |
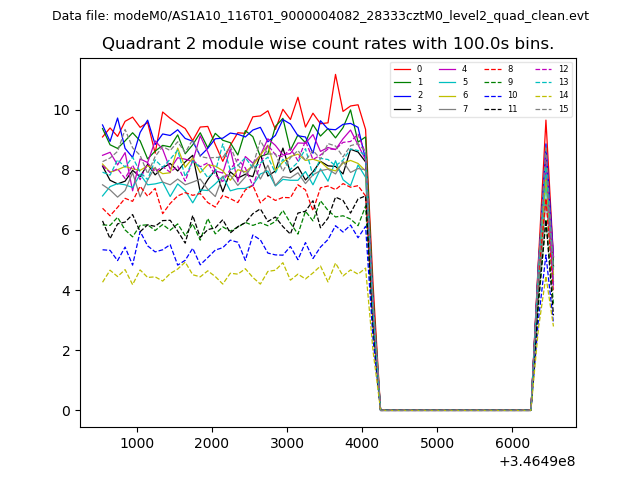
| Module-wise count rates for Quadrant B Data is divided into 100 sec bins |
 |
 |
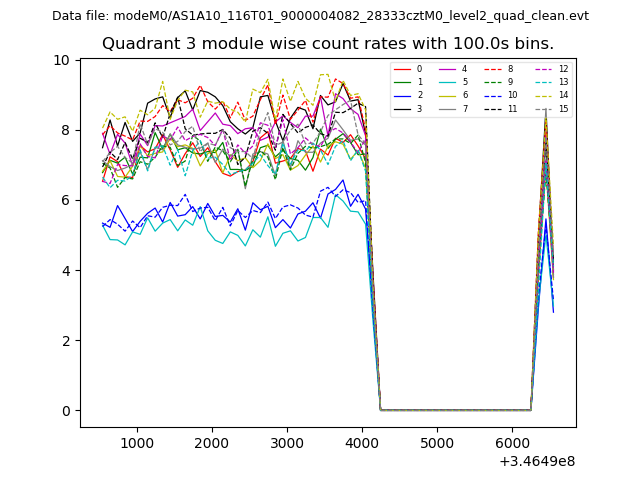
| Module-wise count rates for Quadrant C Data is divided into 100 sec bins |
 |
 |
| Module-wise count rates for Quadrant D Data is divided into 100 sec bins |
 |
 |
| Parameter | Plot |
|---|---|
| CZT HV Monitor | 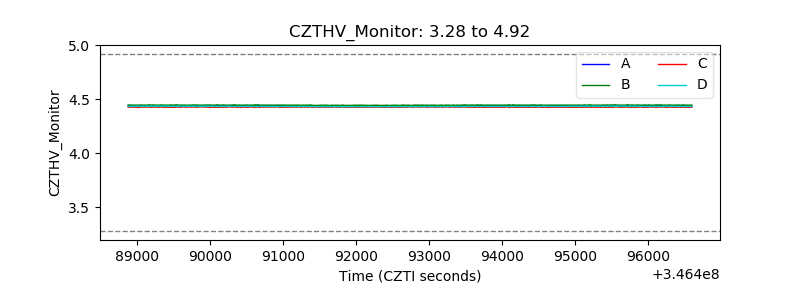 |
| D_VDD | 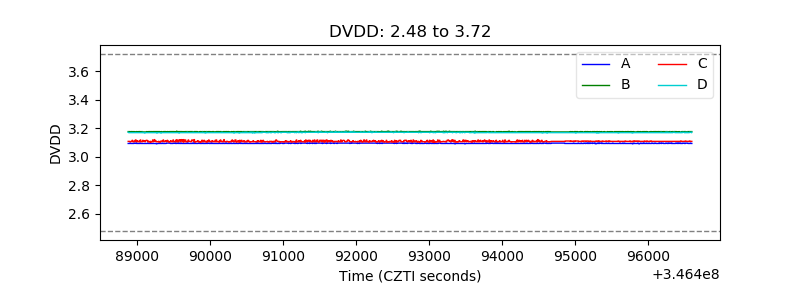 |
| Temperature 1 | 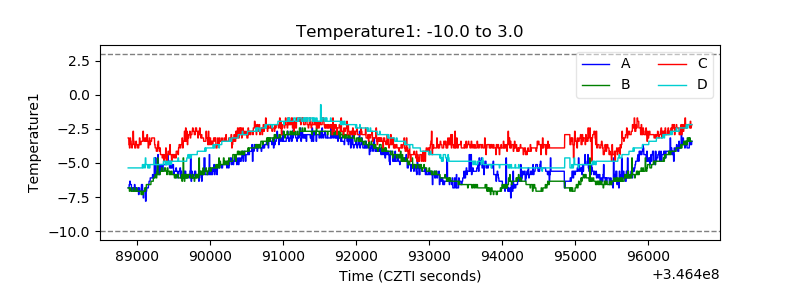 |
| Veto HV Monitor | 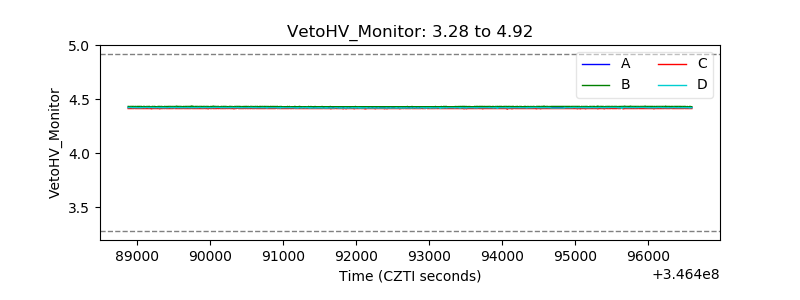 |
| Veto LLD | 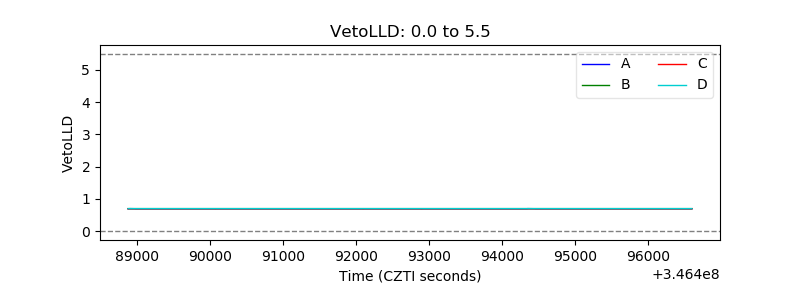 |
| Alpha Counter |  |
| _CPM_Rate | 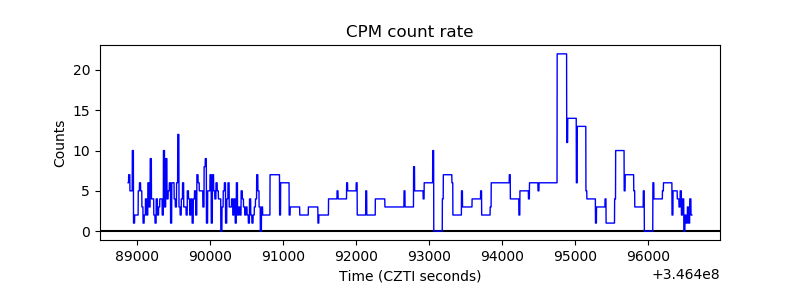 |
| CZT Counter | 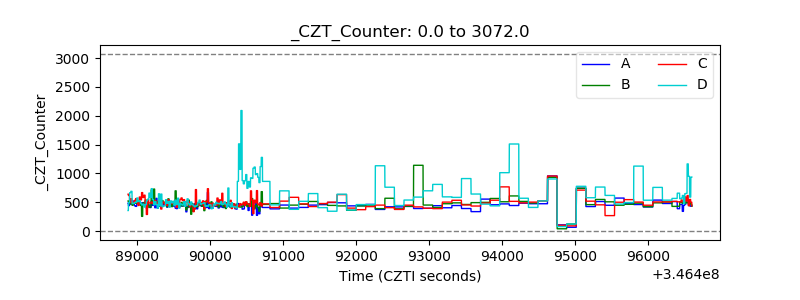 |
| +2.5 Volts monitor | 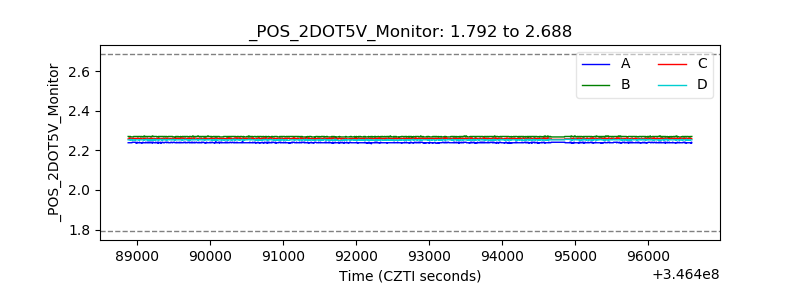 |
| +5 Volts monitor | 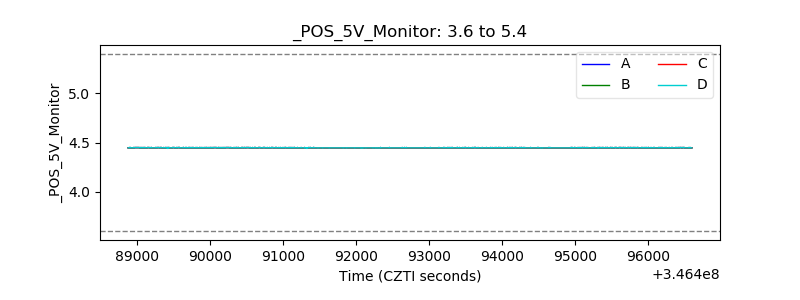 |
| _ROLL_ROT | 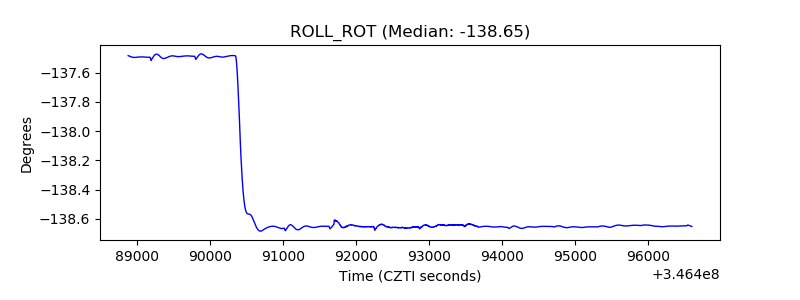 |
| _Roll_DEC | 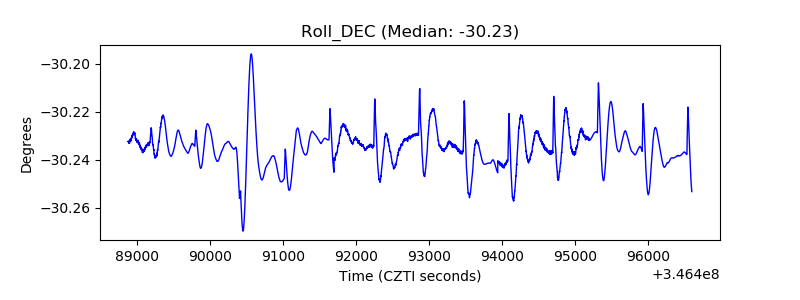 |
| _Roll_RA | 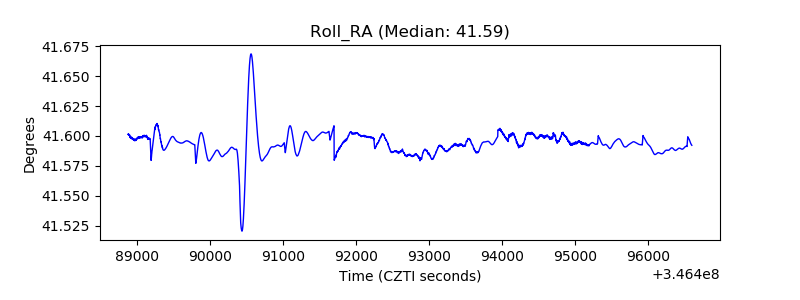 |
| Veto Counter | 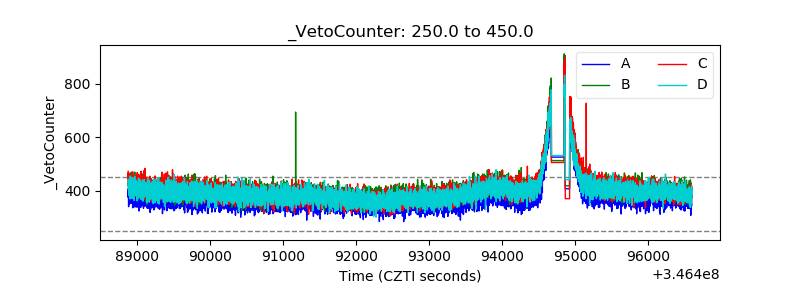 |