| Param | Original file | Final file |
|---|---|---|
| Filename | modeM0/AS1A10_116T01_9000004082_28335cztM0_level2.evt | modeM0/AS1A10_116T01_9000004082_28335cztM0_level2_quad_clean.evt |
| Size (bytes) | 849,695,040 | 138,234,240 |
| Size | 810.3 MB | 131.8 MB |
| Events in quadrant A | 4,982,693 | 903,394 |
| Events in quadrant B | 5,172,025 | 910,144 |
| Events in quadrant C | 5,170,829 | 871,021 |
| Events in quadrant D | 9,676,606 | 753,831 |
| Mode M9 | |||
|---|---|---|---|
| Quadrant | BADHDUFLAG | Total packets | Discarded packets |
| A | 0 | 12 | 0 |
| B | 0 | 12 | 0 |
| C | 0 | 12 | 0 |
| D | 0 | 12 | 0 |
| Mode M0 | |||
|---|---|---|---|
| Quadrant | BADHDUFLAG | Total packets | Discarded packets |
| A | 0 | 21976 | 0 |
| B | 0 | 22324 | 0 |
| C | 0 | 22202 | 0 |
| D | 0 | 35747 | 0 |
| Quadrant | Total seconds | Saturated seconds | Saturation percentage |
|---|---|---|---|
| A | 10806 | 119 | 1.101240% |
| B | 10806 | 137 | 1.267814% |
| C | 10806 | 172 | 1.591708% |
| D | 10806 | 1296 | 11.993337% |
Noise dominated data is calculated using 1-second bins in cleaned event files. If a bin has >2000 counts, and if more than 50% of those come from <1% of pixels, then it is considered to be noise-dominated and hence unusable.
| Quadrant | # 1 sec bins | Bins with >0 counts | Bins with >2000 counts | High rate bins dominated by noise | Noise dominated (total time) | Noise dominated (detector-on time) | Marked lightcurve |
|---|---|---|---|---|---|---|---|
| A | 11946 | 10806 | 0 | 0 | 0.00% | 0.00% | 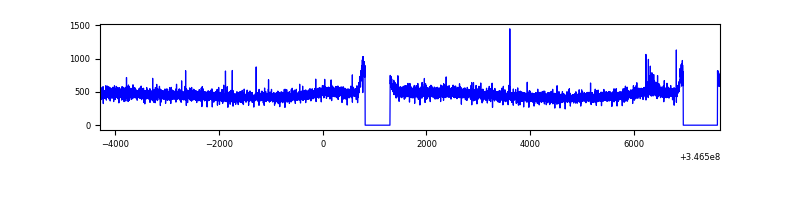 |
| B | 11946 | 10806 | 0 | 0 | 0.00% | 0.00% | 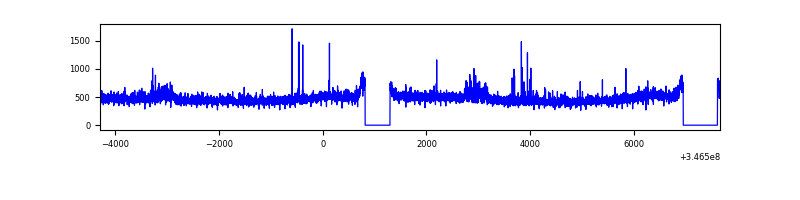 |
| C | 11946 | 10807 | 0 | 0 | 0.00% | 0.00% | 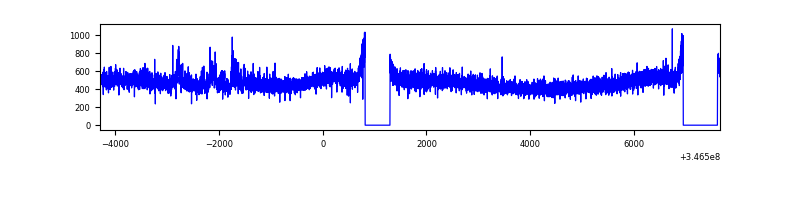 |
| D | 11946 | 10807 | 1178 | 1178 | 9.86% | 10.90% | 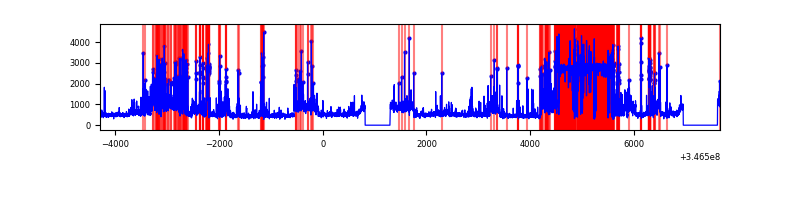 |
Top three noisy pixels from each quadrant. If the there are fewer than three noisy pixels in the level2.evt file, extra rows are filled as -1
| Pixel properties | Quadrant properties | ||||||
|---|---|---|---|---|---|---|---|
| Quadrant | DetID | PixID | Counts | Sigma | Mean | Median | Sigma |
| A | 13 | 254 | 18607 | 66.62 | 1289 | 1259 | 260.4 |
| A | 3 | 137 | 13124 | 45.56 | 1289 | 1259 | 260.4 |
| A | 0 | 226 | 10975 | 37.31 | 1289 | 1259 | 260.4 |
| B | 0 | 230 | 85702 | 341.64 | 1279 | 1245 | 247.2 |
| B | 12 | 111 | 31618 | 122.86 | 1279 | 1245 | 247.2 |
| B | 4 | 200 | 30416 | 118.0 | 1279 | 1245 | 247.2 |
| C | 14 | 238 | 197608 | 680.57 | 1234 | 1243 | 288.5 |
| C | 3 | 233 | 166729 | 573.55 | 1234 | 1243 | 288.5 |
| C | 13 | 61 | 8412 | 24.85 | 1234 | 1243 | 288.5 |
| D | 1 | 52 | 3961315 | 14330.47 | 1164 | 1133 | 276.3 |
| D | 8 | 195 | 1112769 | 4022.61 | 1164 | 1133 | 276.3 |
| D | 2 | 250 | 119288 | 427.56 | 1164 | 1133 | 276.3 |
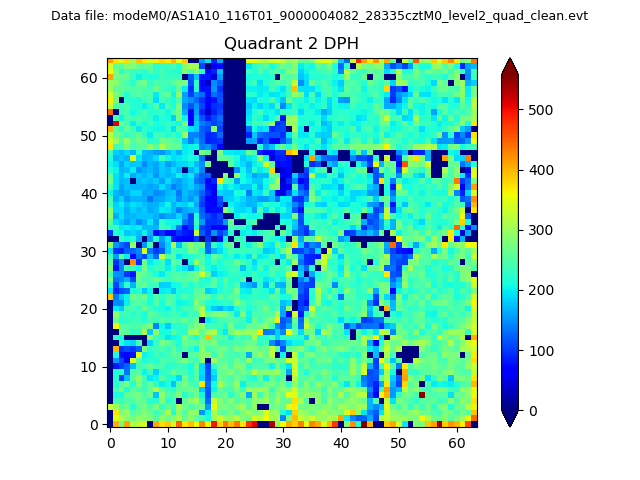
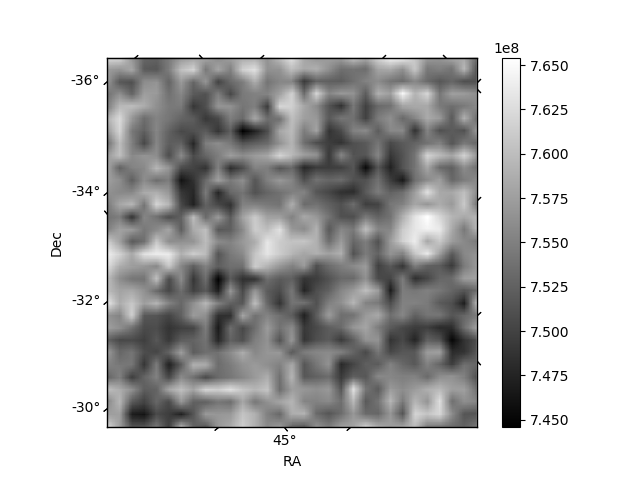
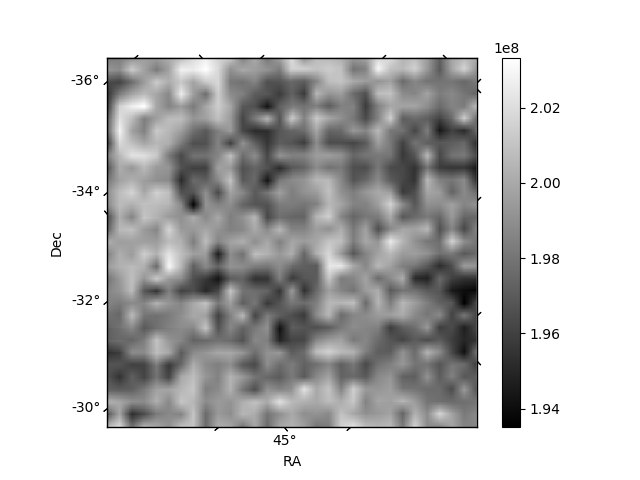
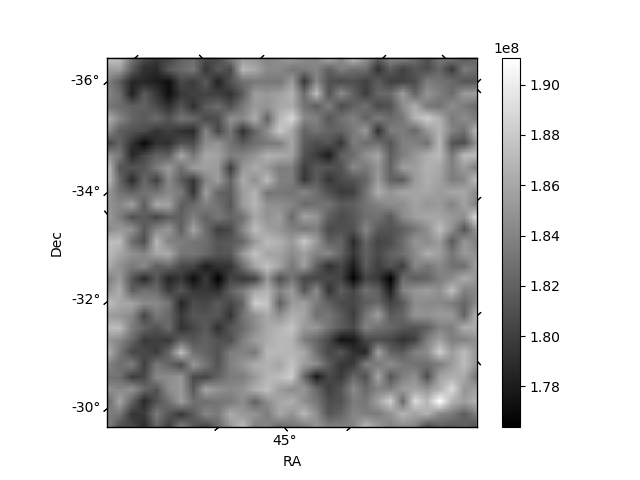
Histogram calculated using DETX and DETY for each event in the final _common_clean file
| Quadrant A | 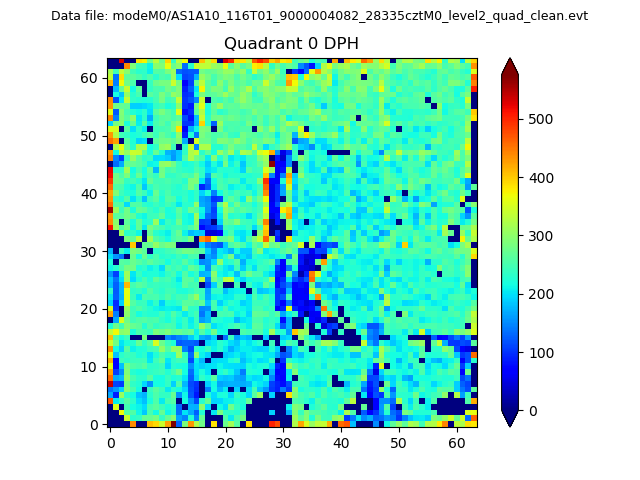 |
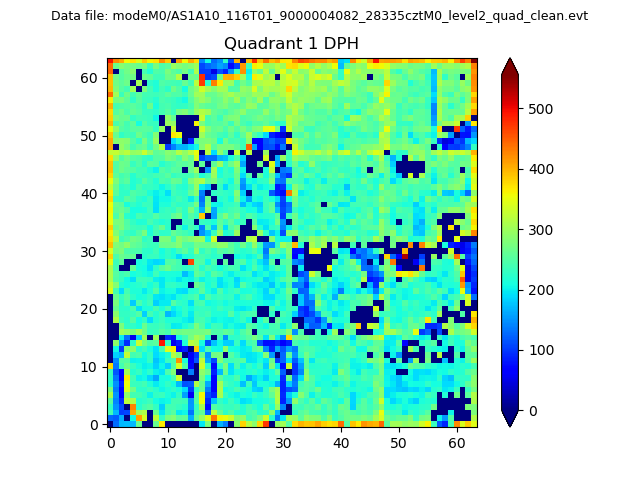 |
Quadrant B |
|---|---|---|---|
| Quadrant D | 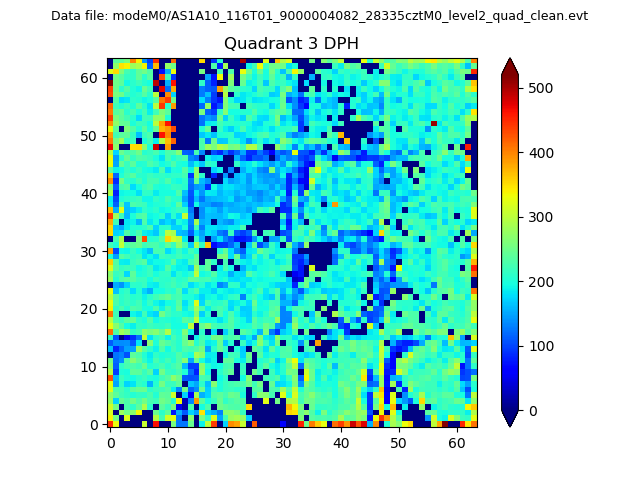 |
 |
Quadrant C |
| Plot type | Count rate plots | Images |
|---|---|---|
| Comparison with Poisson distribution Blue bars denote a histogram of data divided into 1 sec bins. Red curve is a Poisson curve with rate = median count rate of data. |
 |
 |
| Quadrant-wise count rates Data is divided into 100 sec bins |
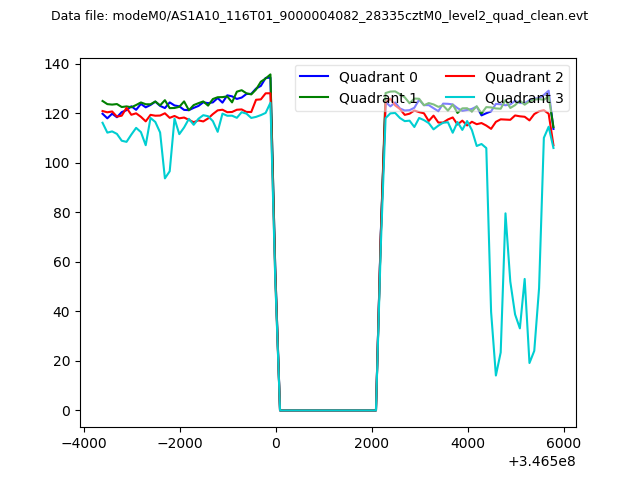 |
|
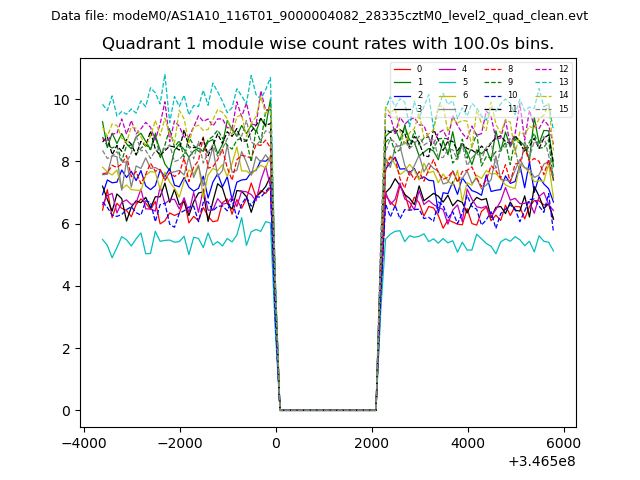
| Module-wise count rates for Quadrant A Data is divided into 100 sec bins |
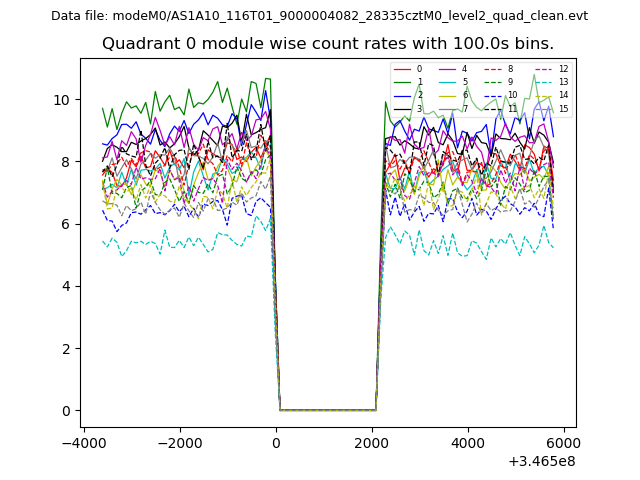 |
 |
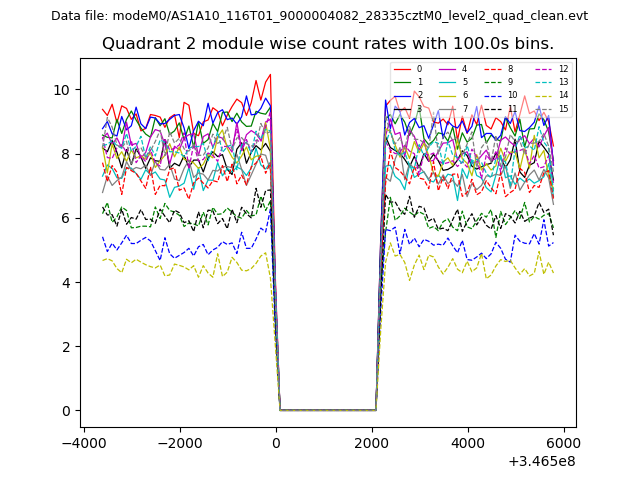
| Module-wise count rates for Quadrant B Data is divided into 100 sec bins |
 |
 |
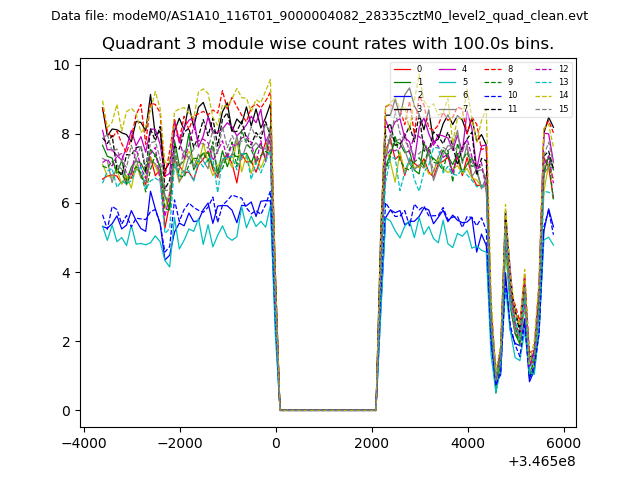
| Module-wise count rates for Quadrant C Data is divided into 100 sec bins |
 |
 |
| Module-wise count rates for Quadrant D Data is divided into 100 sec bins |
 |
 |
| Parameter | Plot |
|---|---|
| CZT HV Monitor | 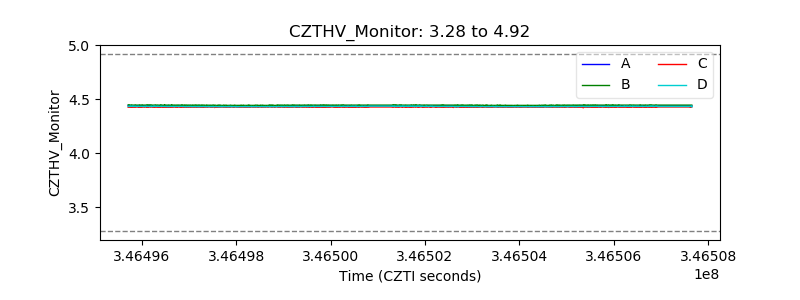 |
| D_VDD | 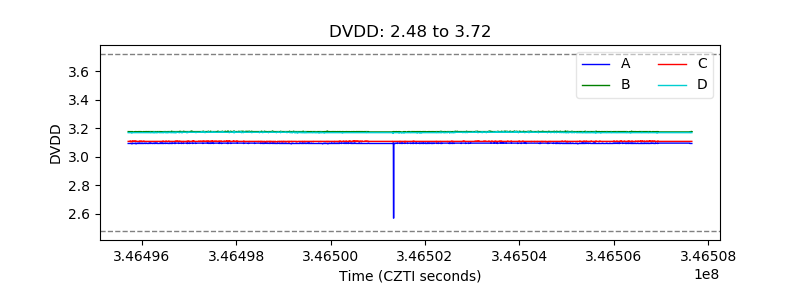 |
| Temperature 1 | 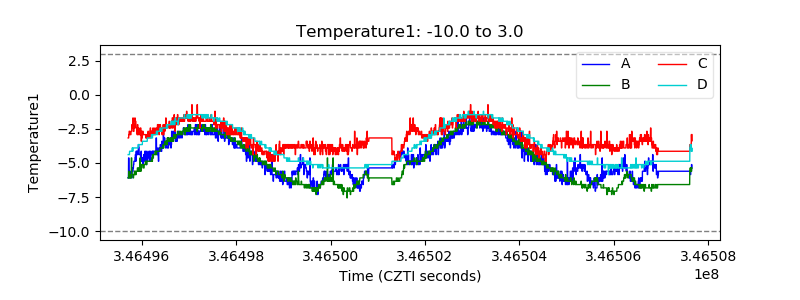 |
| Veto HV Monitor | 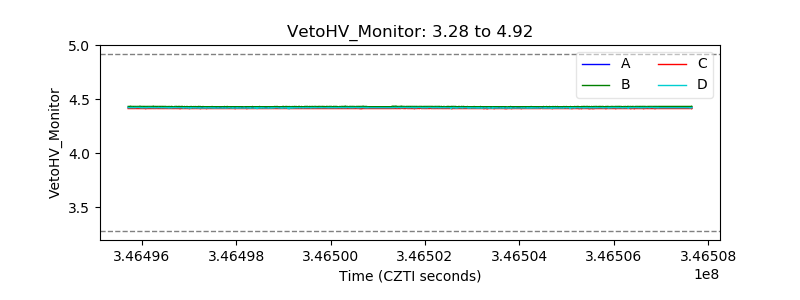 |
| Veto LLD | 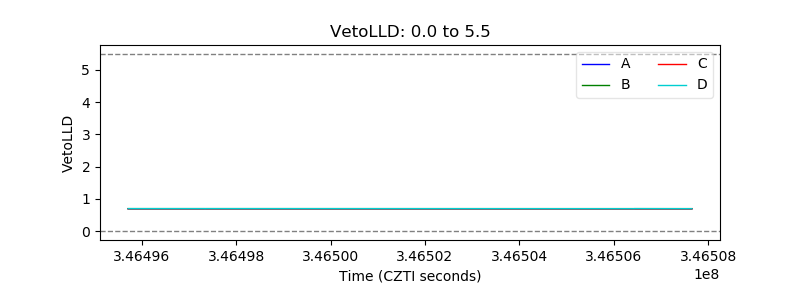 |
| Alpha Counter | 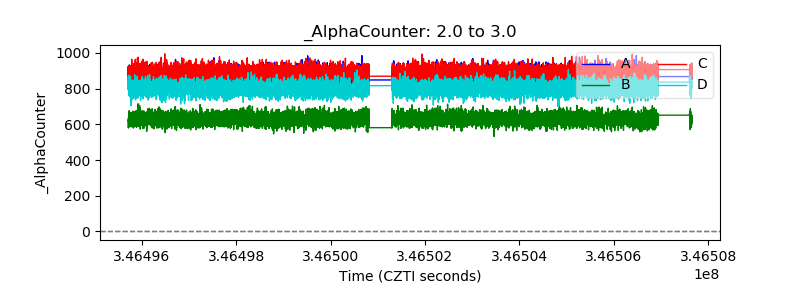 |
| _CPM_Rate | 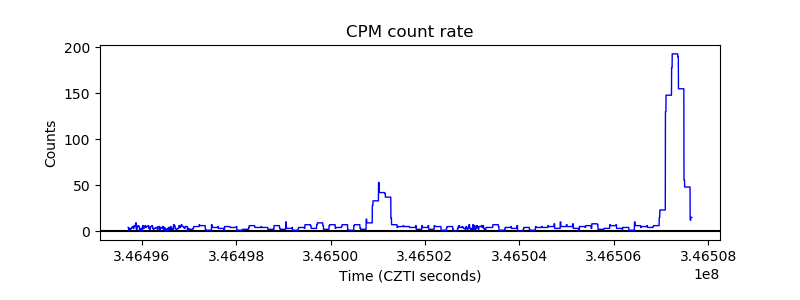 |
| CZT Counter | 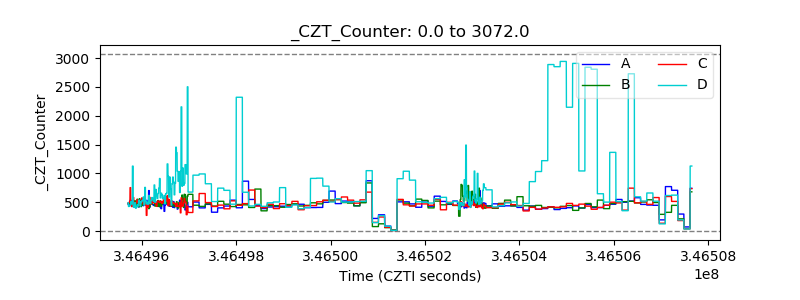 |
| +2.5 Volts monitor |  |
| +5 Volts monitor | 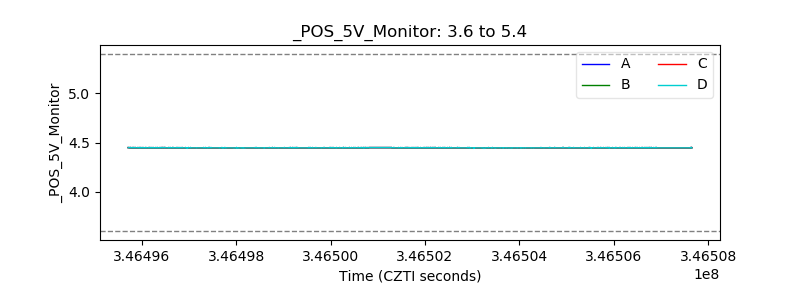 |
| _ROLL_ROT | 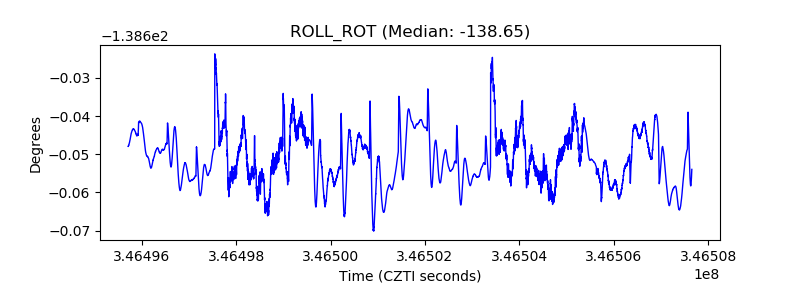 |
| _Roll_DEC | 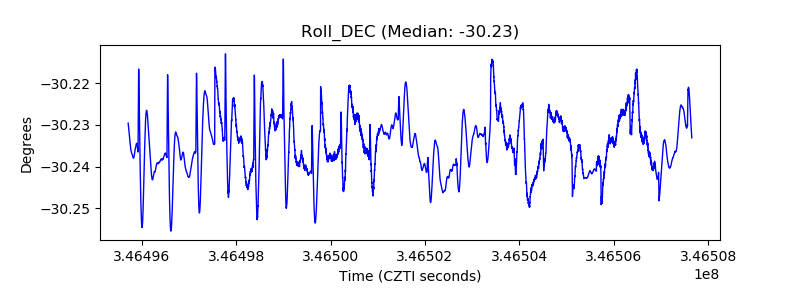 |
| _Roll_RA | 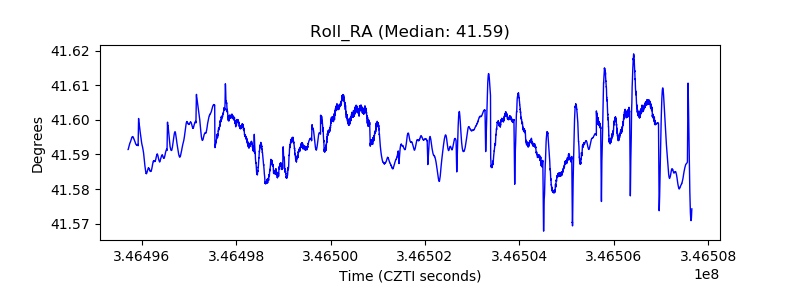 |
| Veto Counter | 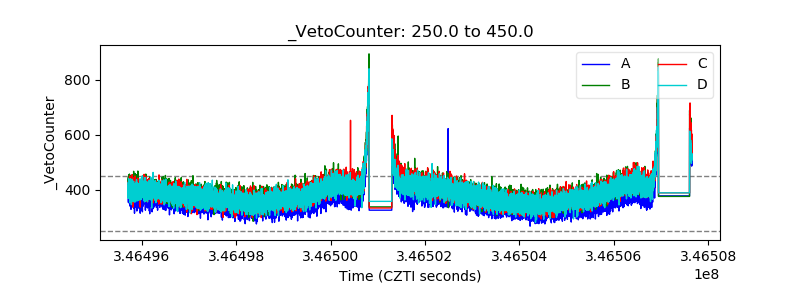 |