| Param | Original file | Final file |
|---|---|---|
| Filename | modeM0/AS1A10_116T01_9000004082_28336cztM0_level2.evt | modeM0/AS1A10_116T01_9000004082_28336cztM0_level2_quad_clean.evt |
| Size (bytes) | 589,875,840 | 99,512,640 |
| Size | 562.5 MB | 94.9 MB |
| Events in quadrant A | 3,417,125 | 653,103 |
| Events in quadrant B | 3,538,946 | 660,561 |
| Events in quadrant C | 3,414,032 | 626,606 |
| Events in quadrant D | 7,014,394 | 580,011 |
| Mode M9 | |||
|---|---|---|---|
| Quadrant | BADHDUFLAG | Total packets | Discarded packets |
| A | 0 | 16 | 0 |
| B | 0 | 16 | 0 |
| C | 0 | 16 | 0 |
| D | 0 | 16 | 0 |
| Mode M0 | |||
|---|---|---|---|
| Quadrant | BADHDUFLAG | Total packets | Discarded packets |
| A | 0 | 14674 | 0 |
| B | 0 | 14922 | 0 |
| C | 0 | 14713 | 0 |
| D | 0 | 25641 | 0 |
| Quadrant | Total seconds | Saturated seconds | Saturation percentage |
|---|---|---|---|
| A | 7090 | 89 | 1.255289% |
| B | 7090 | 109 | 1.537377% |
| C | 7090 | 139 | 1.960508% |
| D | 7091 | 624 | 8.799887% |
Noise dominated data is calculated using 1-second bins in cleaned event files. If a bin has >2000 counts, and if more than 50% of those come from <1% of pixels, then it is considered to be noise-dominated and hence unusable.
| Quadrant | # 1 sec bins | Bins with >0 counts | Bins with >2000 counts | High rate bins dominated by noise | Noise dominated (total time) | Noise dominated (detector-on time) | Marked lightcurve |
|---|---|---|---|---|---|---|---|
| A | 8600 | 7091 | 0 | 0 | 0.00% | 0.00% | 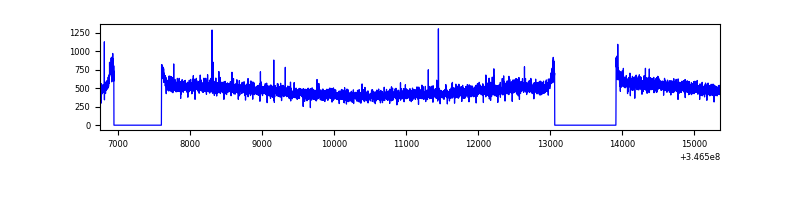 |
| B | 8600 | 7090 | 0 | 0 | 0.00% | 0.00% | 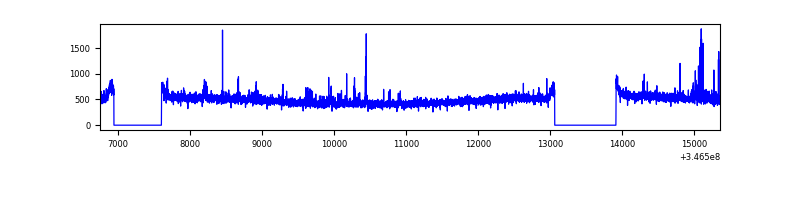 |
| C | 8600 | 7090 | 0 | 0 | 0.00% | 0.00% | 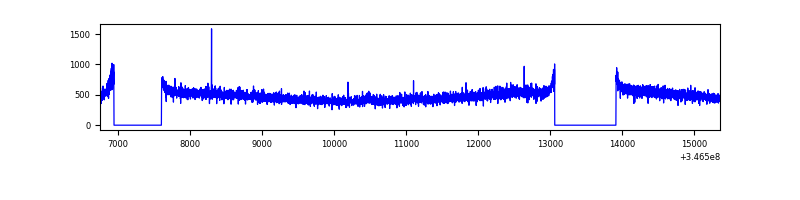 |
| D | 8601 | 7093 | 486 | 486 | 5.65% | 6.85% | 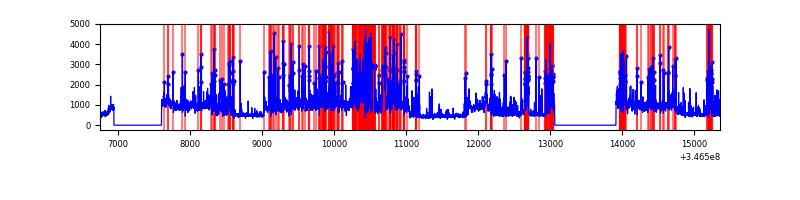 |
Top three noisy pixels from each quadrant. If the there are fewer than three noisy pixels in the level2.evt file, extra rows are filled as -1
| Pixel properties | Quadrant properties | ||||||
|---|---|---|---|---|---|---|---|
| Quadrant | DetID | PixID | Counts | Sigma | Mean | Median | Sigma |
| A | 13 | 254 | 12074 | 62.59 | 883 | 864 | 179.1 |
| A | 3 | 137 | 8840 | 44.53 | 883 | 864 | 179.1 |
| A | 0 | 226 | 7589 | 37.55 | 883 | 864 | 179.1 |
| B | 4 | 200 | 40131 | 230.11 | 874 | 853 | 170.7 |
| B | 10 | 245 | 23659 | 133.61 | 874 | 853 | 170.7 |
| B | 12 | 111 | 21535 | 121.17 | 874 | 853 | 170.7 |
| C | 14 | 238 | 132963 | 664.34 | 838 | 842 | 198.9 |
| C | 3 | 233 | 14360 | 67.97 | 838 | 842 | 198.9 |
| C | 13 | 61 | 5699 | 24.42 | 838 | 842 | 198.9 |
| D | 1 | 52 | 2023018 | 10312.31 | 822 | 799 | 196.1 |
| D | 8 | 195 | 1801220 | 9181.25 | 822 | 799 | 196.1 |
| D | 2 | 250 | 39479 | 197.25 | 822 | 799 | 196.1 |
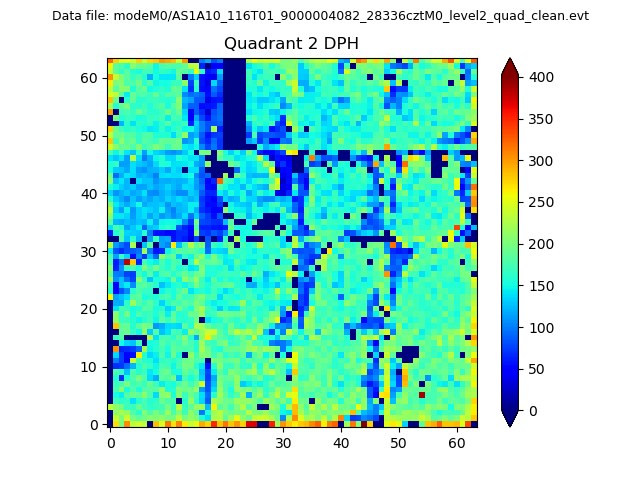
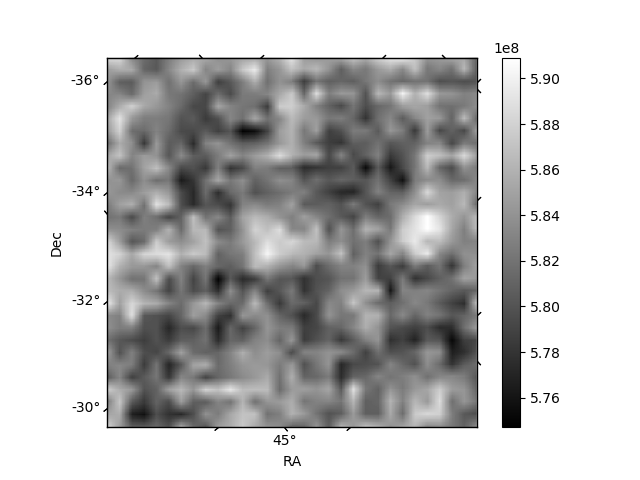
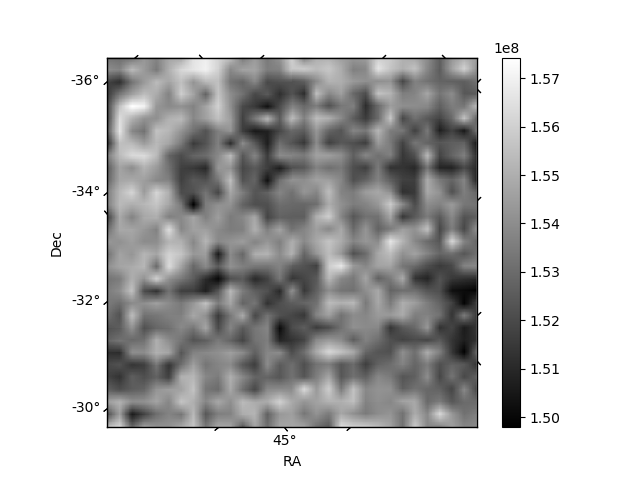
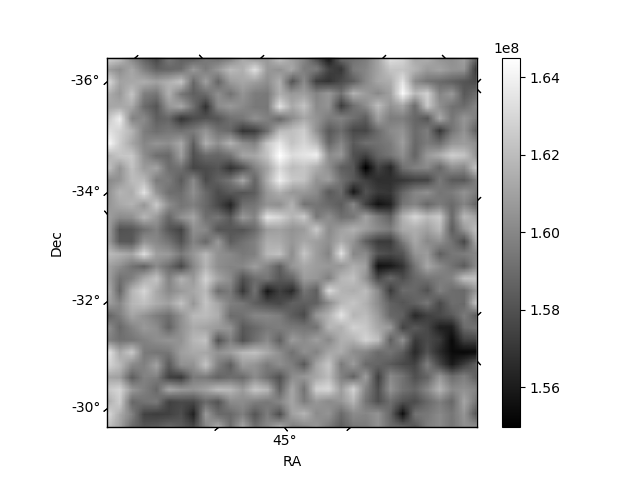
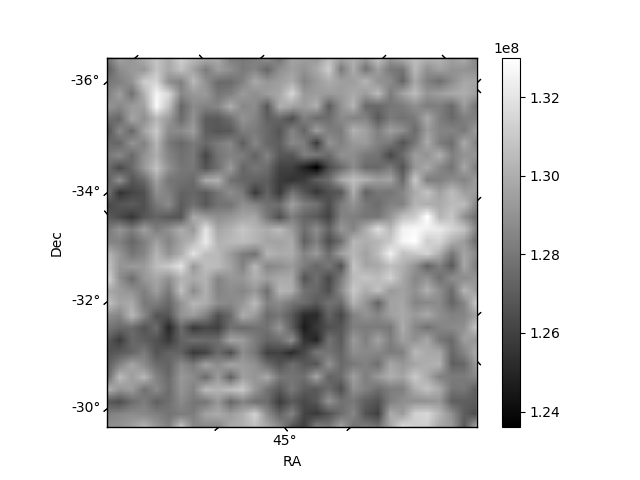
Histogram calculated using DETX and DETY for each event in the final _common_clean file
| Quadrant A | 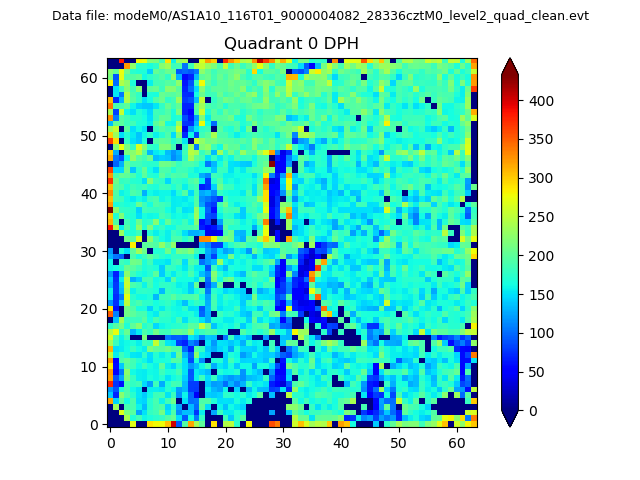 |
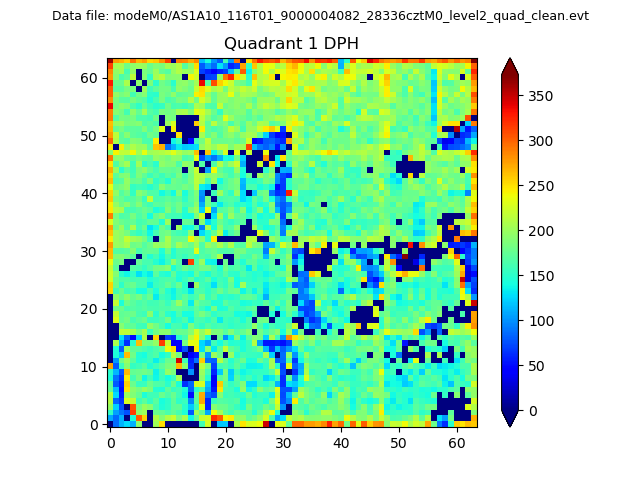 |
Quadrant B |
|---|---|---|---|
| Quadrant D | 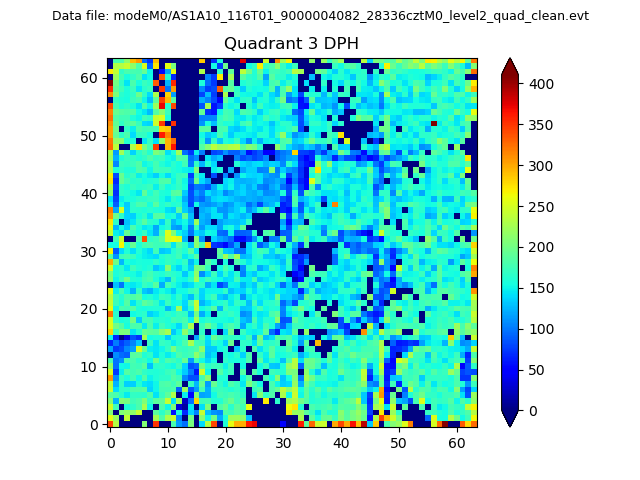 |
 |
Quadrant C |
| Plot type | Count rate plots | Images |
|---|---|---|
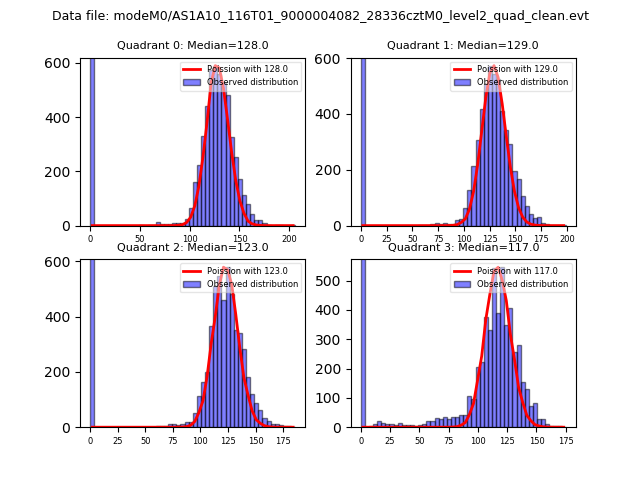
| Comparison with Poisson distribution Blue bars denote a histogram of data divided into 1 sec bins. Red curve is a Poisson curve with rate = median count rate of data. |
 |
 |
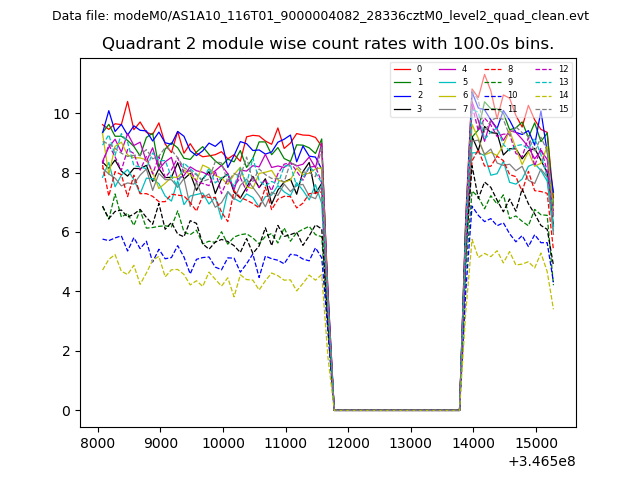
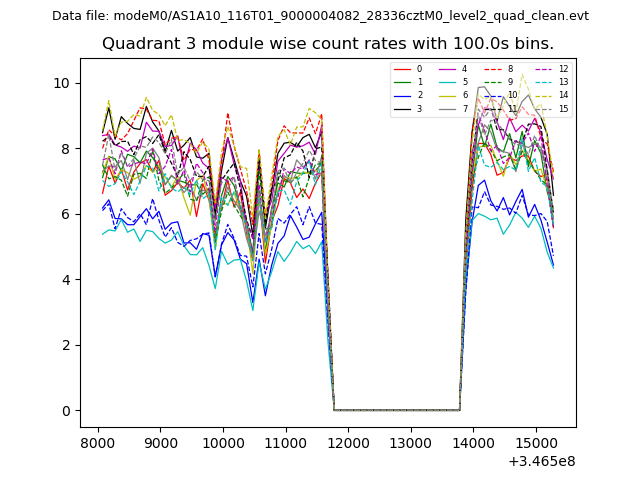
| Quadrant-wise count rates Data is divided into 100 sec bins |
 |
|
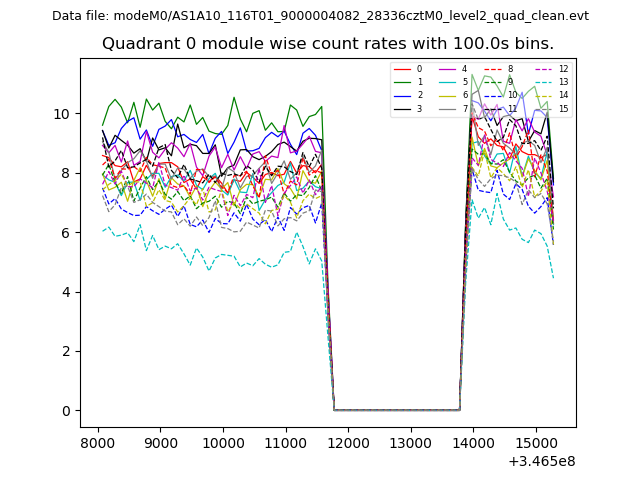
| Module-wise count rates for Quadrant A Data is divided into 100 sec bins |
 |
 |
| Module-wise count rates for Quadrant B Data is divided into 100 sec bins |
 |
 |
| Module-wise count rates for Quadrant C Data is divided into 100 sec bins |
 |
 |
| Module-wise count rates for Quadrant D Data is divided into 100 sec bins |
 |
 |
| Parameter | Plot |
|---|---|
| CZT HV Monitor | 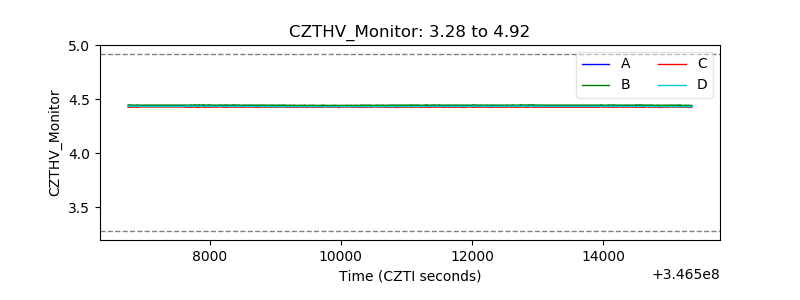 |
| D_VDD | 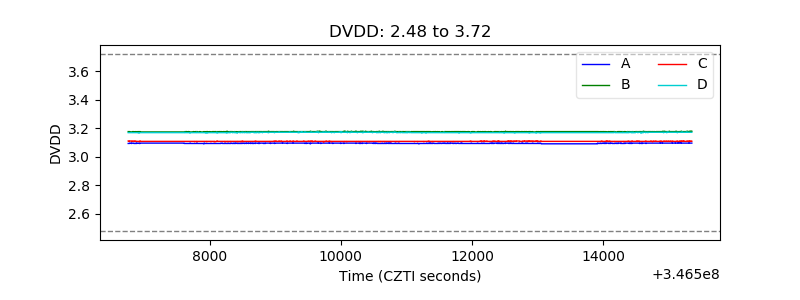 |
| Temperature 1 | 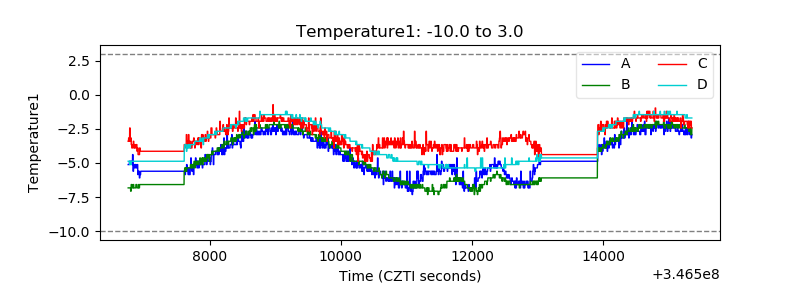 |
| Veto HV Monitor | 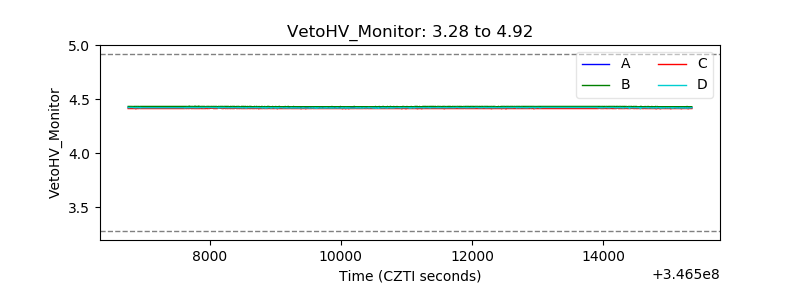 |
| Veto LLD | 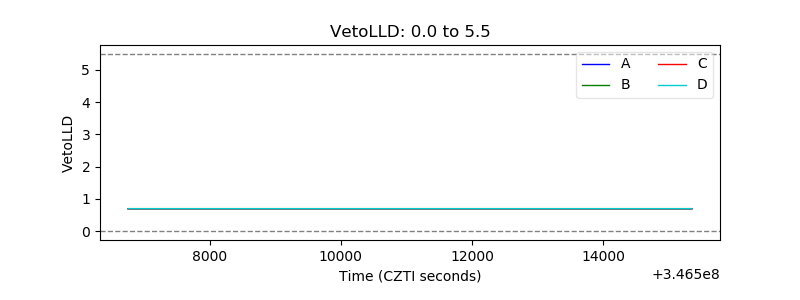 |
| Alpha Counter | 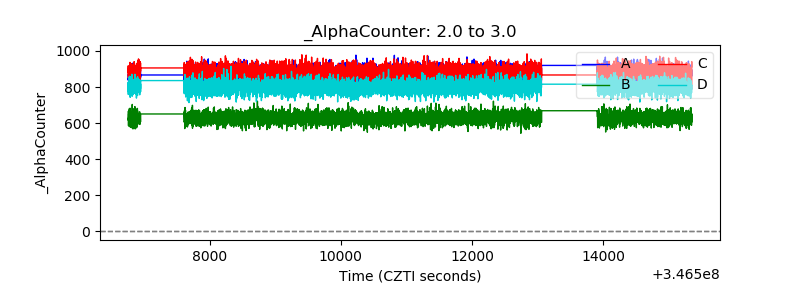 |
| _CPM_Rate | 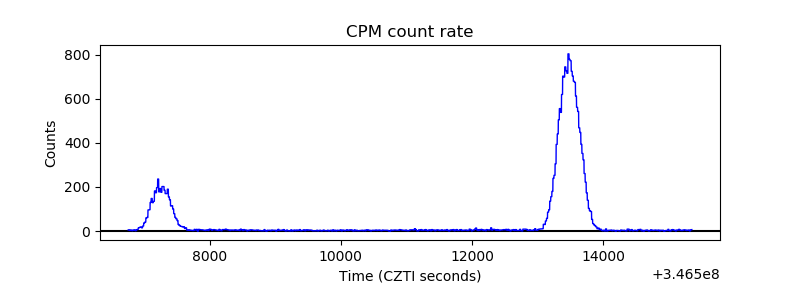 |
| CZT Counter | 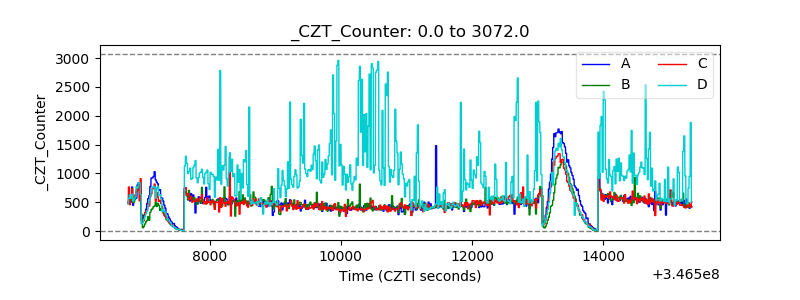 |
| +2.5 Volts monitor |  |
| +5 Volts monitor |  |
| _ROLL_ROT | 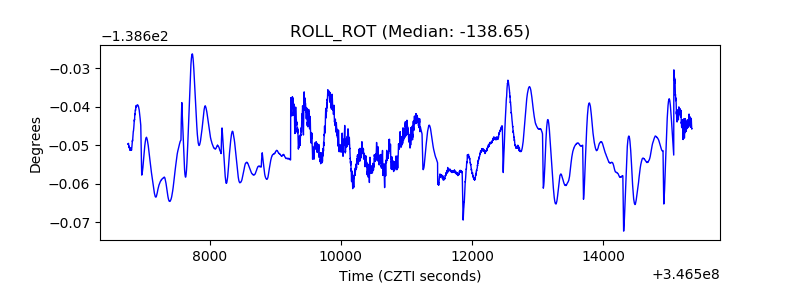 |
| _Roll_DEC | 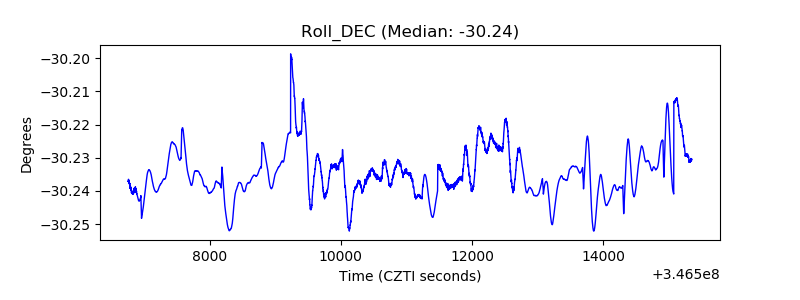 |
| _Roll_RA | 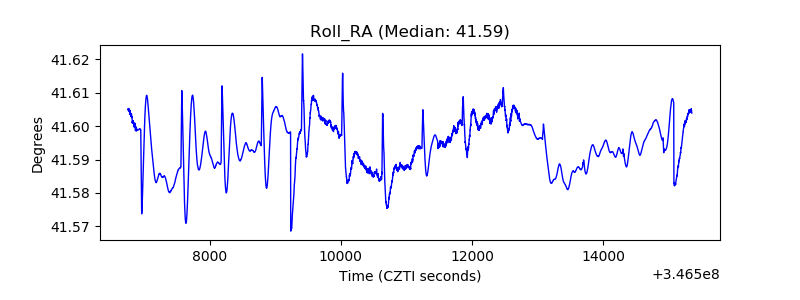 |
| Veto Counter | 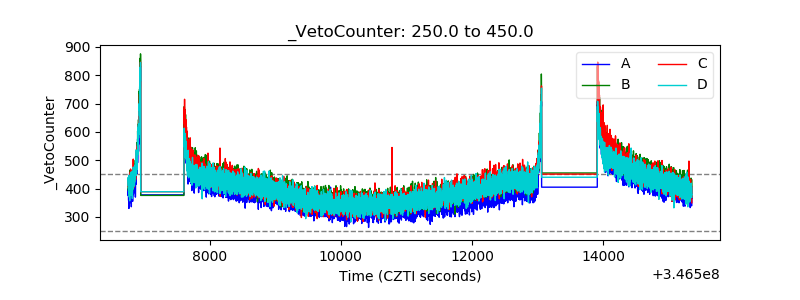 |