| Param | Original file | Final file |
|---|---|---|
| Filename | modeM0/AS1A10_116T01_9000004082_28339cztM0_level2.evt | modeM0/AS1A10_116T01_9000004082_28339cztM0_level2_quad_clean.evt |
| Size (bytes) | 482,667,840 | 96,249,600 |
| Size | 460.3 MB | 91.8 MB |
| Events in quadrant A | 3,168,267 | 639,589 |
| Events in quadrant B | 3,292,634 | 650,310 |
| Events in quadrant C | 3,119,078 | 603,313 |
| Events in quadrant D | 4,604,063 | 576,048 |
| Mode M9 | |||
|---|---|---|---|
| Quadrant | BADHDUFLAG | Total packets | Discarded packets |
| A | 0 | 12 | 0 |
| B | 0 | 12 | 0 |
| C | 0 | 12 | 0 |
| D | 0 | 12 | 0 |
| Mode M0 | |||
|---|---|---|---|
| Quadrant | BADHDUFLAG | Total packets | Discarded packets |
| A | 0 | 13558 | 0 |
| B | 0 | 13919 | 0 |
| C | 0 | 13363 | 0 |
| D | 0 | 17955 | 0 |
| Quadrant | Total seconds | Saturated seconds | Saturation percentage |
|---|---|---|---|
| A | 6392 | 70 | 1.095119% |
| B | 6392 | 72 | 1.126408% |
| C | 6392 | 92 | 1.439299% |
| D | 6391 | 248 | 3.880457% |
Noise dominated data is calculated using 1-second bins in cleaned event files. If a bin has >2000 counts, and if more than 50% of those come from <1% of pixels, then it is considered to be noise-dominated and hence unusable.
| Quadrant | # 1 sec bins | Bins with >0 counts | Bins with >2000 counts | High rate bins dominated by noise | Noise dominated (total time) | Noise dominated (detector-on time) | Marked lightcurve |
|---|---|---|---|---|---|---|---|
| A | 7527 | 6392 | 5 | 5 | 0.07% | 0.08% | 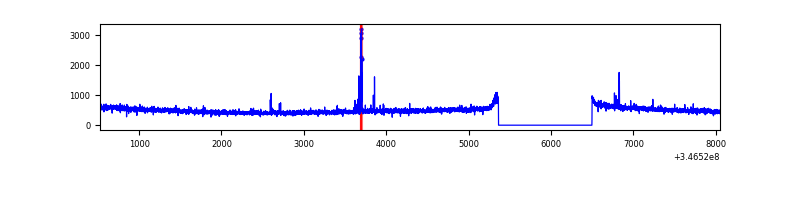 |
| B | 7527 | 6392 | 6 | 6 | 0.08% | 0.09% | 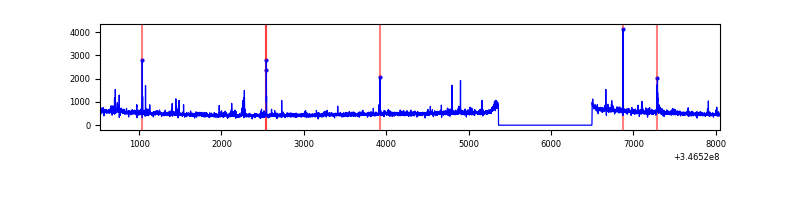 |
| C | 7527 | 6392 | 0 | 0 | 0.00% | 0.00% | 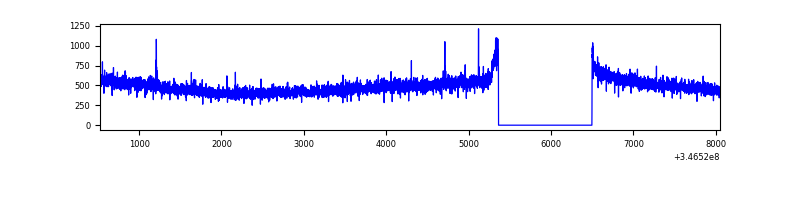 |
| D | 7526 | 6391 | 137 | 137 | 1.82% | 2.14% | 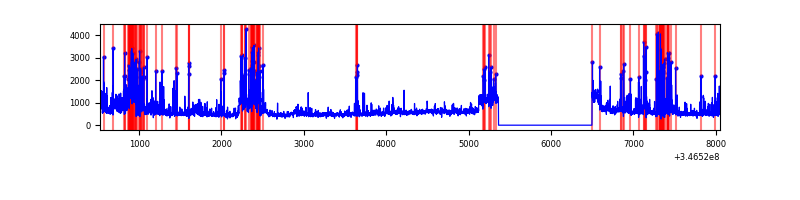 |
Top three noisy pixels from each quadrant. If the there are fewer than three noisy pixels in the level2.evt file, extra rows are filled as -1
| Pixel properties | Quadrant properties | ||||||
|---|---|---|---|---|---|---|---|
| Quadrant | DetID | PixID | Counts | Sigma | Mean | Median | Sigma |
| A | 12 | 96 | 45278 | 276.79 | 809 | 793 | 160.7 |
| A | 13 | 254 | 11056 | 63.86 | 809 | 793 | 160.7 |
| A | 3 | 137 | 7834 | 43.81 | 809 | 793 | 160.7 |
| B | 10 | 246 | 40246 | 257.5 | 805 | 785 | 153.2 |
| B | 0 | 183 | 32108 | 204.39 | 805 | 785 | 153.2 |
| B | 0 | 230 | 28812 | 182.89 | 805 | 785 | 153.2 |
| C | 14 | 238 | 124563 | 694.1 | 763 | 769 | 178.4 |
| C | 3 | 233 | 15238 | 81.13 | 763 | 769 | 178.4 |
| C | 13 | 61 | 5097 | 24.27 | 763 | 769 | 178.4 |
| D | 1 | 52 | 1072690 | 6013.52 | 756 | 736 | 178.3 |
| D | 8 | 195 | 408444 | 2287.19 | 756 | 736 | 178.3 |
| D | 2 | 250 | 138767 | 774.34 | 756 | 736 | 178.3 |
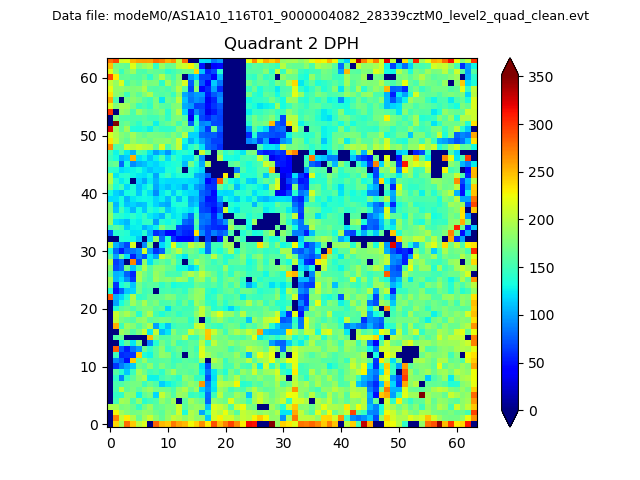
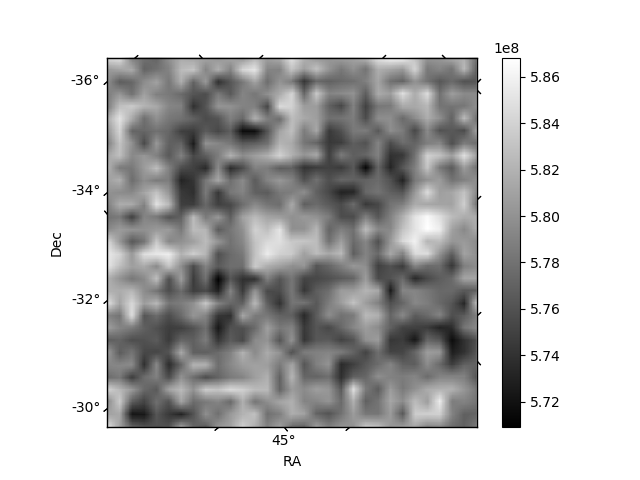
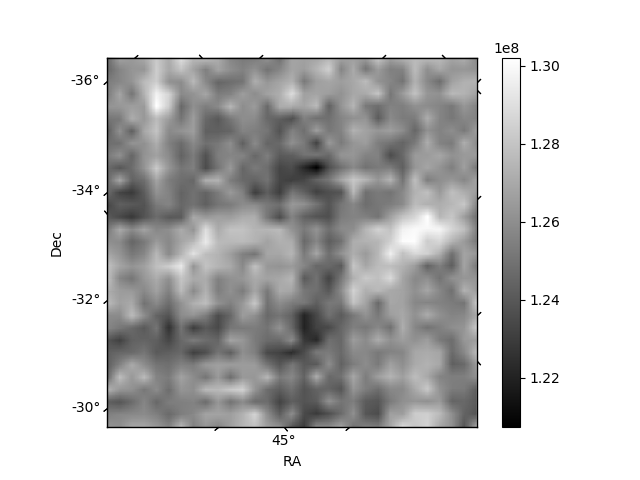
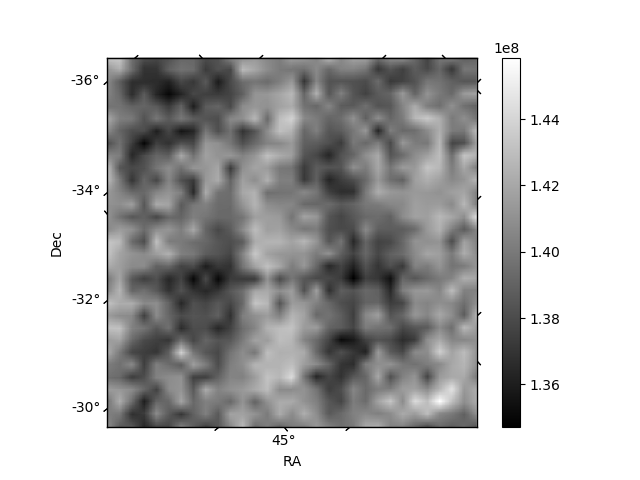
Histogram calculated using DETX and DETY for each event in the final _common_clean file
| Quadrant A | 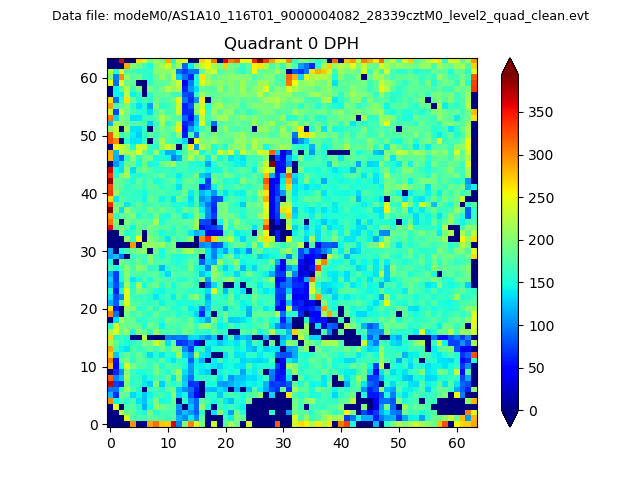 |
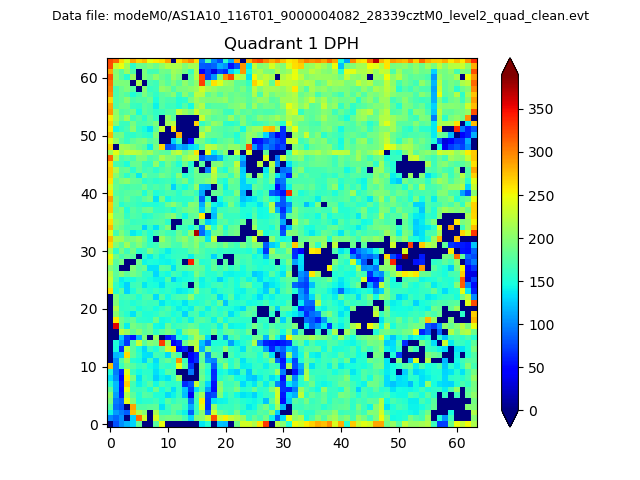 |
Quadrant B |
|---|---|---|---|
| Quadrant D | 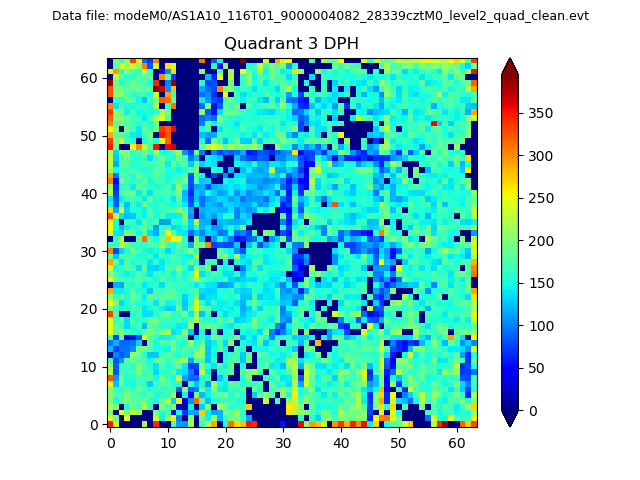 |
 |
Quadrant C |
| Plot type | Count rate plots | Images |
|---|---|---|
| Comparison with Poisson distribution Blue bars denote a histogram of data divided into 1 sec bins. Red curve is a Poisson curve with rate = median count rate of data. |
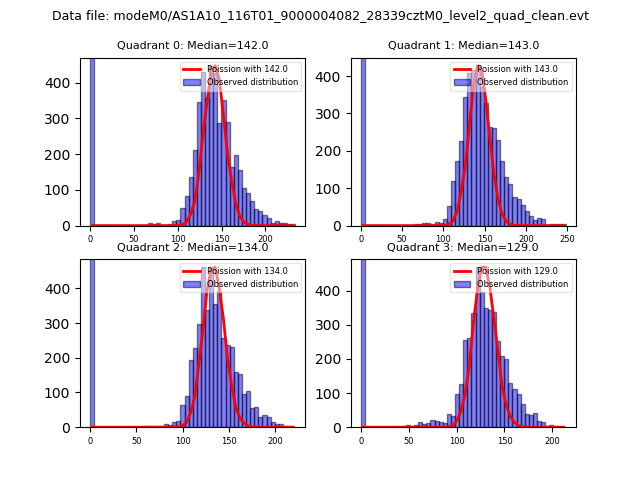 |
 |
| Quadrant-wise count rates Data is divided into 100 sec bins |
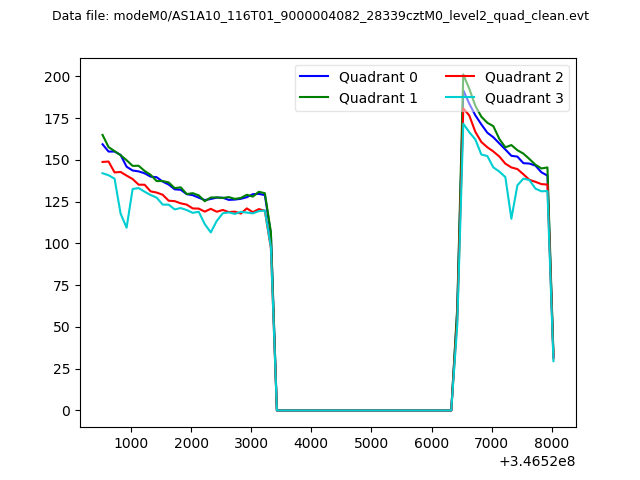 |
|
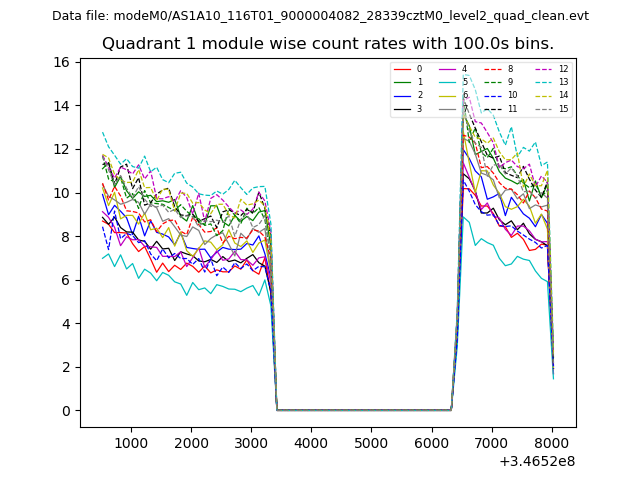
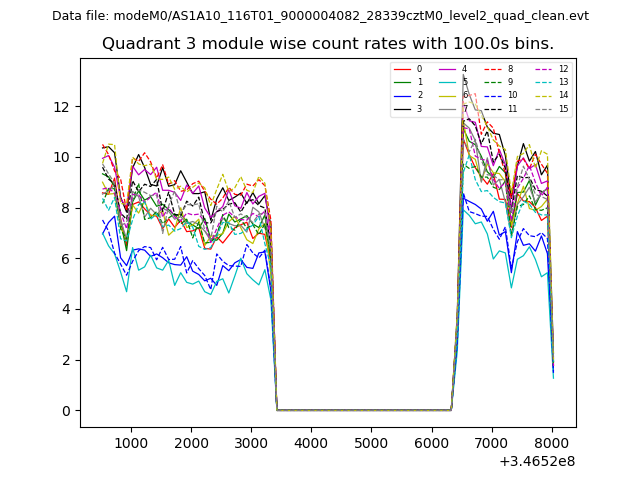
| Module-wise count rates for Quadrant A Data is divided into 100 sec bins |
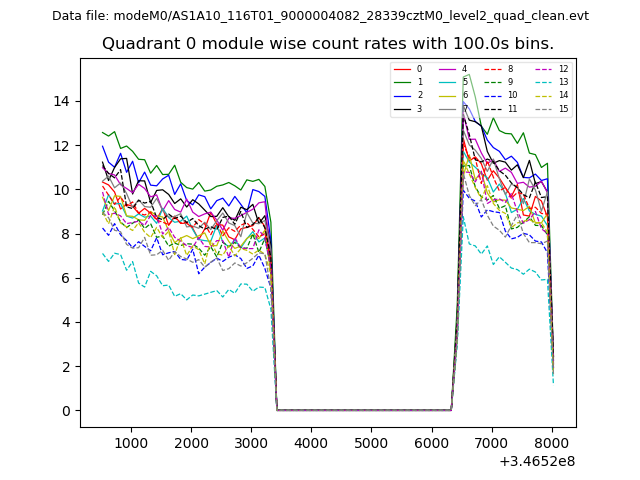 |
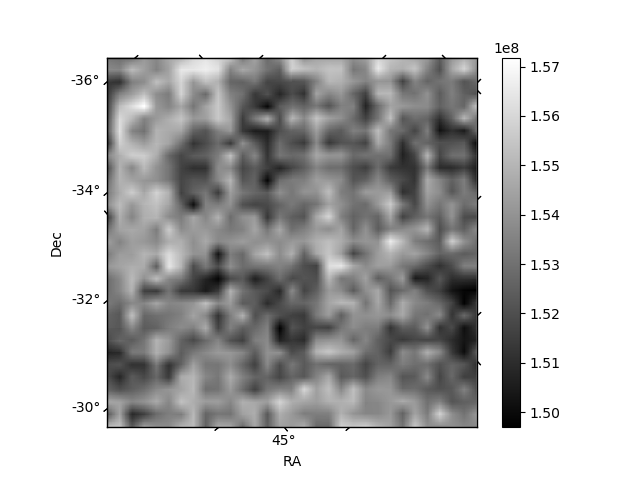 |
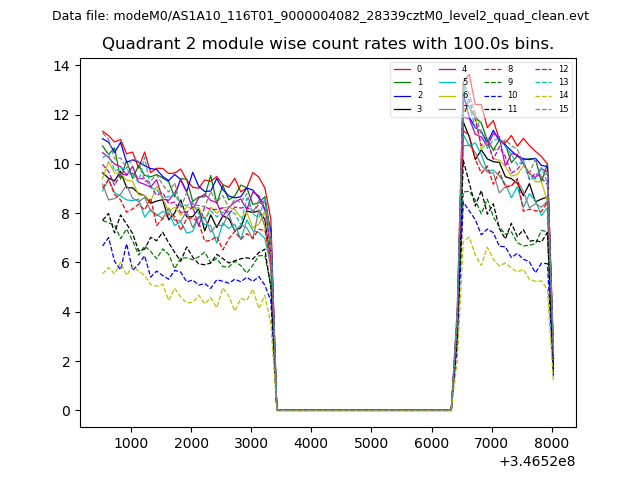
| Module-wise count rates for Quadrant B Data is divided into 100 sec bins |
 |
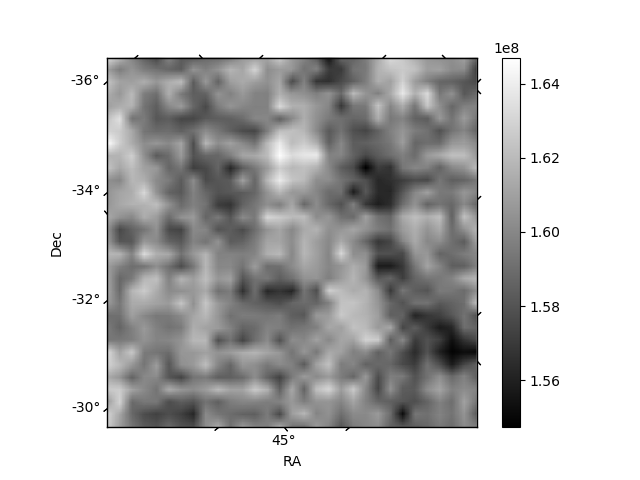 |
| Module-wise count rates for Quadrant C Data is divided into 100 sec bins |
 |
 |
| Module-wise count rates for Quadrant D Data is divided into 100 sec bins |
 |
 |
| Parameter | Plot |
|---|---|
| CZT HV Monitor | 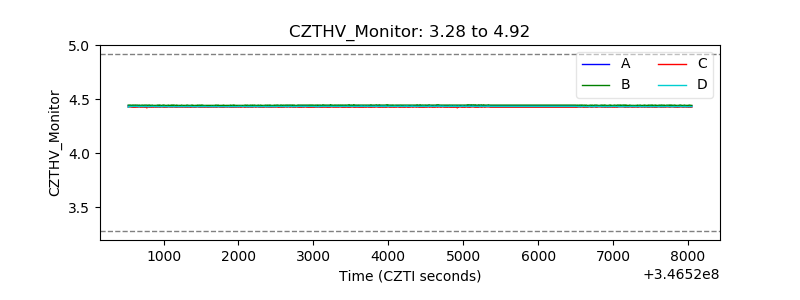 |
| D_VDD | 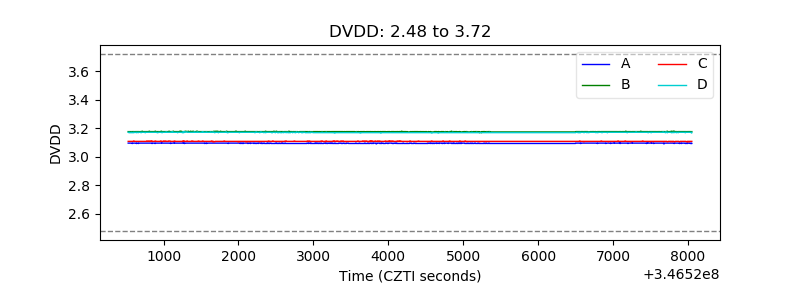 |
| Temperature 1 | 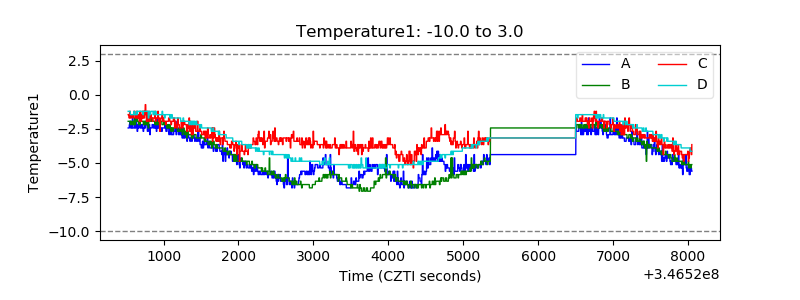 |
| Veto HV Monitor | 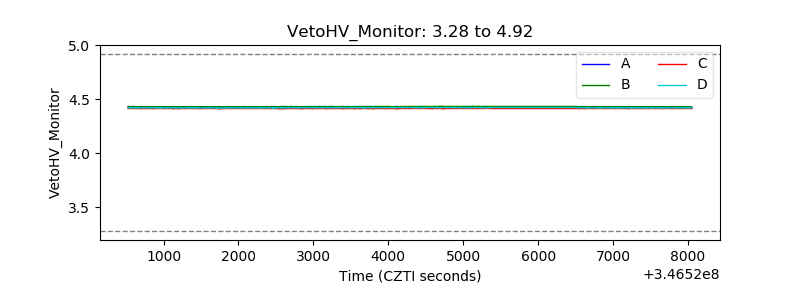 |
| Veto LLD | 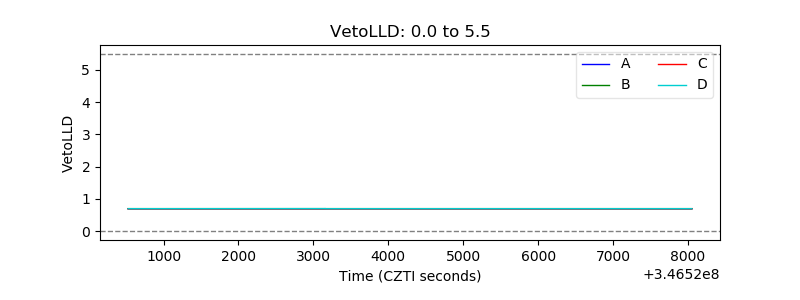 |
| Alpha Counter | 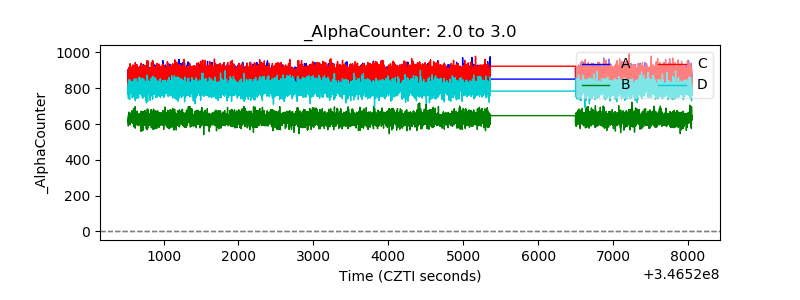 |
| _CPM_Rate | 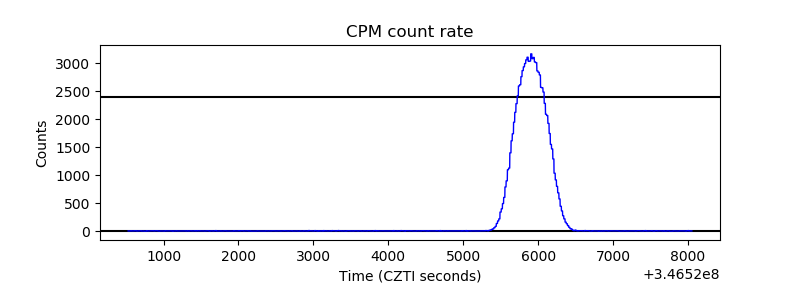 |
| CZT Counter | 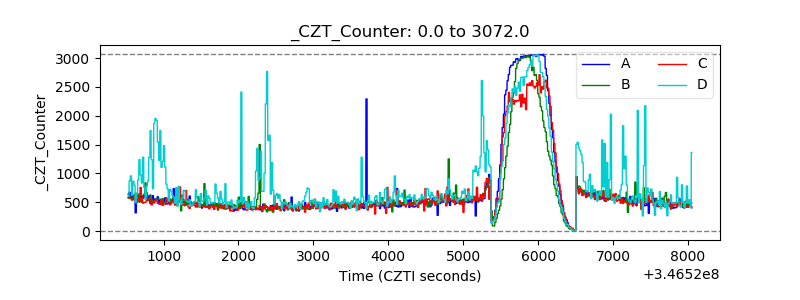 |
| +2.5 Volts monitor |  |
| +5 Volts monitor |  |
| _ROLL_ROT | 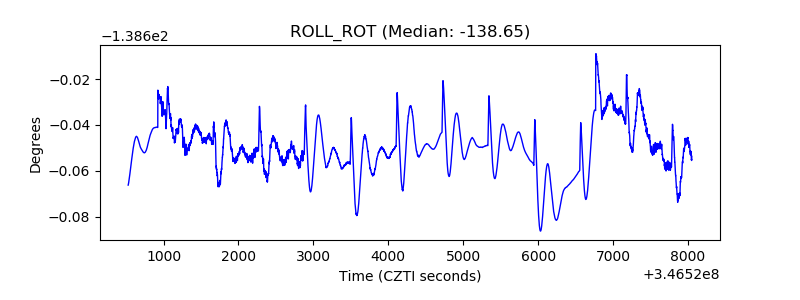 |
| _Roll_DEC | 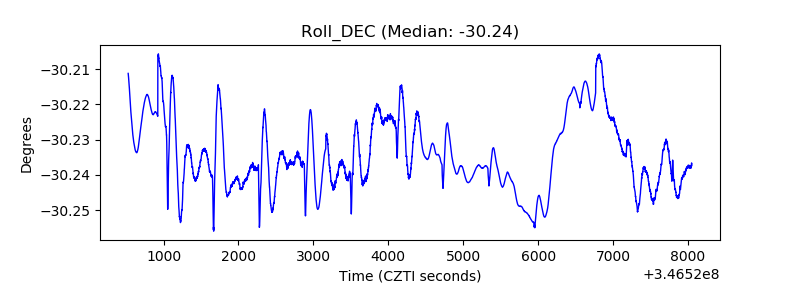 |
| _Roll_RA | 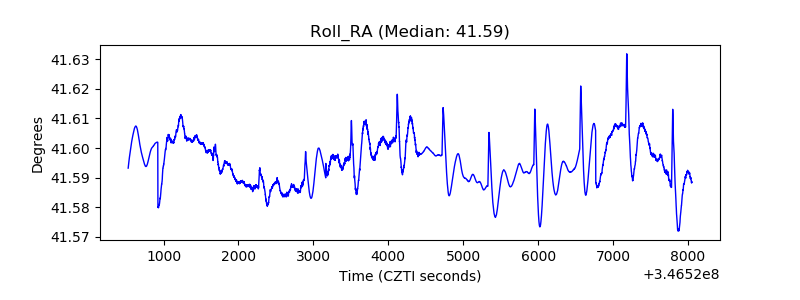 |
| Veto Counter | 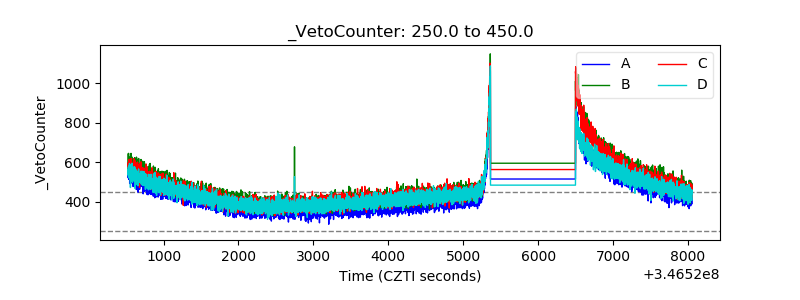 |