| Param | Original file | Final file |
|---|---|---|
| Filename | modeM0/AS1A10_116T01_9000004082_28340cztM0_level2.evt | modeM0/AS1A10_116T01_9000004082_28340cztM0_level2_quad_clean.evt |
| Size (bytes) | 485,496,000 | 97,257,600 |
| Size | 463.0 MB | 92.8 MB |
| Events in quadrant A | 3,251,739 | 644,023 |
| Events in quadrant B | 3,555,069 | 662,596 |
| Events in quadrant C | 3,203,386 | 613,754 |
| Events in quadrant D | 4,262,094 | 581,883 |
| Mode M9 | |||
|---|---|---|---|
| Quadrant | BADHDUFLAG | Total packets | Discarded packets |
| A | 0 | 12 | 0 |
| B | 0 | 12 | 0 |
| C | 0 | 12 | 0 |
| D | 0 | 12 | 0 |
| Mode M0 | |||
|---|---|---|---|
| Quadrant | BADHDUFLAG | Total packets | Discarded packets |
| A | 0 | 13697 | 0 |
| B | 0 | 14647 | 0 |
| C | 0 | 13457 | 0 |
| D | 0 | 16813 | 0 |
| Quadrant | Total seconds | Saturated seconds | Saturation percentage |
|---|---|---|---|
| A | 6345 | 40 | 0.630418% |
| B | 6346 | 92 | 1.449732% |
| C | 6346 | 71 | 1.118815% |
| D | 6345 | 185 | 2.915682% |
Noise dominated data is calculated using 1-second bins in cleaned event files. If a bin has >2000 counts, and if more than 50% of those come from <1% of pixels, then it is considered to be noise-dominated and hence unusable.
| Quadrant | # 1 sec bins | Bins with >0 counts | Bins with >2000 counts | High rate bins dominated by noise | Noise dominated (total time) | Noise dominated (detector-on time) | Marked lightcurve |
|---|---|---|---|---|---|---|---|
| A | 7605 | 6346 | 0 | 0 | 0.00% | 0.00% | 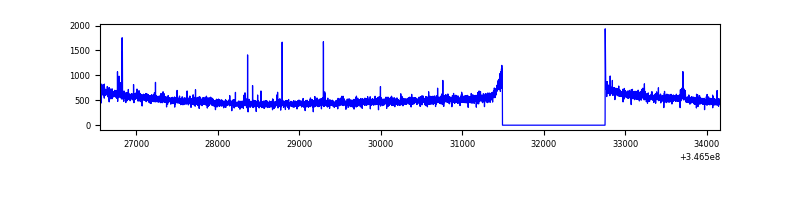 |
| B | 7606 | 6346 | 29 | 29 | 0.38% | 0.46% | 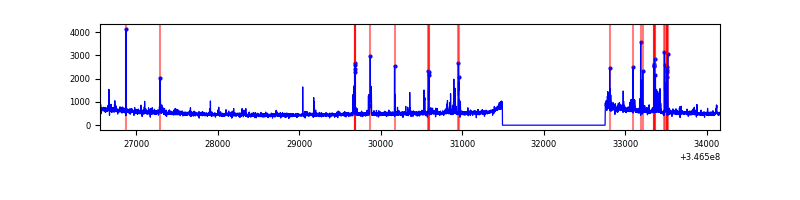 |
| C | 7606 | 6347 | 0 | 0 | 0.00% | 0.00% | 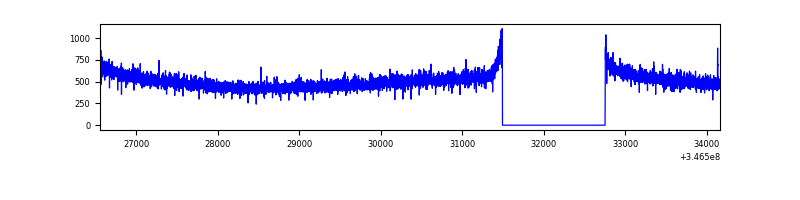 |
| D | 7605 | 6346 | 159 | 159 | 2.09% | 2.51% | 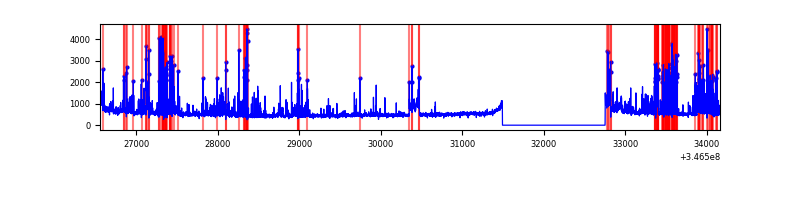 |
Top three noisy pixels from each quadrant. If the there are fewer than three noisy pixels in the level2.evt file, extra rows are filled as -1
| Pixel properties | Quadrant properties | ||||||
|---|---|---|---|---|---|---|---|
| Quadrant | DetID | PixID | Counts | Sigma | Mean | Median | Sigma |
| A | 15 | 174 | 23526 | 137.47 | 830 | 814 | 165.2 |
| A | 12 | 96 | 23067 | 134.69 | 830 | 814 | 165.2 |
| A | 13 | 254 | 10962 | 61.42 | 830 | 814 | 165.2 |
| B | 10 | 245 | 200404 | 1291.7 | 828 | 811 | 154.5 |
| B | 10 | 246 | 45703 | 290.53 | 828 | 811 | 154.5 |
| B | 15 | 32 | 25702 | 161.09 | 828 | 811 | 154.5 |
| C | 14 | 238 | 128148 | 695.27 | 787 | 794 | 183.2 |
| C | 13 | 61 | 5236 | 24.25 | 787 | 794 | 183.2 |
| C | 7 | 247 | 4243 | 18.83 | 787 | 794 | 183.2 |
| D | 1 | 52 | 893586 | 4855.4 | 781 | 762 | 183.9 |
| D | 8 | 195 | 267814 | 1452.29 | 781 | 762 | 183.9 |
| D | 2 | 250 | 114582 | 618.98 | 781 | 762 | 183.9 |
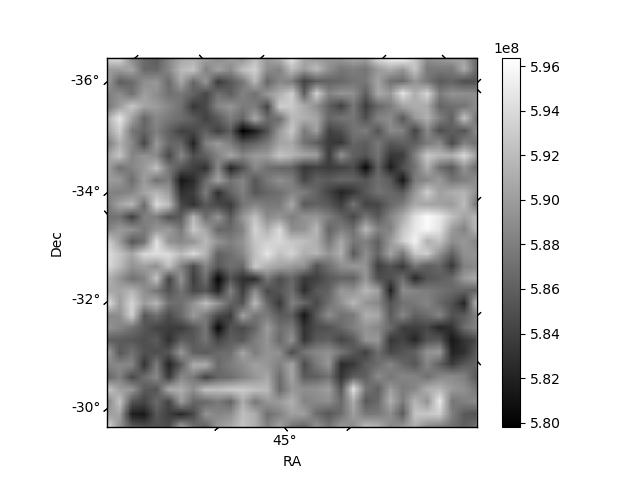
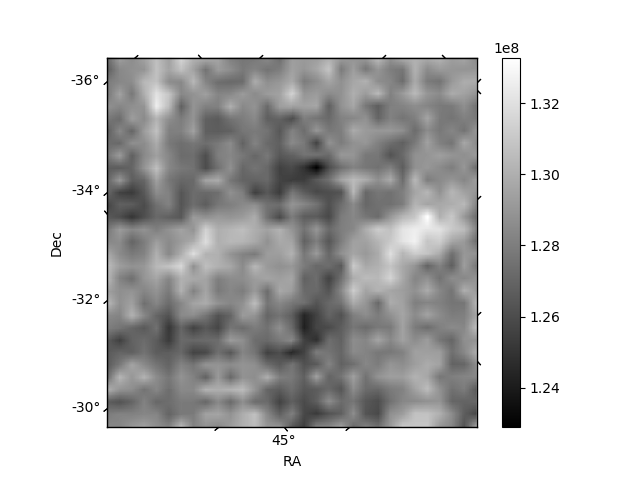
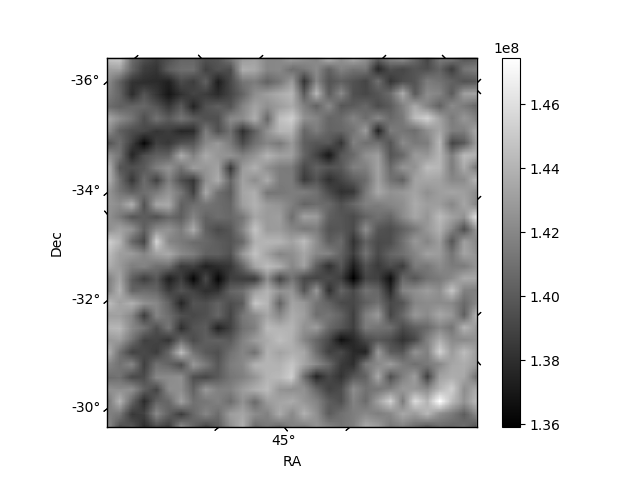
Histogram calculated using DETX and DETY for each event in the final _common_clean file
| Quadrant A | 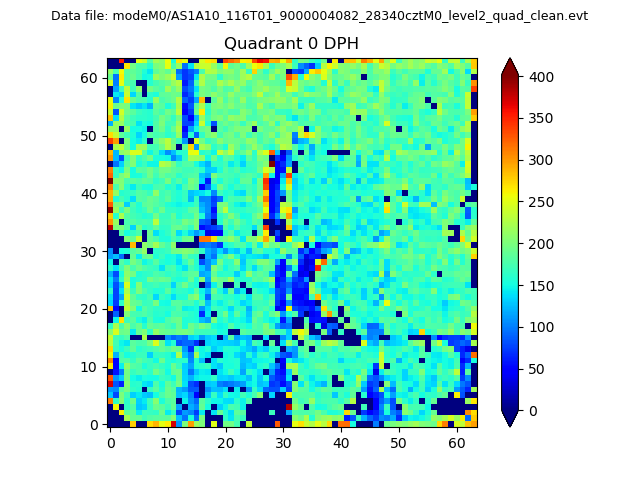 |
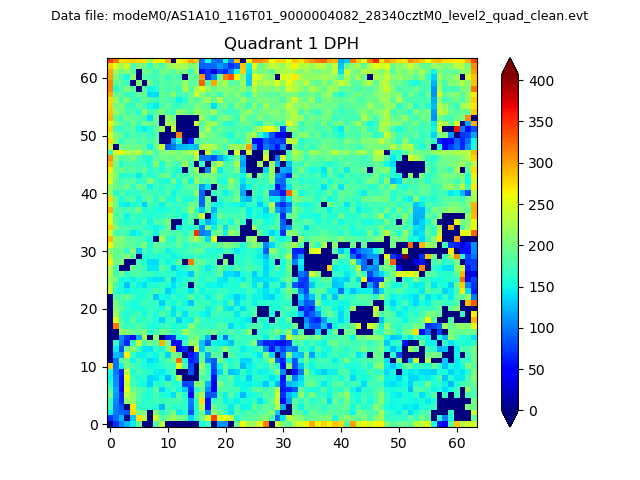 |
Quadrant B |
|---|---|---|---|
| Quadrant D | 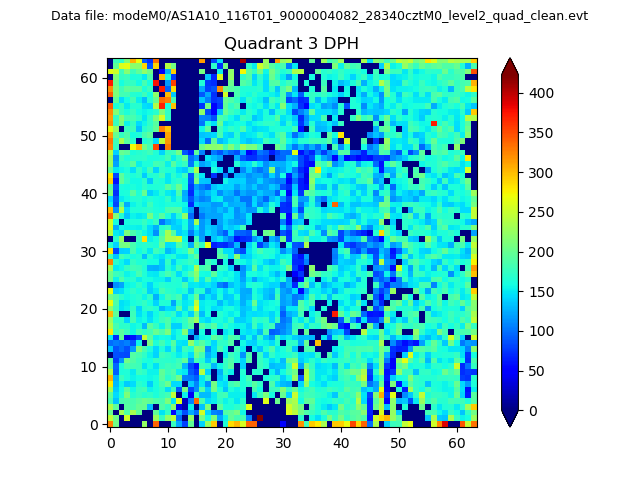 |
 |
Quadrant C |
| Plot type | Count rate plots | Images |
|---|---|---|
| Comparison with Poisson distribution Blue bars denote a histogram of data divided into 1 sec bins. Red curve is a Poisson curve with rate = median count rate of data. |
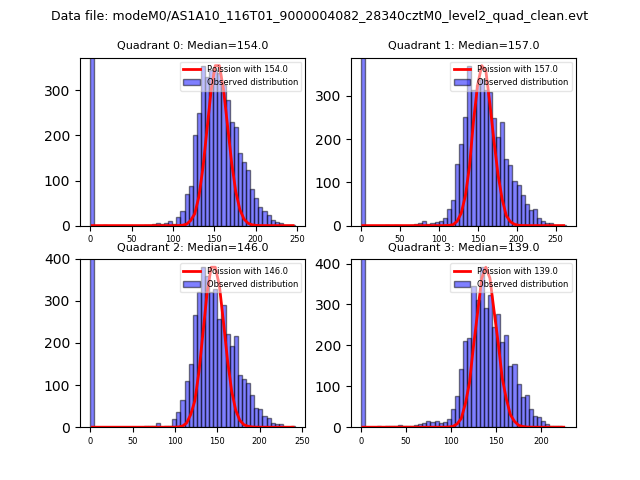 |
 |
| Quadrant-wise count rates Data is divided into 100 sec bins |
 |
|
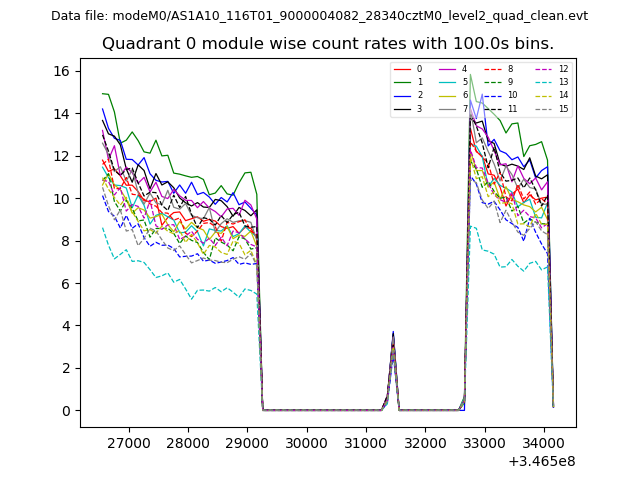
| Module-wise count rates for Quadrant A Data is divided into 100 sec bins |
 |
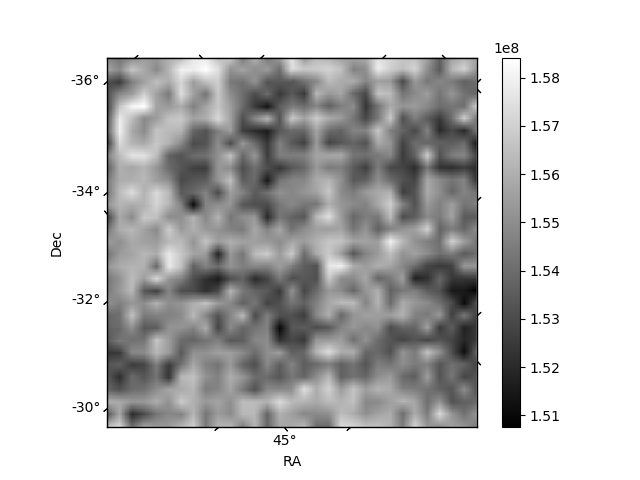 |
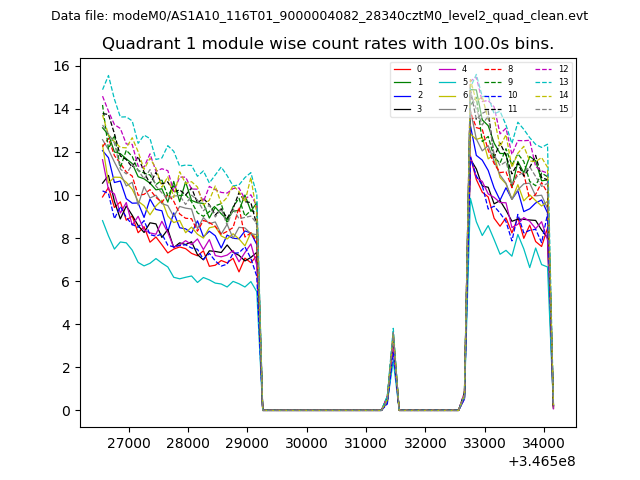
| Module-wise count rates for Quadrant B Data is divided into 100 sec bins |
 |
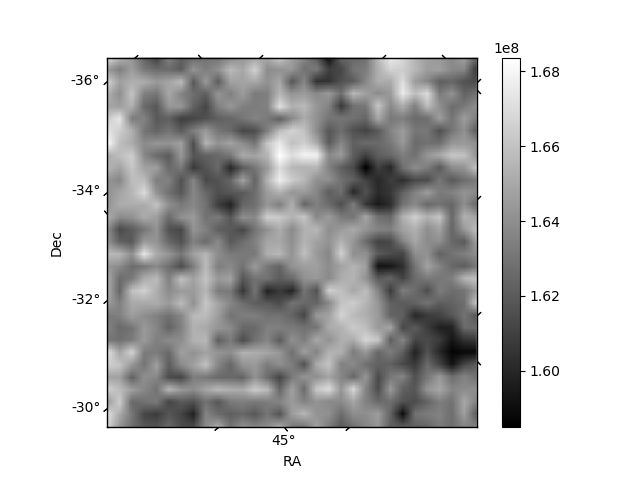 |
| Module-wise count rates for Quadrant C Data is divided into 100 sec bins |
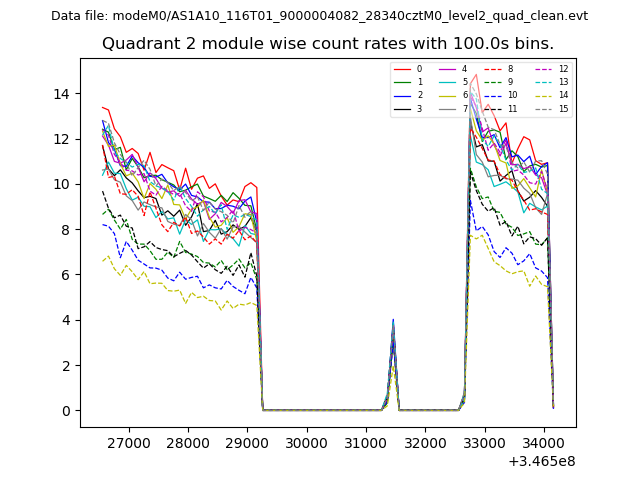 |
 |
| Module-wise count rates for Quadrant D Data is divided into 100 sec bins |
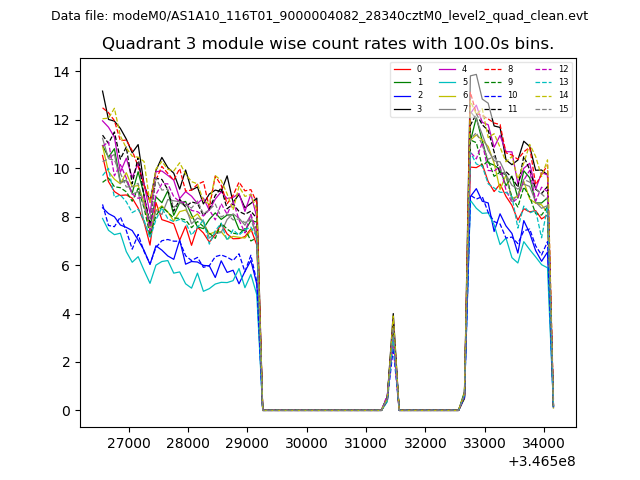 |
 |
| Parameter | Plot |
|---|---|
| CZT HV Monitor | 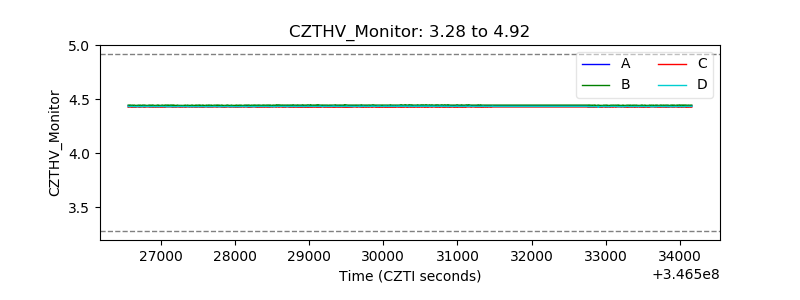 |
| D_VDD | 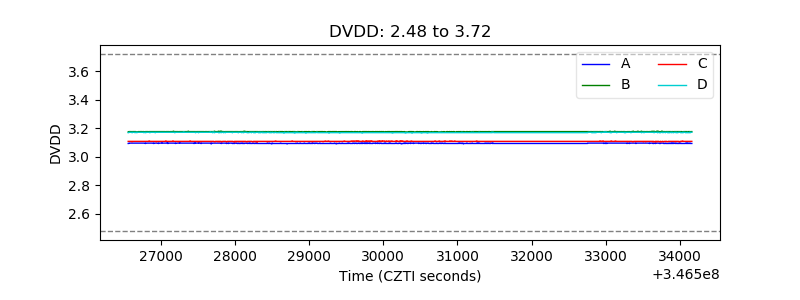 |
| Temperature 1 | 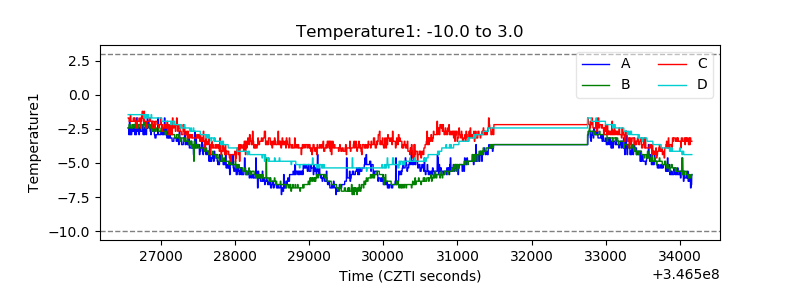 |
| Veto HV Monitor | 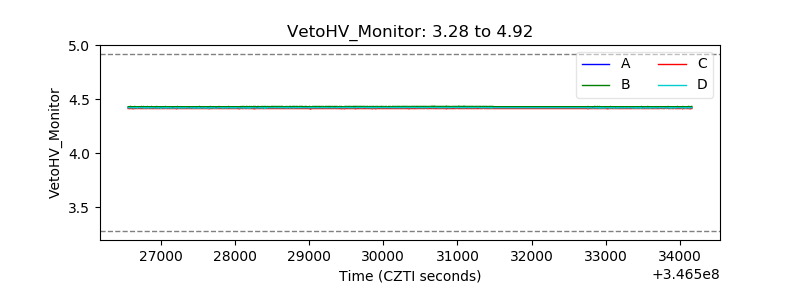 |
| Veto LLD | 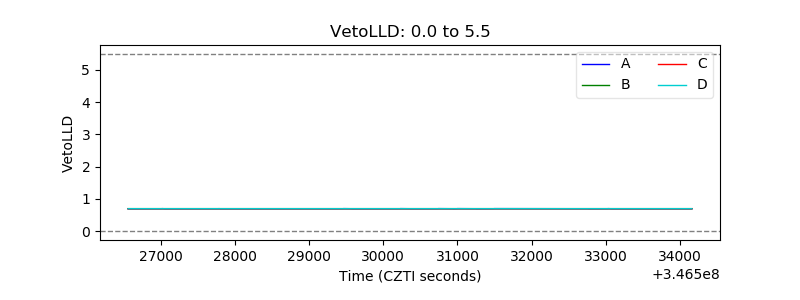 |
| Alpha Counter | 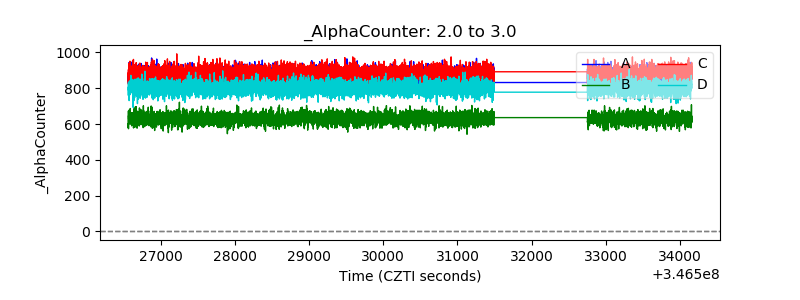 |
| _CPM_Rate | 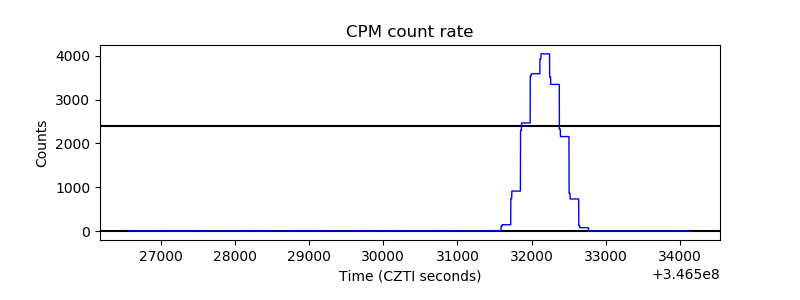 |
| CZT Counter | 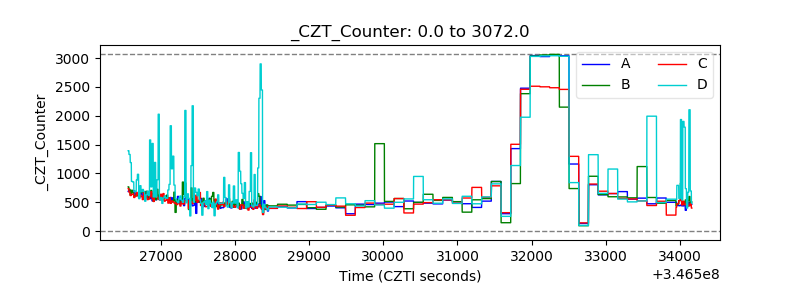 |
| +2.5 Volts monitor |  |
| +5 Volts monitor |  |
| _ROLL_ROT |  |
| _Roll_DEC | 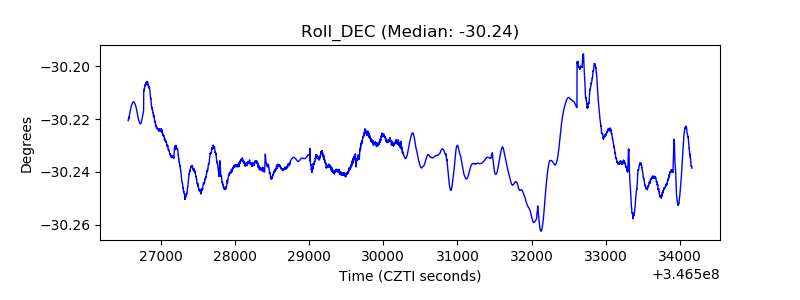 |
| _Roll_RA | 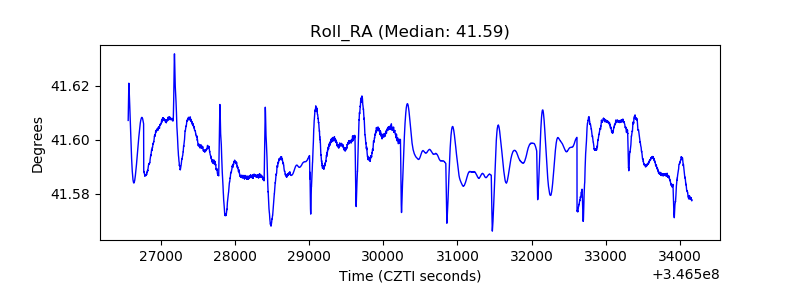 |
| Veto Counter | 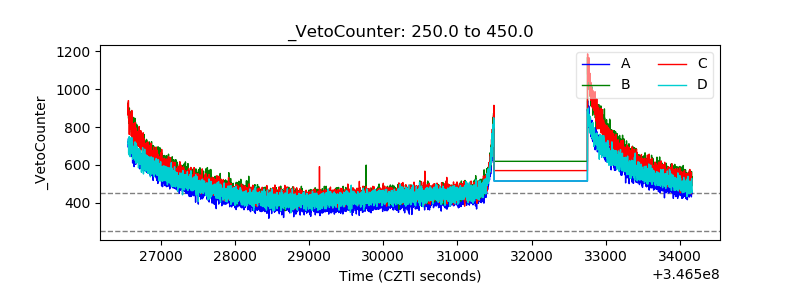 |