| Param | Original file | Final file |
|---|---|---|
| Filename | modeM0/AS1A10_116T01_9000004082_28341cztM0_level2.evt | modeM0/AS1A10_116T01_9000004082_28341cztM0_level2_quad_clean.evt |
| Size (bytes) | 539,602,560 | 95,880,960 |
| Size | 514.6 MB | 91.4 MB |
| Events in quadrant A | 3,228,424 | 640,139 |
| Events in quadrant B | 4,116,798 | 654,752 |
| Events in quadrant C | 3,214,553 | 621,494 |
| Events in quadrant D | 5,366,278 | 558,591 |
| Mode M9 | |||
|---|---|---|---|
| Quadrant | BADHDUFLAG | Total packets | Discarded packets |
| A | 0 | 15 | 0 |
| B | 0 | 16 | 0 |
| C | 0 | 16 | 0 |
| D | 0 | 16 | 0 |
| Mode M0 | |||
|---|---|---|---|
| Quadrant | BADHDUFLAG | Total packets | Discarded packets |
| A | 0 | 13386 | 0 |
| B | 0 | 16189 | 0 |
| C | 0 | 13235 | 0 |
| D | 0 | 19998 | 0 |
| Quadrant | Total seconds | Saturated seconds | Saturation percentage |
|---|---|---|---|
| A | 6141 | 29 | 0.472236% |
| B | 6141 | 230 | 3.745318% |
| C | 6140 | 51 | 0.830619% |
| D | 6140 | 508 | 8.273616% |
Noise dominated data is calculated using 1-second bins in cleaned event files. If a bin has >2000 counts, and if more than 50% of those come from <1% of pixels, then it is considered to be noise-dominated and hence unusable.
| Quadrant | # 1 sec bins | Bins with >0 counts | Bins with >2000 counts | High rate bins dominated by noise | Noise dominated (total time) | Noise dominated (detector-on time) | Marked lightcurve |
|---|---|---|---|---|---|---|---|
| A | 7486 | 6142 | 0 | 0 | 0.00% | 0.00% | 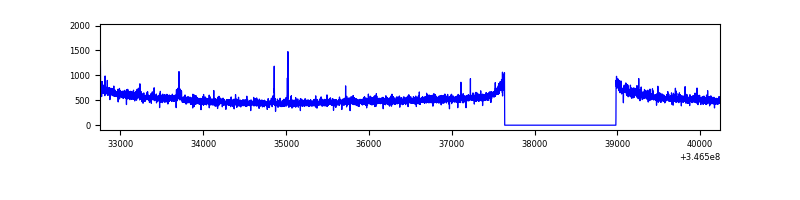 |
| B | 7486 | 6142 | 141 | 141 | 1.88% | 2.30% | 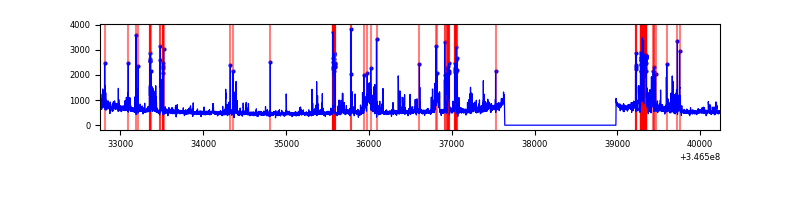 |
| C | 7485 | 6141 | 0 | 0 | 0.00% | 0.00% | 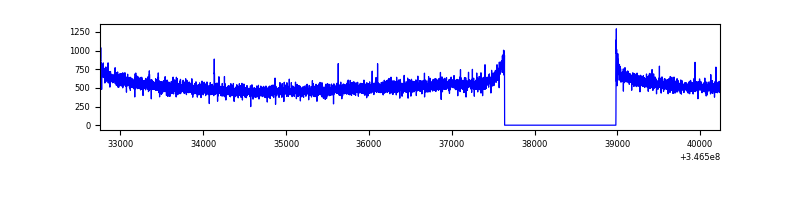 |
| D | 7485 | 6141 | 484 | 484 | 6.47% | 7.88% | 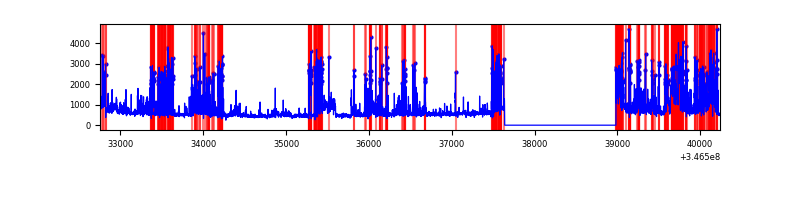 |
Top three noisy pixels from each quadrant. If the there are fewer than three noisy pixels in the level2.evt file, extra rows are filled as -1
| Pixel properties | Quadrant properties | ||||||
|---|---|---|---|---|---|---|---|
| Quadrant | DetID | PixID | Counts | Sigma | Mean | Median | Sigma |
| A | 15 | 190 | 25960 | 155.21 | 821 | 808 | 162.0 |
| A | 15 | 174 | 22315 | 132.72 | 821 | 808 | 162.0 |
| A | 13 | 254 | 10398 | 59.18 | 821 | 808 | 162.0 |
| B | 10 | 245 | 733922 | 4832.79 | 817 | 799 | 151.7 |
| B | 10 | 246 | 130224 | 853.18 | 817 | 799 | 151.7 |
| B | 15 | 32 | 20831 | 132.05 | 817 | 799 | 151.7 |
| C | 14 | 238 | 130851 | 711.5 | 788 | 795 | 182.8 |
| C | 3 | 233 | 7220 | 35.15 | 788 | 795 | 182.8 |
| C | 13 | 61 | 5461 | 25.53 | 788 | 795 | 182.8 |
| D | 1 | 52 | 2037858 | 11470.56 | 755 | 737 | 177.6 |
| D | 8 | 195 | 336120 | 1888.46 | 755 | 737 | 177.6 |
| D | 2 | 250 | 112387 | 628.67 | 755 | 737 | 177.6 |
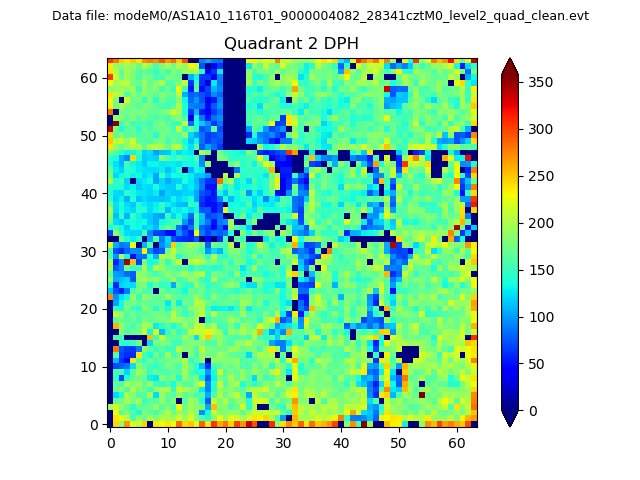
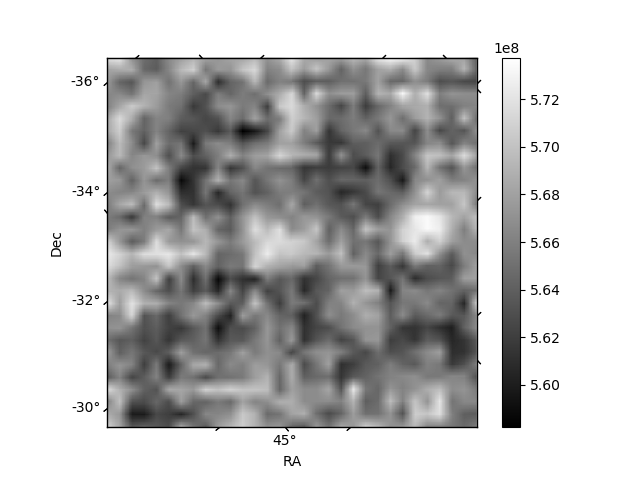
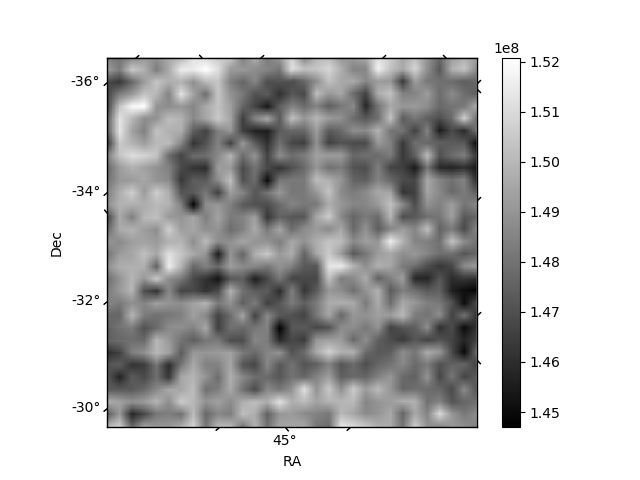
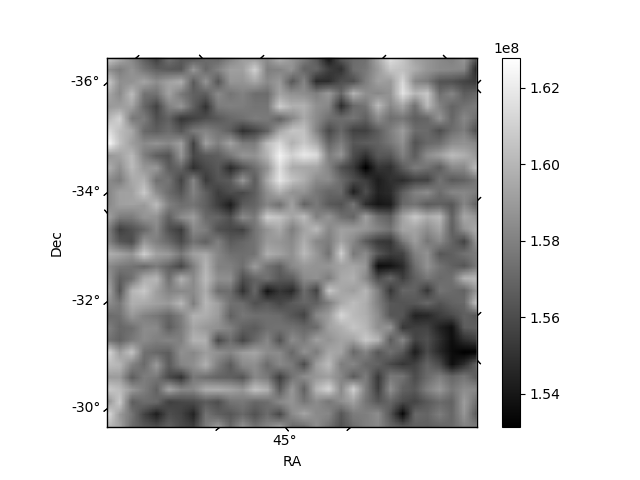
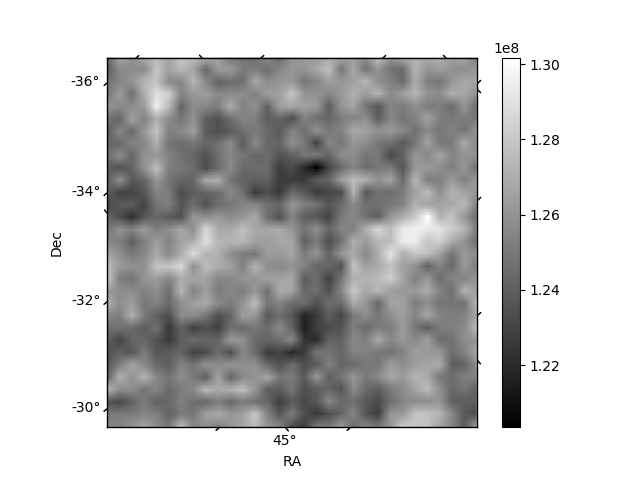
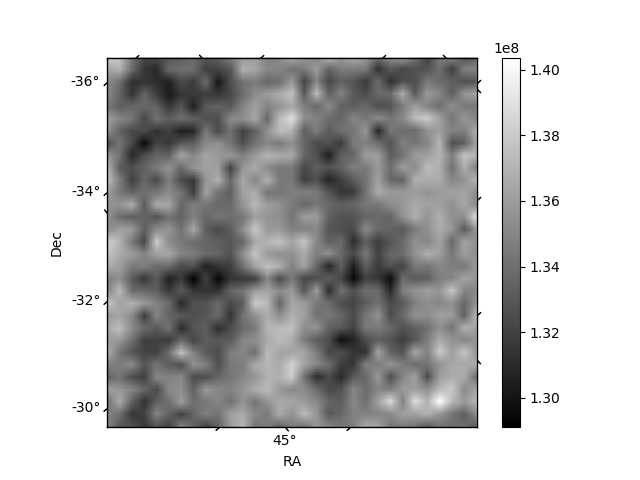
Histogram calculated using DETX and DETY for each event in the final _common_clean file
| Quadrant A | 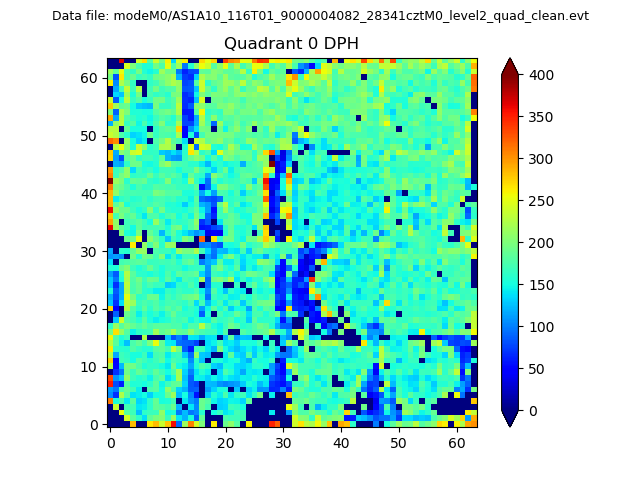 |
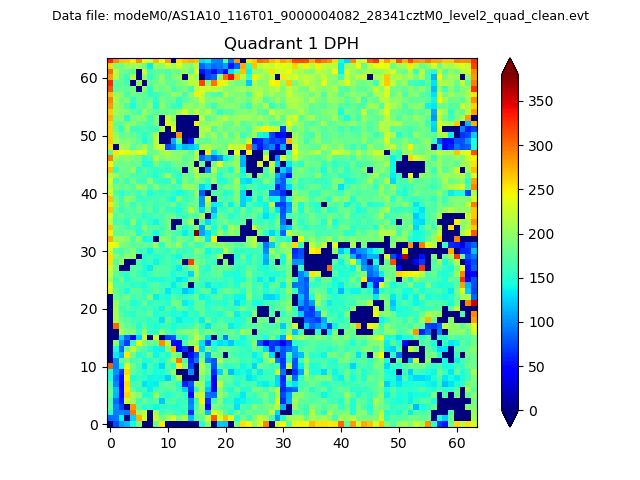 |
Quadrant B |
|---|---|---|---|
| Quadrant D | 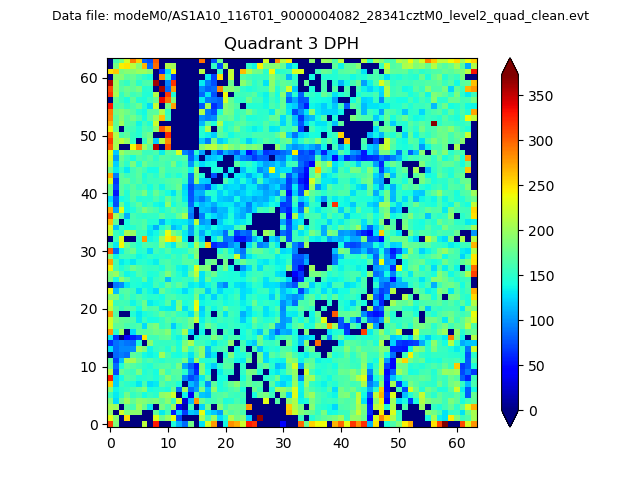 |
 |
Quadrant C |
| Plot type | Count rate plots | Images |
|---|---|---|
| Comparison with Poisson distribution Blue bars denote a histogram of data divided into 1 sec bins. Red curve is a Poisson curve with rate = median count rate of data. |
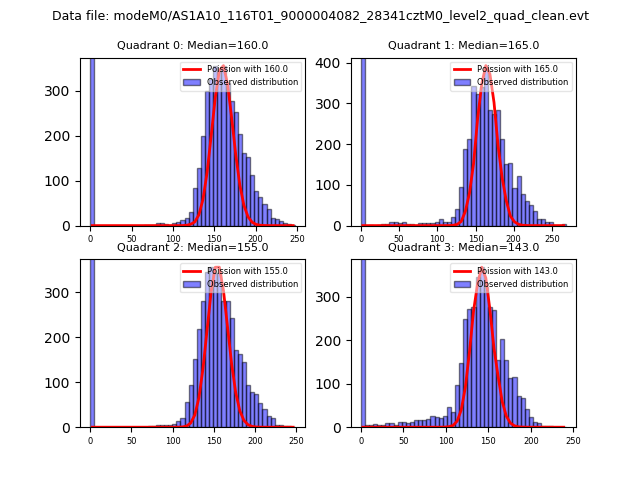 |
 |
| Quadrant-wise count rates Data is divided into 100 sec bins |
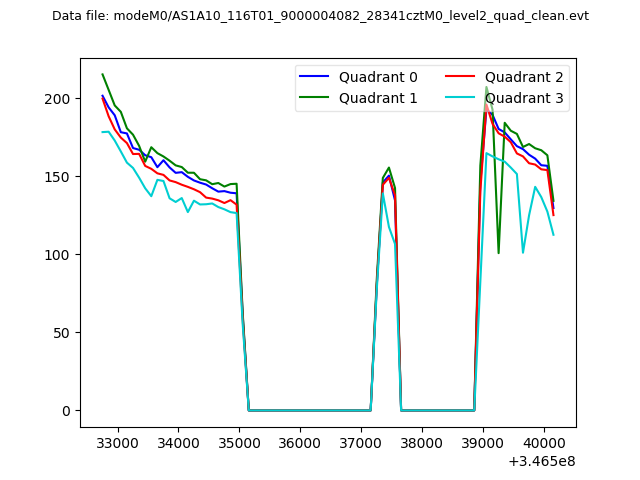 |
|
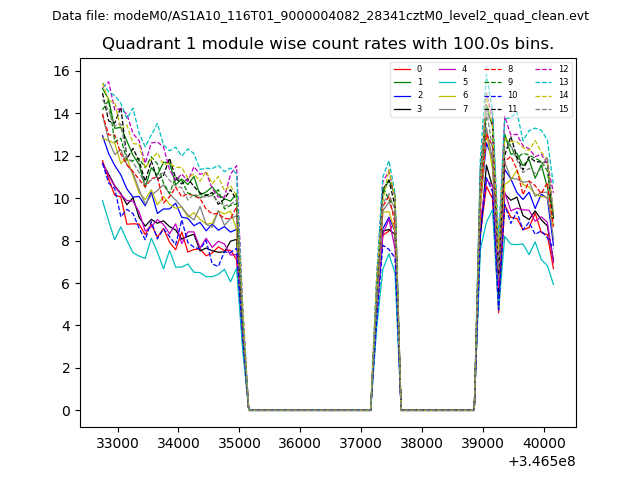
| Module-wise count rates for Quadrant A Data is divided into 100 sec bins |
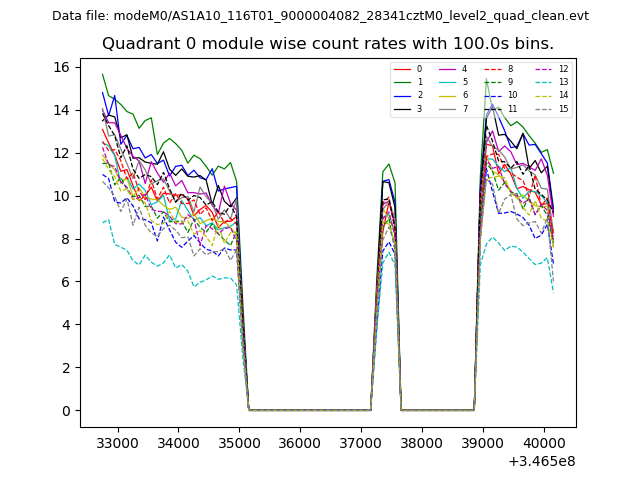 |
 |
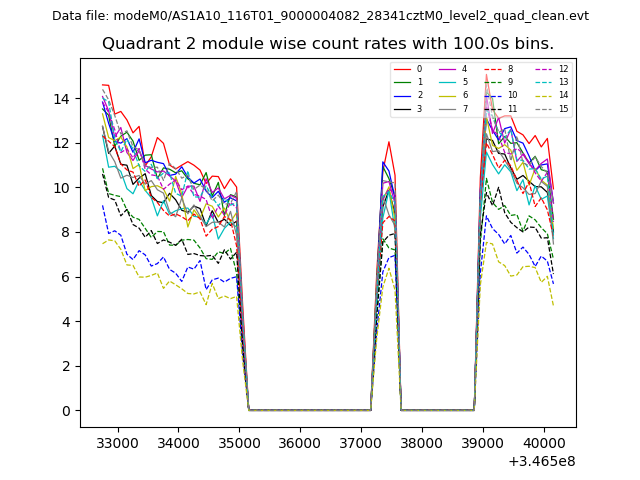
| Module-wise count rates for Quadrant B Data is divided into 100 sec bins |
 |
 |
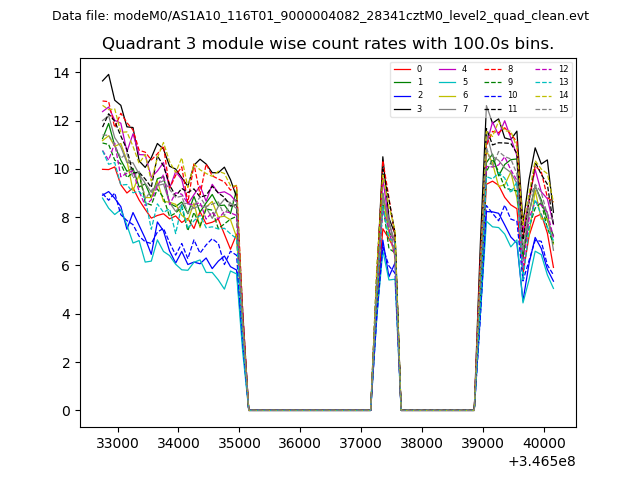
| Module-wise count rates for Quadrant C Data is divided into 100 sec bins |
 |
 |
| Module-wise count rates for Quadrant D Data is divided into 100 sec bins |
 |
 |
| Parameter | Plot |
|---|---|
| CZT HV Monitor | 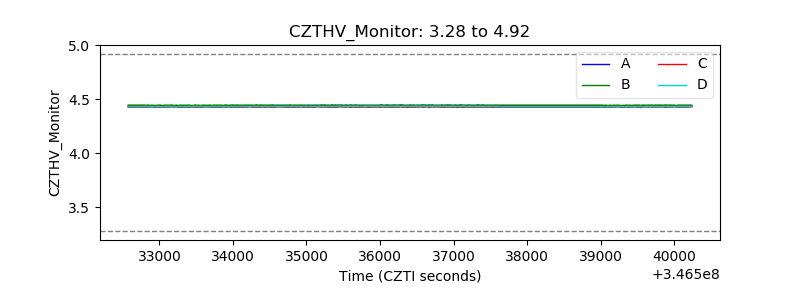 |
| D_VDD | 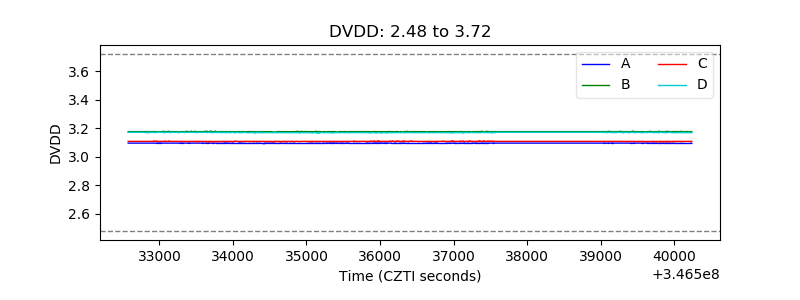 |
| Temperature 1 | 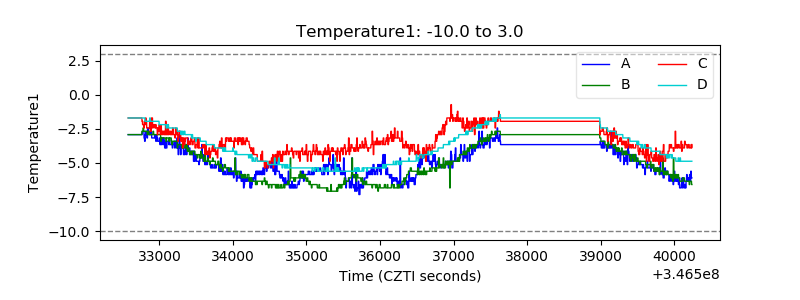 |
| Veto HV Monitor | 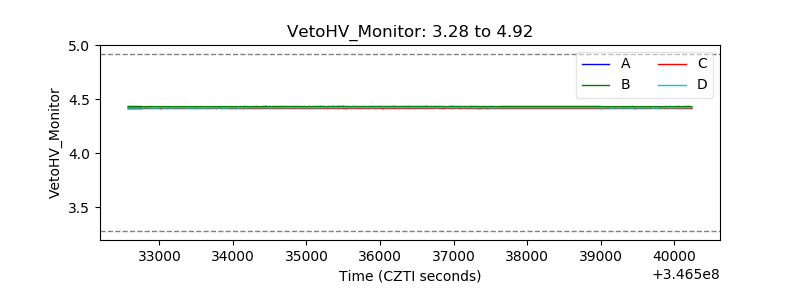 |
| Veto LLD | 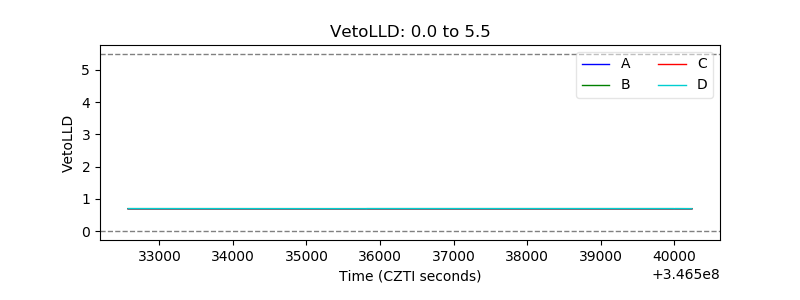 |
| Alpha Counter | 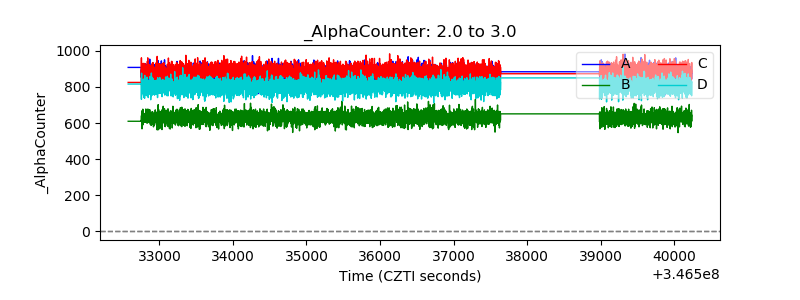 |
| _CPM_Rate | 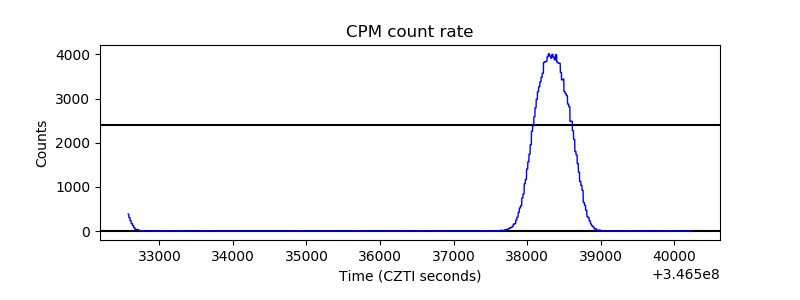 |
| CZT Counter | 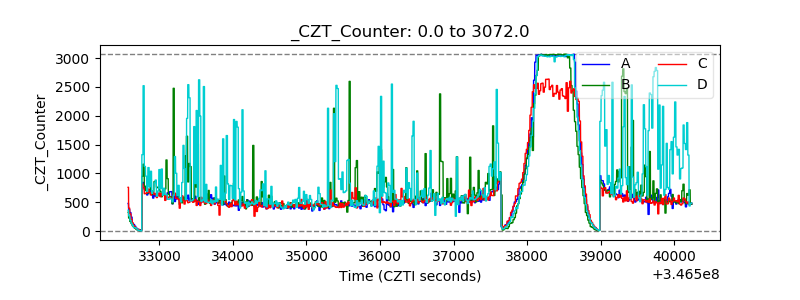 |
| +2.5 Volts monitor |  |
| +5 Volts monitor |  |
| _ROLL_ROT | 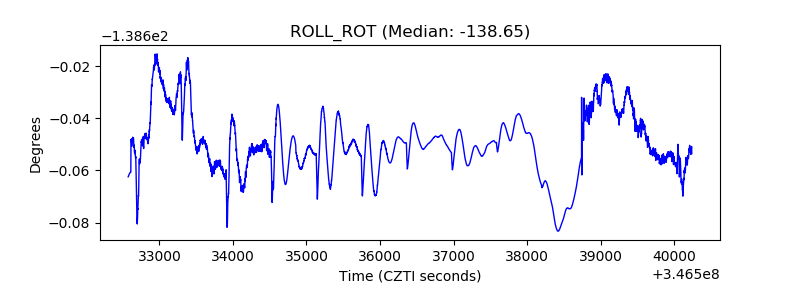 |
| _Roll_DEC | 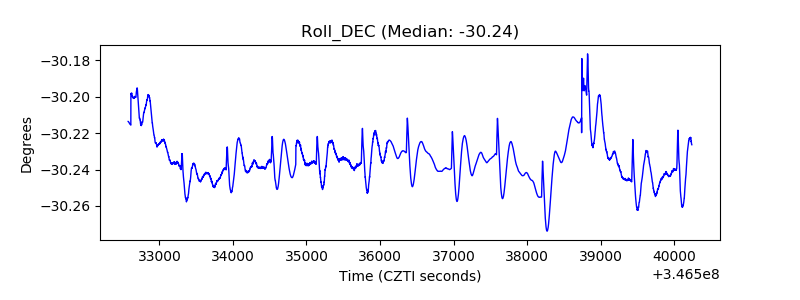 |
| _Roll_RA | 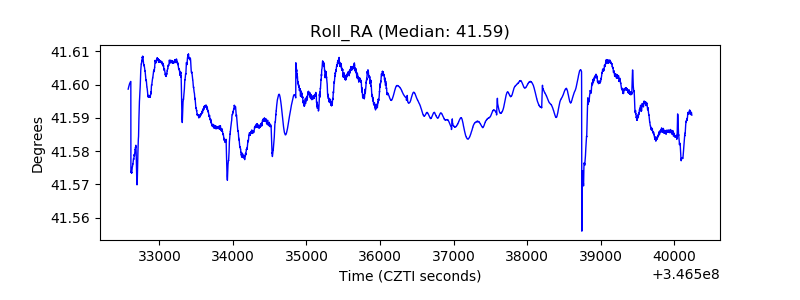 |
| Veto Counter | 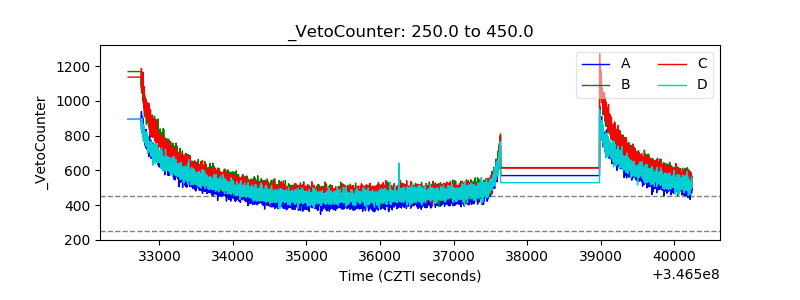 |