| Param | Original file | Final file |
|---|---|---|
| Filename | modeM0/AS1A10_116T01_9000004082_28342cztM0_level2.evt | modeM0/AS1A10_116T01_9000004082_28342cztM0_level2_quad_clean.evt |
| Size (bytes) | 537,503,040 | 94,944,960 |
| Size | 512.6 MB | 90.5 MB |
| Events in quadrant A | 3,226,061 | 630,676 |
| Events in quadrant B | 3,581,821 | 646,294 |
| Events in quadrant C | 3,236,798 | 618,341 |
| Events in quadrant D | 5,820,050 | 553,775 |
| Mode M9 | |||
|---|---|---|---|
| Quadrant | BADHDUFLAG | Total packets | Discarded packets |
| A | 0 | 19 | 0 |
| B | 0 | 20 | 0 |
| C | 0 | 20 | 0 |
| D | 0 | 20 | 0 |
| Mode M0 | |||
|---|---|---|---|
| Quadrant | BADHDUFLAG | Total packets | Discarded packets |
| A | 0 | 13231 | 0 |
| B | 0 | 14352 | 0 |
| C | 0 | 13164 | 0 |
| D | 0 | 21436 | 0 |
| Quadrant | Total seconds | Saturated seconds | Saturation percentage |
|---|---|---|---|
| A | 6101 | 50 | 0.819538% |
| B | 6101 | 163 | 2.671693% |
| C | 6101 | 71 | 1.163744% |
| D | 6101 | 705 | 11.555483% |
Noise dominated data is calculated using 1-second bins in cleaned event files. If a bin has >2000 counts, and if more than 50% of those come from <1% of pixels, then it is considered to be noise-dominated and hence unusable.
| Quadrant | # 1 sec bins | Bins with >0 counts | Bins with >2000 counts | High rate bins dominated by noise | Noise dominated (total time) | Noise dominated (detector-on time) | Marked lightcurve |
|---|---|---|---|---|---|---|---|
| A | 7456 | 6102 | 0 | 0 | 0.00% | 0.00% | 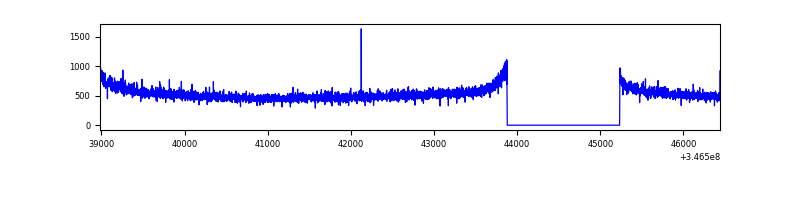 |
| B | 7456 | 6102 | 78 | 78 | 1.05% | 1.28% | 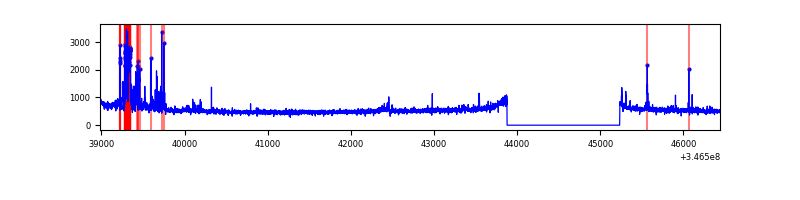 |
| C | 7456 | 6102 | 0 | 0 | 0.00% | 0.00% | 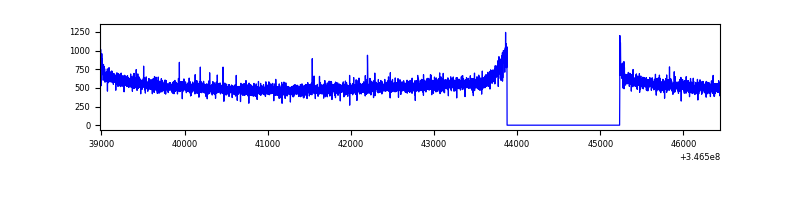 |
| D | 7456 | 6102 | 591 | 591 | 7.93% | 9.69% | 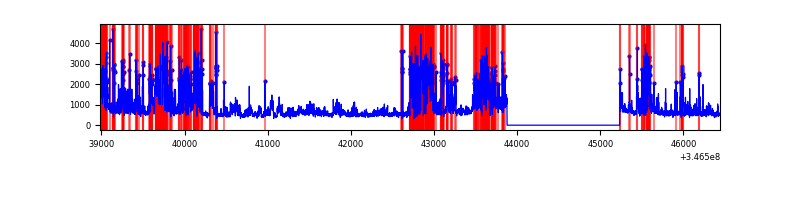 |
Top three noisy pixels from each quadrant. If the there are fewer than three noisy pixels in the level2.evt file, extra rows are filled as -1
| Pixel properties | Quadrant properties | ||||||
|---|---|---|---|---|---|---|---|
| Quadrant | DetID | PixID | Counts | Sigma | Mean | Median | Sigma |
| A | 15 | 190 | 65947 | 401.6 | 818 | 804 | 162.2 |
| A | 13 | 254 | 10732 | 61.21 | 818 | 804 | 162.2 |
| A | 3 | 137 | 7537 | 41.51 | 818 | 804 | 162.2 |
| B | 10 | 245 | 328595 | 2171.64 | 816 | 798 | 150.9 |
| B | 10 | 246 | 25383 | 162.87 | 816 | 798 | 150.9 |
| B | 12 | 111 | 18339 | 116.21 | 816 | 798 | 150.9 |
| C | 14 | 238 | 131268 | 707.82 | 794 | 801 | 184.3 |
| C | 3 | 233 | 6391 | 30.32 | 794 | 801 | 184.3 |
| C | 13 | 61 | 5425 | 25.08 | 794 | 801 | 184.3 |
| D | 1 | 52 | 2614091 | 14720.59 | 748 | 730 | 177.5 |
| D | 8 | 195 | 199269 | 1118.33 | 748 | 730 | 177.5 |
| D | 7 | 238 | 88170 | 492.53 | 748 | 730 | 177.5 |
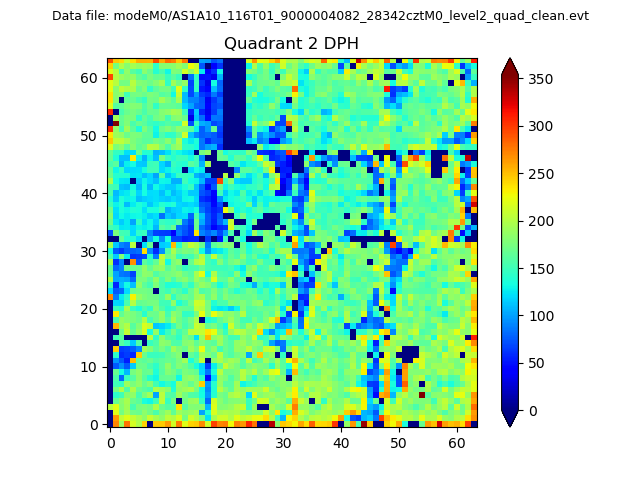
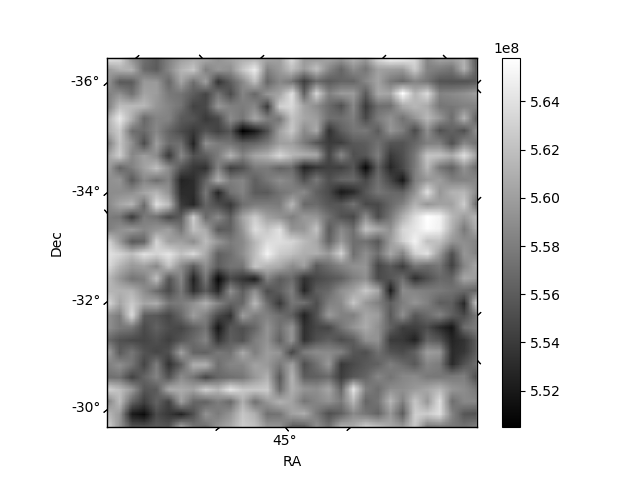
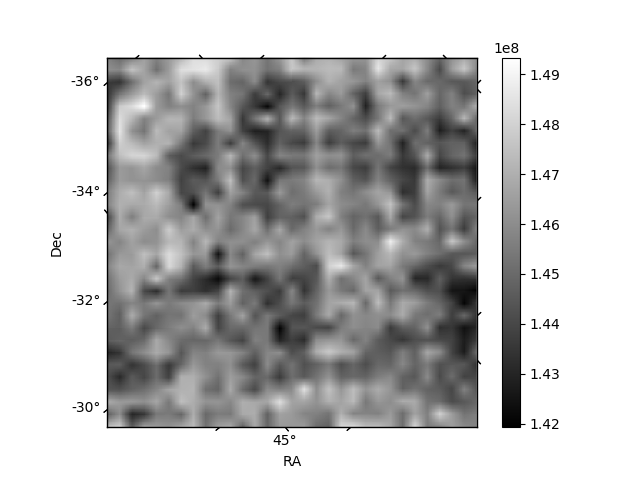
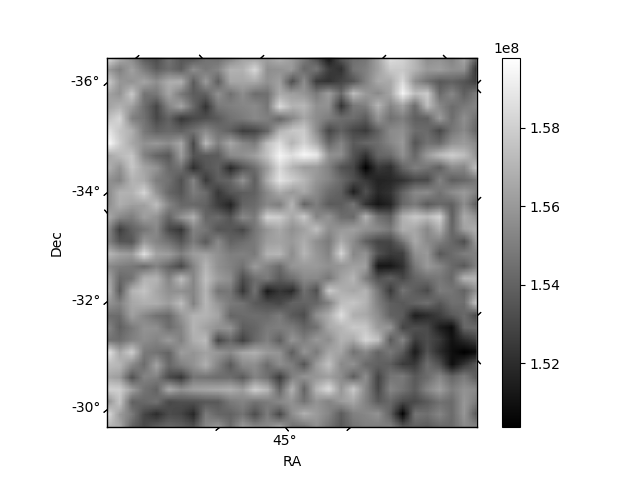
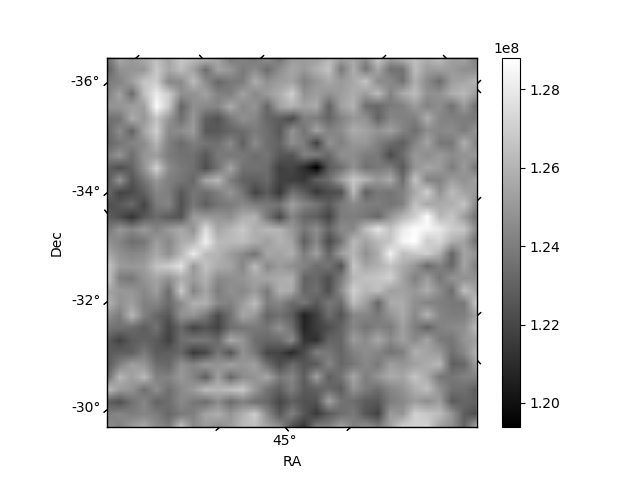
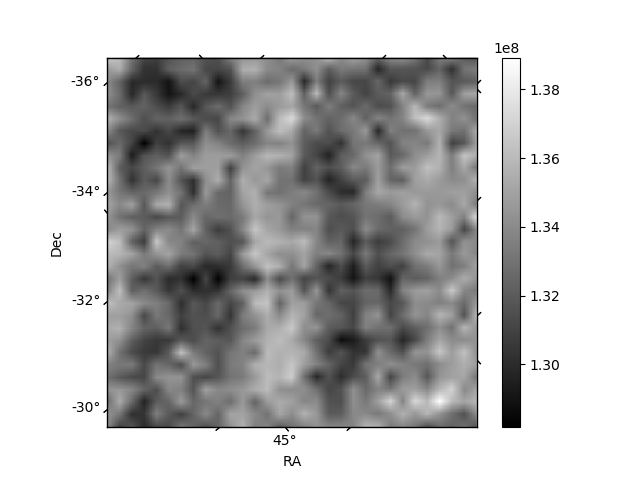
Histogram calculated using DETX and DETY for each event in the final _common_clean file
| Quadrant A | 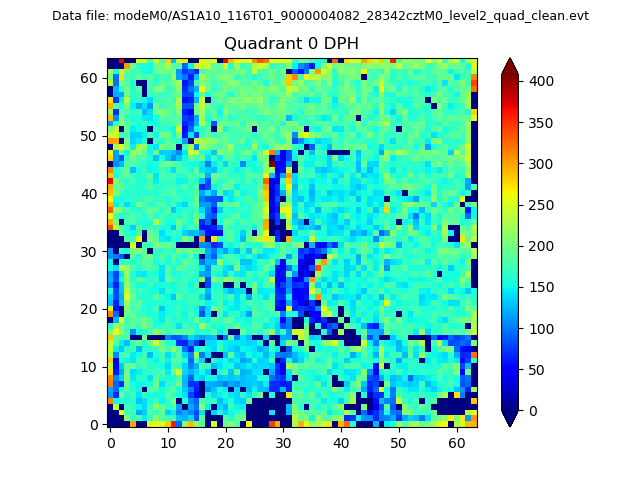 |
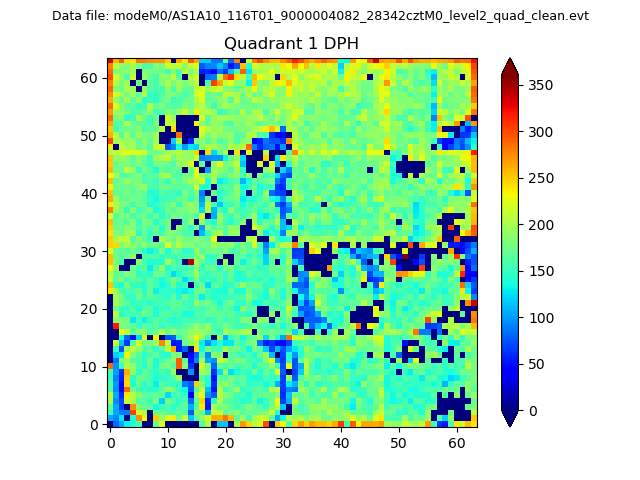 |
Quadrant B |
|---|---|---|---|
| Quadrant D | 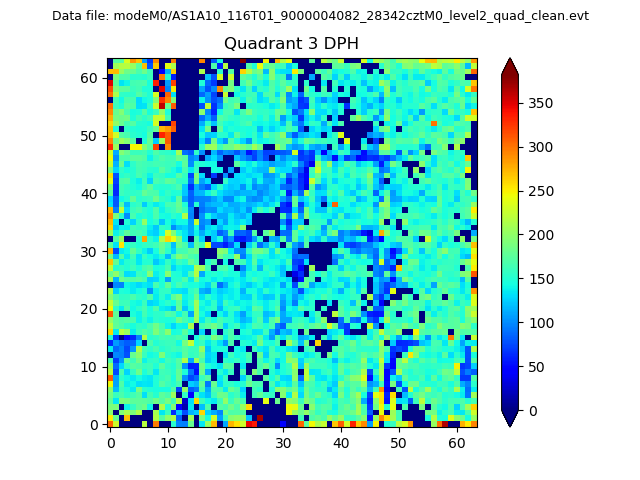 |
 |
Quadrant C |
| Plot type | Count rate plots | Images |
|---|---|---|
| Comparison with Poisson distribution Blue bars denote a histogram of data divided into 1 sec bins. Red curve is a Poisson curve with rate = median count rate of data. |
 |
 |
| Quadrant-wise count rates Data is divided into 100 sec bins |
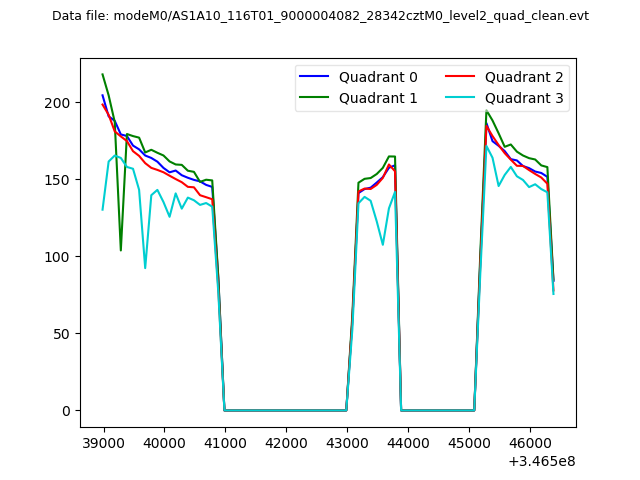 |
|
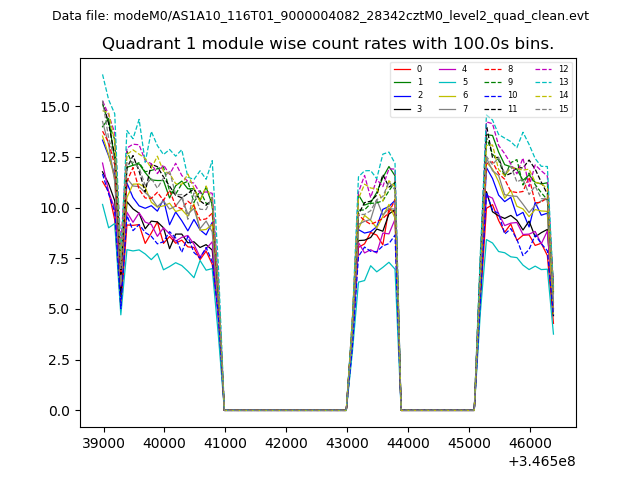
| Module-wise count rates for Quadrant A Data is divided into 100 sec bins |
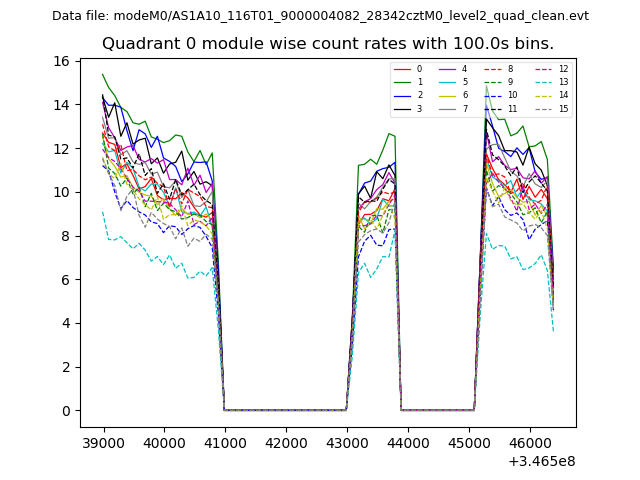 |
 |
| Module-wise count rates for Quadrant B Data is divided into 100 sec bins |
 |
 |
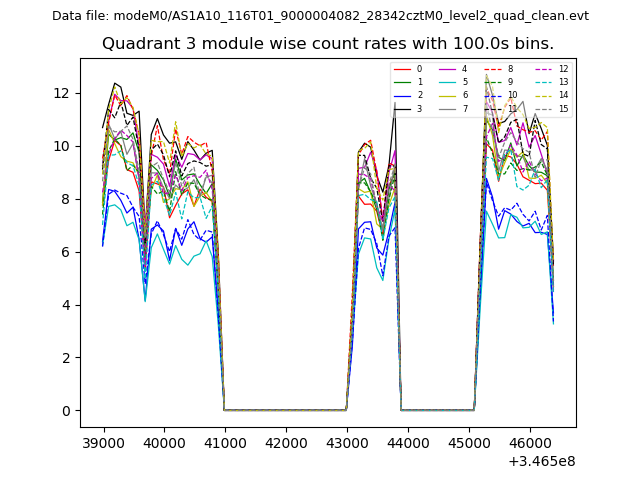
| Module-wise count rates for Quadrant C Data is divided into 100 sec bins |
 |
 |
| Module-wise count rates for Quadrant D Data is divided into 100 sec bins |
 |
 |
| Parameter | Plot |
|---|---|
| CZT HV Monitor | 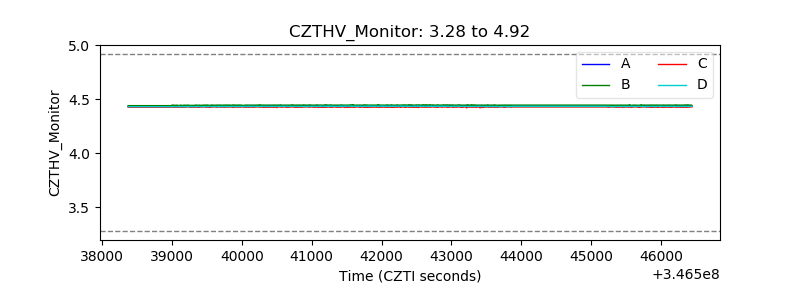 |
| D_VDD | 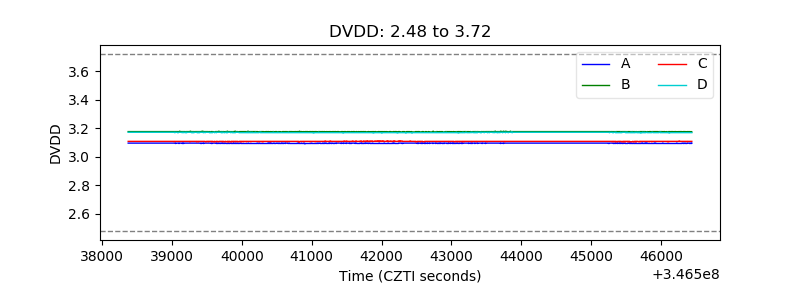 |
| Temperature 1 | 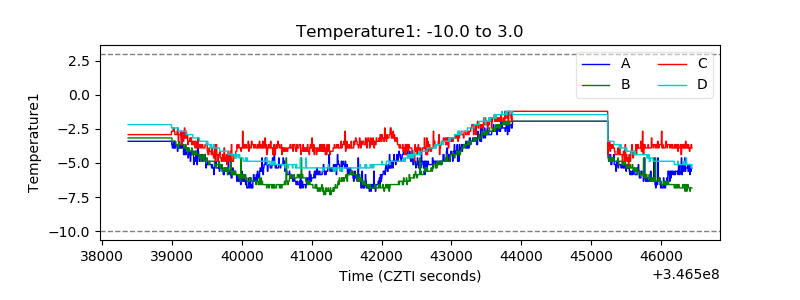 |
| Veto HV Monitor | 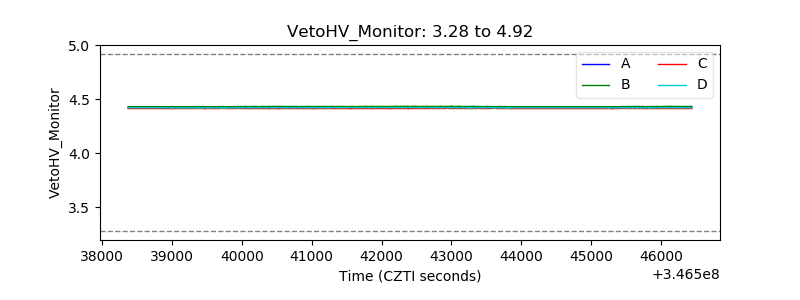 |
| Veto LLD | 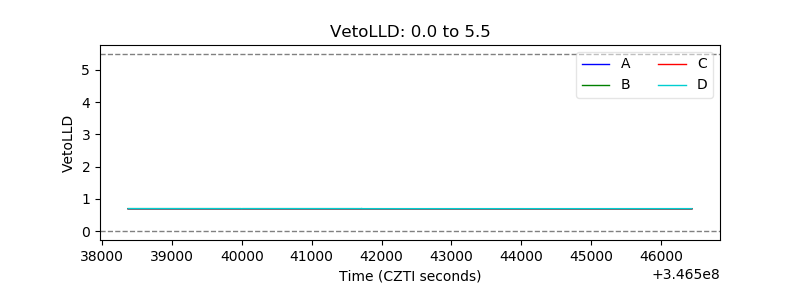 |
| Alpha Counter | 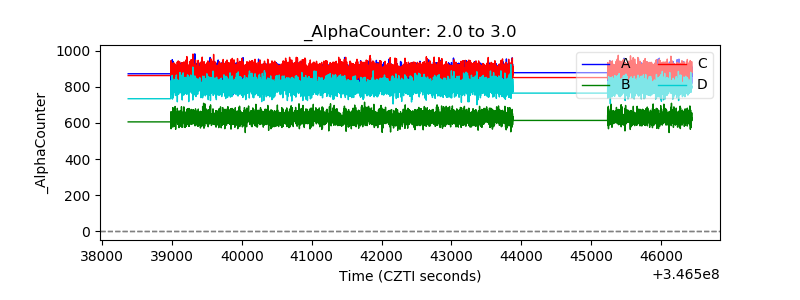 |
| _CPM_Rate | 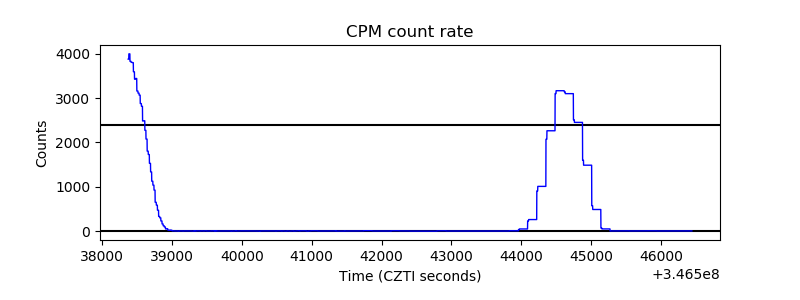 |
| CZT Counter | 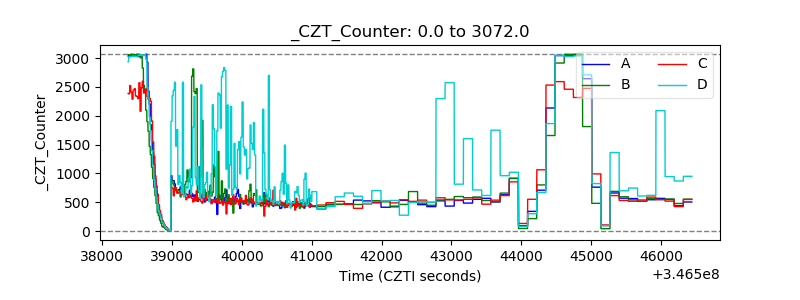 |
| +2.5 Volts monitor |  |
| +5 Volts monitor | 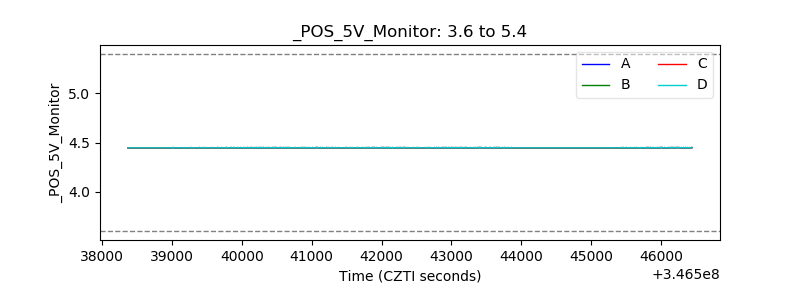 |
| _ROLL_ROT | 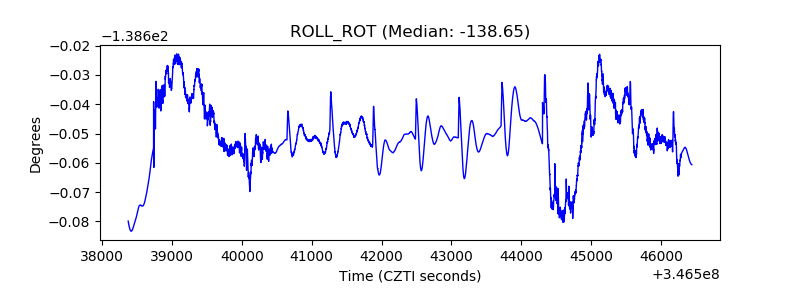 |
| _Roll_DEC | 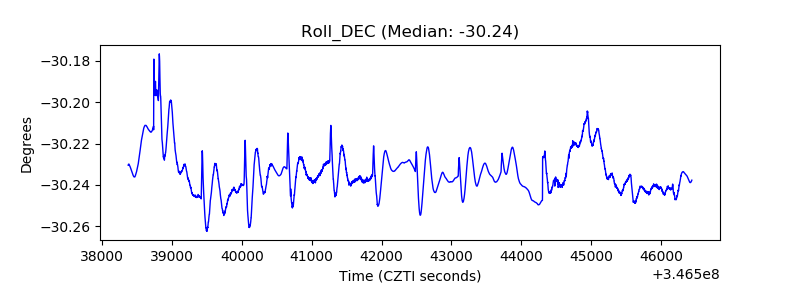 |
| _Roll_RA | 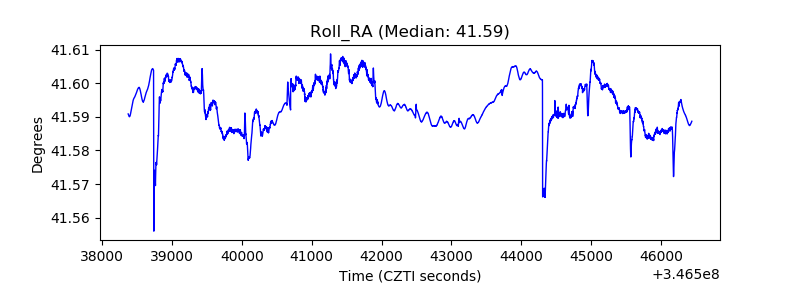 |
| Veto Counter | 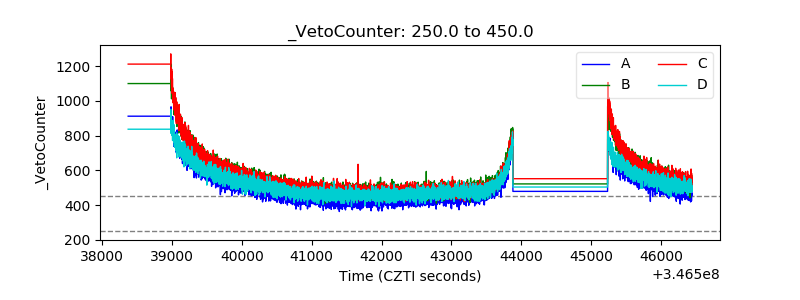 |