| Param | Original file | Final file |
|---|---|---|
| Filename | modeM0/AS1A10_116T01_9000004082_28344cztM0_level2.evt | modeM0/AS1A10_116T01_9000004082_28344cztM0_level2_quad_clean.evt |
| Size (bytes) | 514,517,760 | 84,841,920 |
| Size | 490.7 MB | 80.9 MB |
| Events in quadrant A | 3,332,047 | 533,751 |
| Events in quadrant B | 3,330,551 | 550,315 |
| Events in quadrant C | 3,292,373 | 524,218 |
| Events in quadrant D | 5,177,561 | 498,623 |
| Mode M9 | |||
|---|---|---|---|
| Quadrant | BADHDUFLAG | Total packets | Discarded packets |
| A | 0 | 15 | 0 |
| B | 0 | 16 | 0 |
| C | 0 | 16 | 0 |
| D | 0 | 16 | 0 |
| Mode M0 | |||
|---|---|---|---|
| Quadrant | BADHDUFLAG | Total packets | Discarded packets |
| A | 0 | 13958 | 0 |
| B | 0 | 13805 | 0 |
| C | 0 | 13613 | 0 |
| D | 0 | 19776 | 0 |
| Quadrant | Total seconds | Saturated seconds | Saturation percentage |
|---|---|---|---|
| A | 6634 | 28 | 0.422068% |
| B | 6634 | 39 | 0.587881% |
| C | 6634 | 68 | 1.025023% |
| D | 6633 | 179 | 2.698628% |
Noise dominated data is calculated using 1-second bins in cleaned event files. If a bin has >2000 counts, and if more than 50% of those come from <1% of pixels, then it is considered to be noise-dominated and hence unusable.
| Quadrant | # 1 sec bins | Bins with >0 counts | Bins with >2000 counts | High rate bins dominated by noise | Noise dominated (total time) | Noise dominated (detector-on time) | Marked lightcurve |
|---|---|---|---|---|---|---|---|
| A | 7704 | 6635 | 5 | 5 | 0.06% | 0.08% | 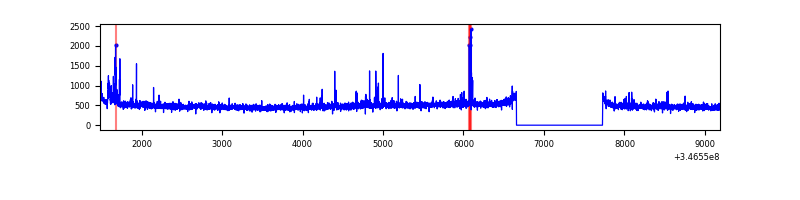 |
| B | 7704 | 6635 | 4 | 4 | 0.05% | 0.06% | 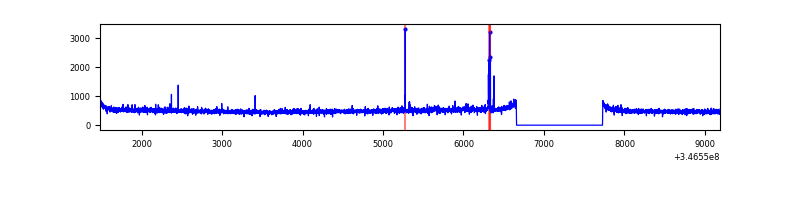 |
| C | 7704 | 6635 | 0 | 0 | 0.00% | 0.00% | 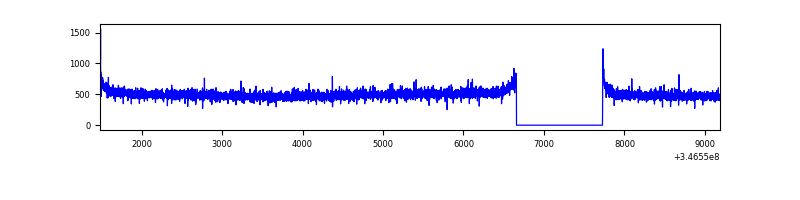 |
| D | 7703 | 6634 | 151 | 151 | 1.96% | 2.28% | 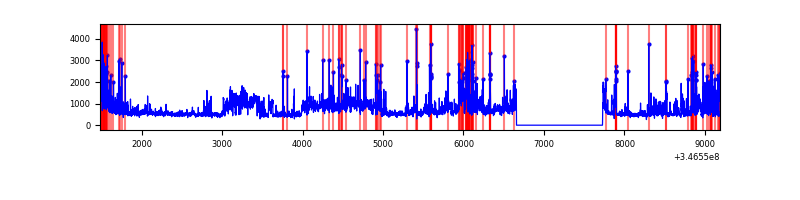 |
Top three noisy pixels from each quadrant. If the there are fewer than three noisy pixels in the level2.evt file, extra rows are filled as -1
| Pixel properties | Quadrant properties | ||||||
|---|---|---|---|---|---|---|---|
| Quadrant | DetID | PixID | Counts | Sigma | Mean | Median | Sigma |
| A | 15 | 174 | 93554 | 560.41 | 831 | 814 | 165.5 |
| A | 12 | 96 | 32586 | 191.99 | 831 | 814 | 165.5 |
| A | 13 | 254 | 11510 | 64.63 | 831 | 814 | 165.5 |
| B | 0 | 230 | 34348 | 213.27 | 834 | 813 | 157.2 |
| B | 12 | 111 | 19582 | 119.37 | 834 | 813 | 157.2 |
| B | 11 | 111 | 17559 | 106.5 | 834 | 813 | 157.2 |
| C | 14 | 238 | 131484 | 692.72 | 809 | 815 | 188.6 |
| C | 0 | 10 | 7791 | 36.98 | 809 | 815 | 188.6 |
| C | 13 | 61 | 5665 | 25.71 | 809 | 815 | 188.6 |
| D | 1 | 52 | 1441420 | 7566.92 | 798 | 779 | 190.4 |
| D | 8 | 195 | 591464 | 3102.55 | 798 | 779 | 190.4 |
| D | 13 | 104 | 36573 | 188.01 | 798 | 779 | 190.4 |
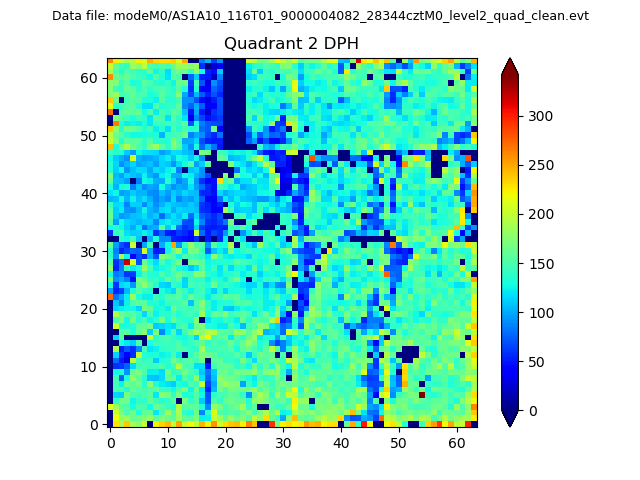
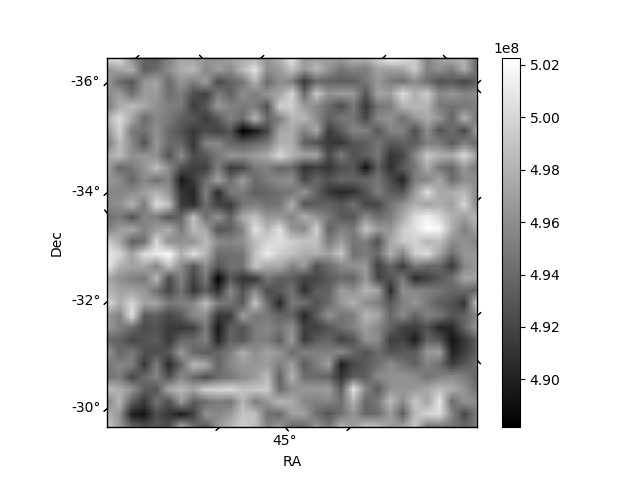
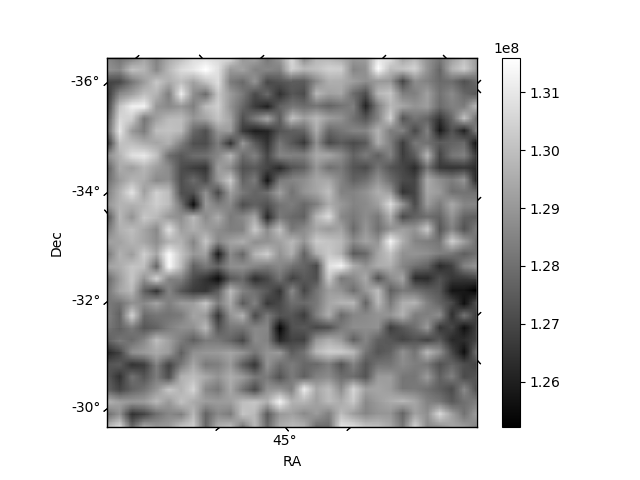
Histogram calculated using DETX and DETY for each event in the final _common_clean file
| Quadrant A | 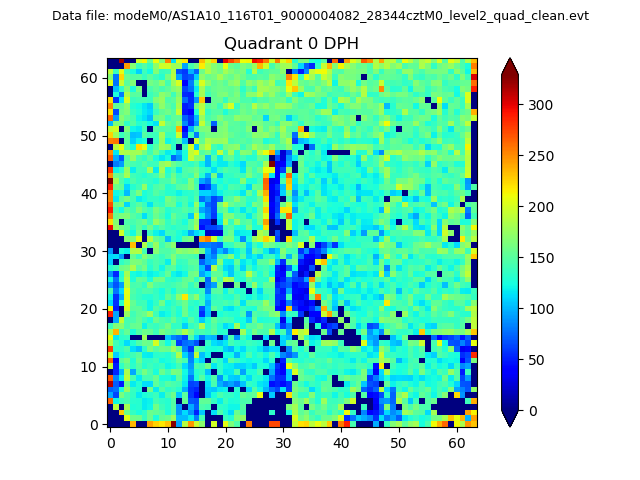 |
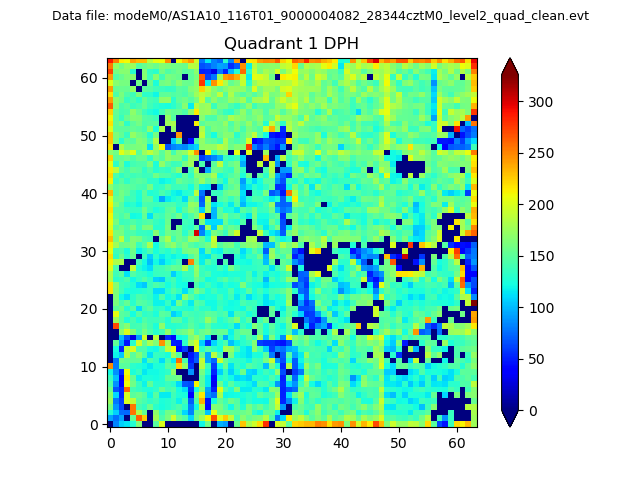 |
Quadrant B |
|---|---|---|---|
| Quadrant D | 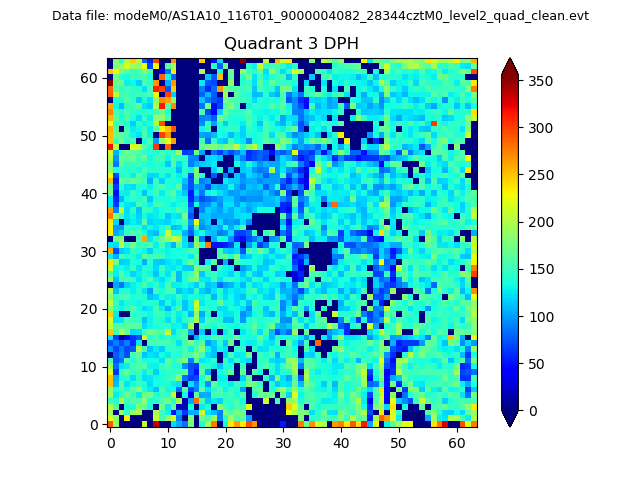 |
 |
Quadrant C |
| Plot type | Count rate plots | Images |
|---|---|---|
| Comparison with Poisson distribution Blue bars denote a histogram of data divided into 1 sec bins. Red curve is a Poisson curve with rate = median count rate of data. |
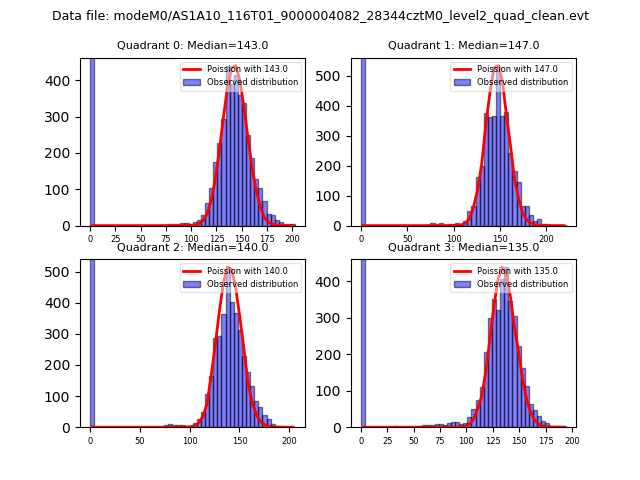 |
 |
| Quadrant-wise count rates Data is divided into 100 sec bins |
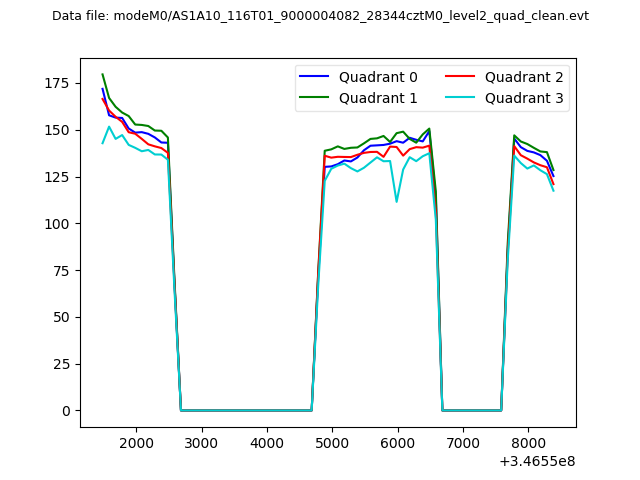 |
|
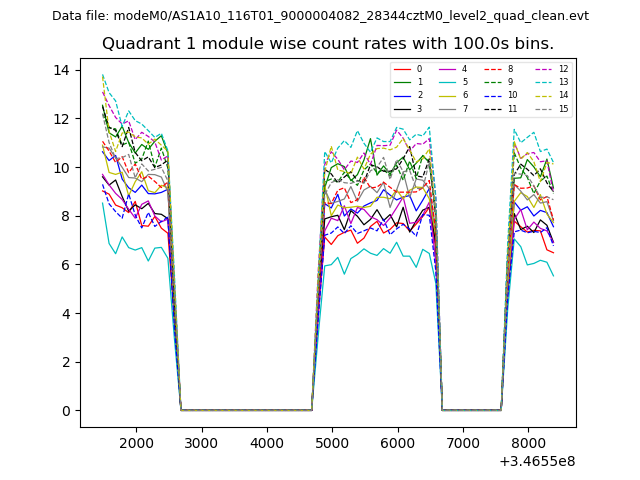
| Module-wise count rates for Quadrant A Data is divided into 100 sec bins |
 |
 |
| Module-wise count rates for Quadrant B Data is divided into 100 sec bins |
 |
 |
| Module-wise count rates for Quadrant C Data is divided into 100 sec bins |
 |
 |
| Module-wise count rates for Quadrant D Data is divided into 100 sec bins |
 |
 |
| Parameter | Plot |
|---|---|
| CZT HV Monitor |  |
| D_VDD | 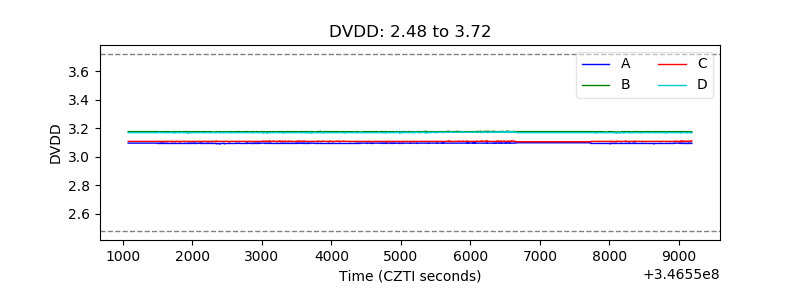 |
| Temperature 1 | 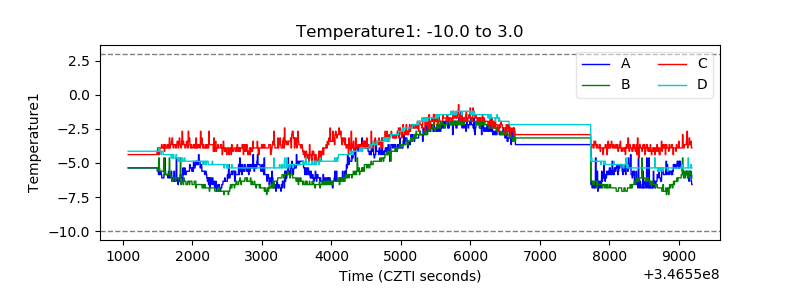 |
| Veto HV Monitor |  |
| Veto LLD | 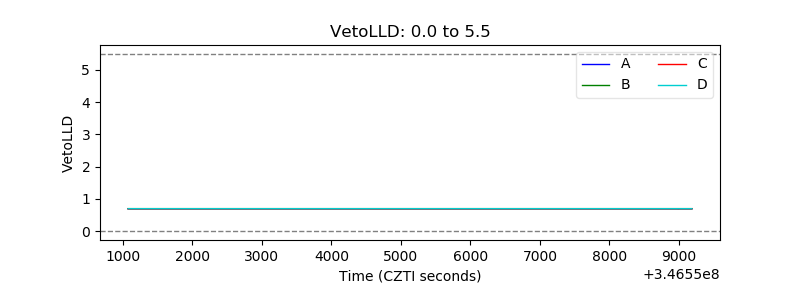 |
| Alpha Counter | 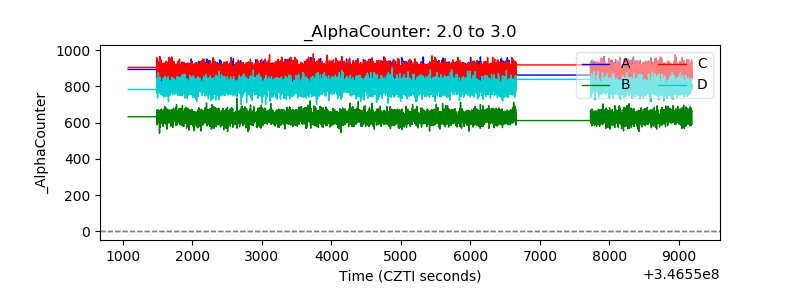 |
| _CPM_Rate | 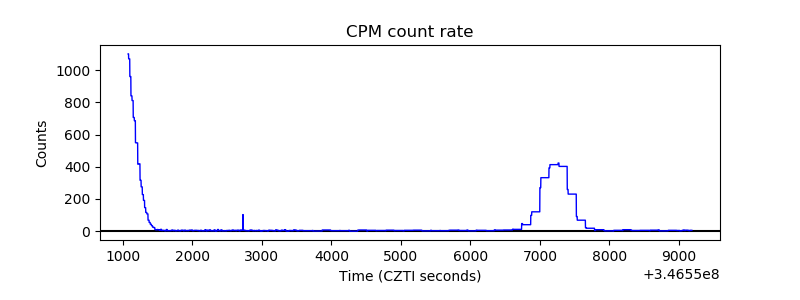 |
| CZT Counter | 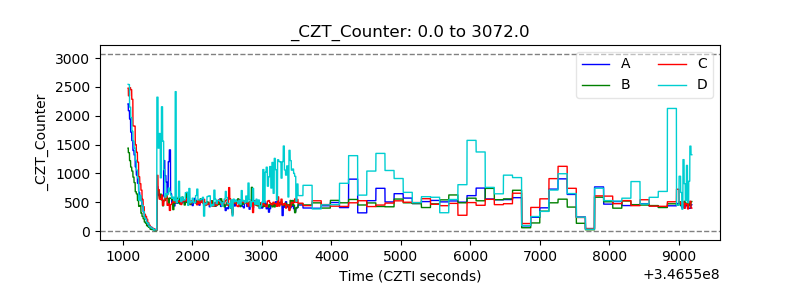 |
| +2.5 Volts monitor | 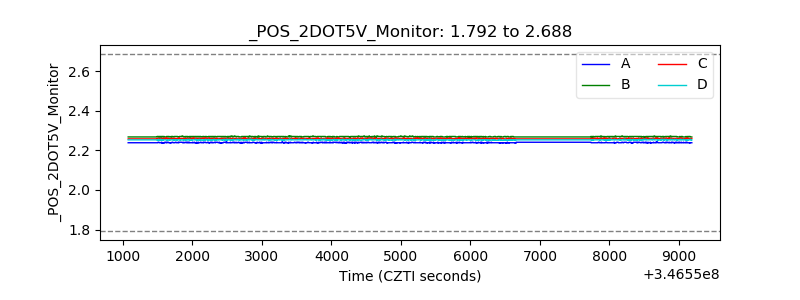 |
| +5 Volts monitor |  |
| _ROLL_ROT |  |
| _Roll_DEC |  |
| _Roll_RA | 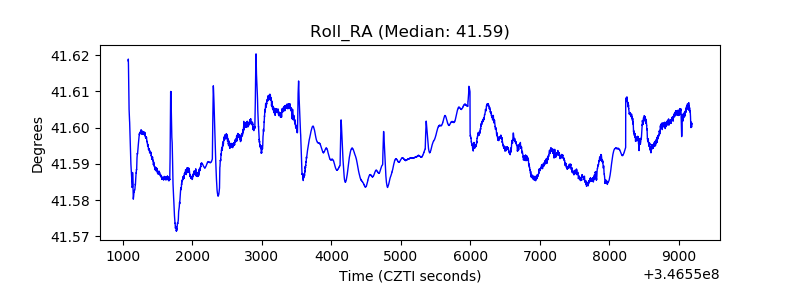 |
| Veto Counter | 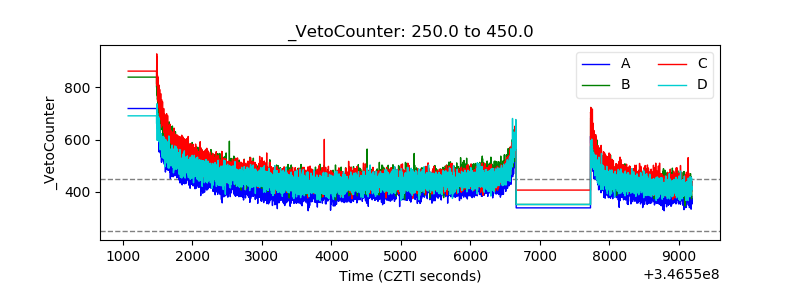 |