| Param | Original file | Final file |
|---|---|---|
| Filename | modeM0/AS1A10_116T01_9000004082_28345cztM0_level2.evt | modeM0/AS1A10_116T01_9000004082_28345cztM0_level2_quad_clean.evt |
| Size (bytes) | 563,538,240 | 81,797,760 |
| Size | 537.4 MB | 78.0 MB |
| Events in quadrant A | 3,501,758 | 510,175 |
| Events in quadrant B | 3,419,928 | 522,544 |
| Events in quadrant C | 3,407,254 | 497,143 |
| Events in quadrant D | 6,263,340 | 459,284 |
| Mode M9 | |||
|---|---|---|---|
| Quadrant | BADHDUFLAG | Total packets | Discarded packets |
| A | 0 | 14 | 0 |
| B | 0 | 15 | 0 |
| C | 0 | 15 | 0 |
| D | 0 | 15 | 0 |
| Mode M0 | |||
|---|---|---|---|
| Quadrant | BADHDUFLAG | Total packets | Discarded packets |
| A | 0 | 14891 | 0 |
| B | 0 | 14496 | 0 |
| C | 0 | 14435 | 0 |
| D | 0 | 23280 | 0 |
| Quadrant | Total seconds | Saturated seconds | Saturation percentage |
|---|---|---|---|
| A | 7008 | 66 | 0.941781% |
| B | 7008 | 53 | 0.756279% |
| C | 7008 | 90 | 1.284247% |
| D | 7008 | 560 | 7.990868% |
Noise dominated data is calculated using 1-second bins in cleaned event files. If a bin has >2000 counts, and if more than 50% of those come from <1% of pixels, then it is considered to be noise-dominated and hence unusable.
| Quadrant | # 1 sec bins | Bins with >0 counts | Bins with >2000 counts | High rate bins dominated by noise | Noise dominated (total time) | Noise dominated (detector-on time) | Marked lightcurve |
|---|---|---|---|---|---|---|---|
| A | 7628 | 7009 | 10 | 10 | 0.13% | 0.14% | 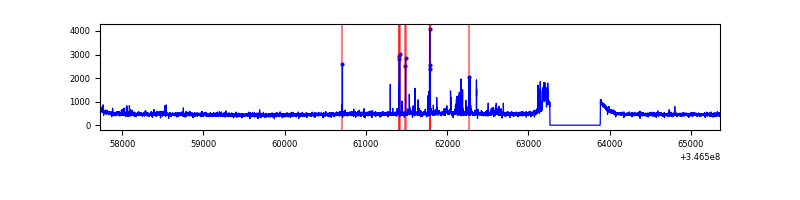 |
| B | 7628 | 7009 | 0 | 0 | 0.00% | 0.00% | 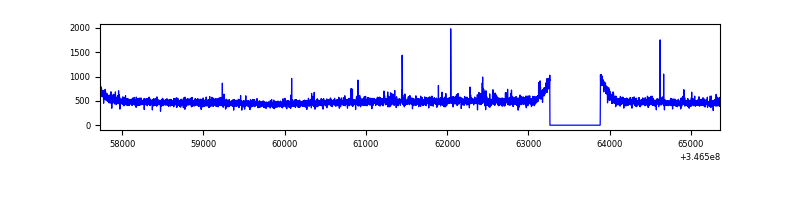 |
| C | 7628 | 7009 | 6 | 6 | 0.08% | 0.09% | 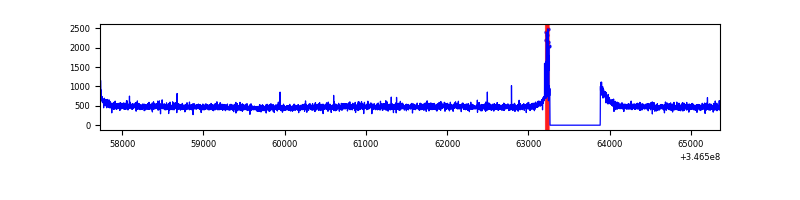 |
| D | 7628 | 7009 | 518 | 518 | 6.79% | 7.39% | 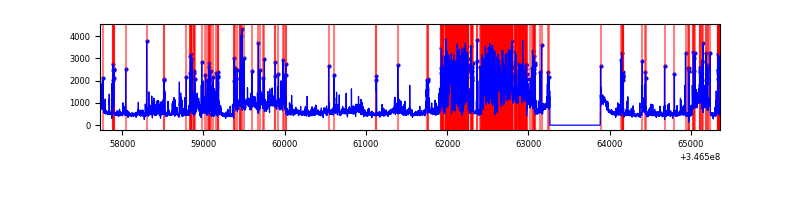 |
Top three noisy pixels from each quadrant. If the there are fewer than three noisy pixels in the level2.evt file, extra rows are filled as -1
| Pixel properties | Quadrant properties | ||||||
|---|---|---|---|---|---|---|---|
| Quadrant | DetID | PixID | Counts | Sigma | Mean | Median | Sigma |
| A | 12 | 96 | 98131 | 564.14 | 858 | 841 | 172.5 |
| A | 15 | 174 | 92684 | 532.55 | 858 | 841 | 172.5 |
| A | 13 | 254 | 11519 | 61.92 | 858 | 841 | 172.5 |
| B | 12 | 111 | 20586 | 118.92 | 861 | 840 | 166.0 |
| B | 11 | 111 | 18684 | 107.46 | 861 | 840 | 166.0 |
| B | 14 | 111 | 17694 | 101.5 | 861 | 840 | 166.0 |
| C | 14 | 238 | 132496 | 672.28 | 832 | 835 | 195.8 |
| C | 10 | 22 | 27967 | 138.54 | 832 | 835 | 195.8 |
| C | 13 | 61 | 5531 | 23.98 | 832 | 835 | 195.8 |
| D | 1 | 52 | 2012224 | 10227.12 | 813 | 791 | 196.7 |
| D | 8 | 195 | 888165 | 4511.85 | 813 | 791 | 196.7 |
| D | 7 | 238 | 152160 | 769.64 | 813 | 791 | 196.7 |
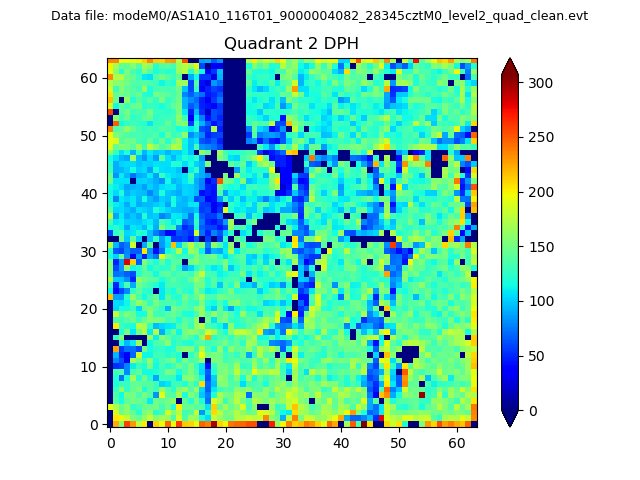
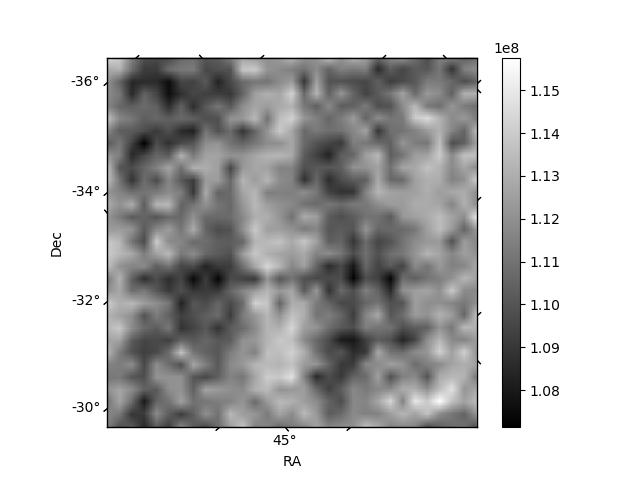
Histogram calculated using DETX and DETY for each event in the final _common_clean file
| Quadrant A | 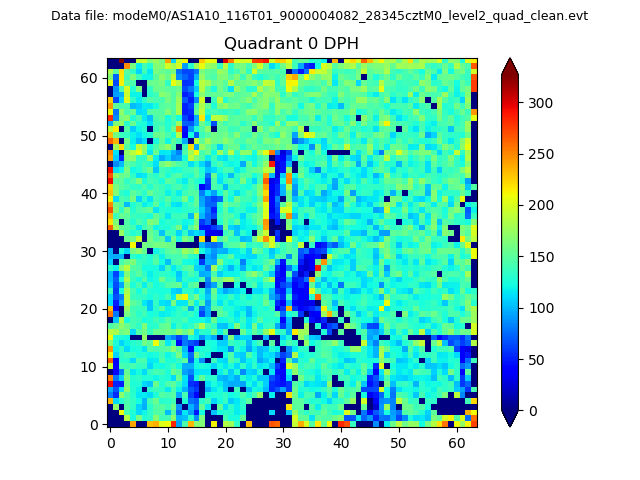 |
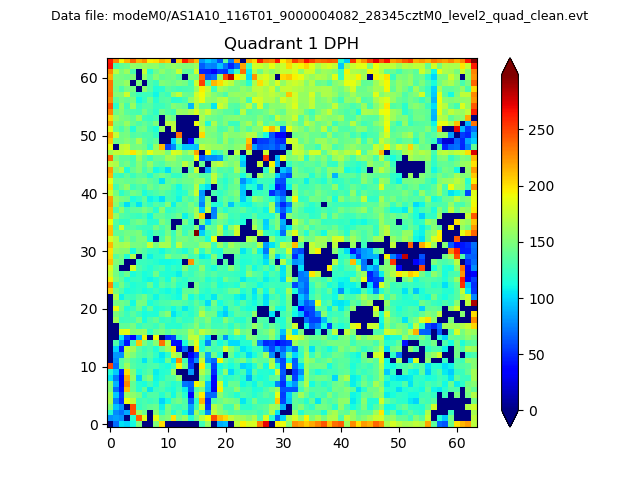 |
Quadrant B |
|---|---|---|---|
| Quadrant D | 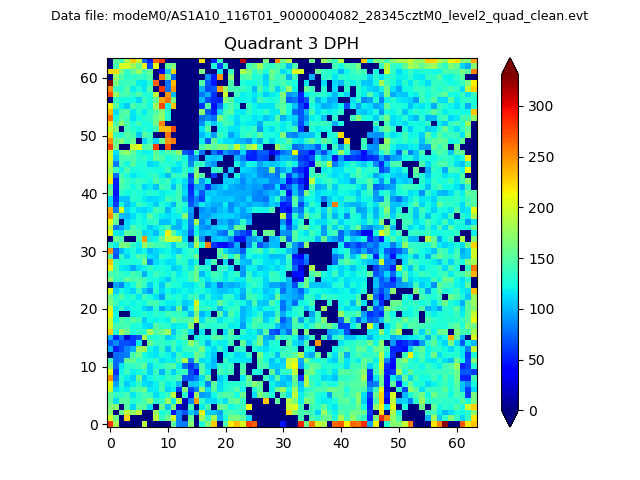 |
 |
Quadrant C |
| Plot type | Count rate plots | Images |
|---|---|---|
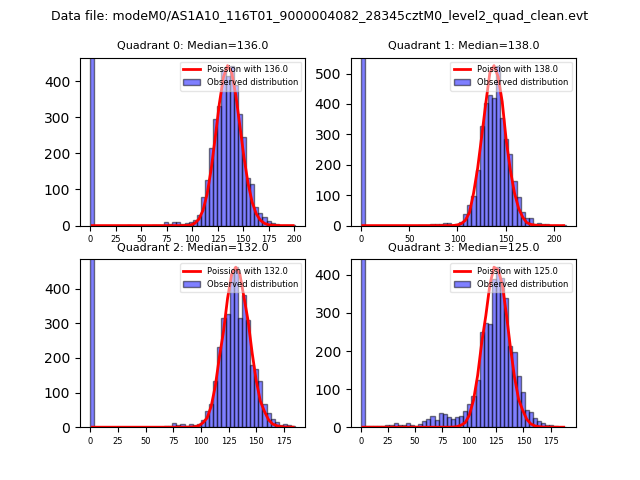
| Comparison with Poisson distribution Blue bars denote a histogram of data divided into 1 sec bins. Red curve is a Poisson curve with rate = median count rate of data. |
 |
 |
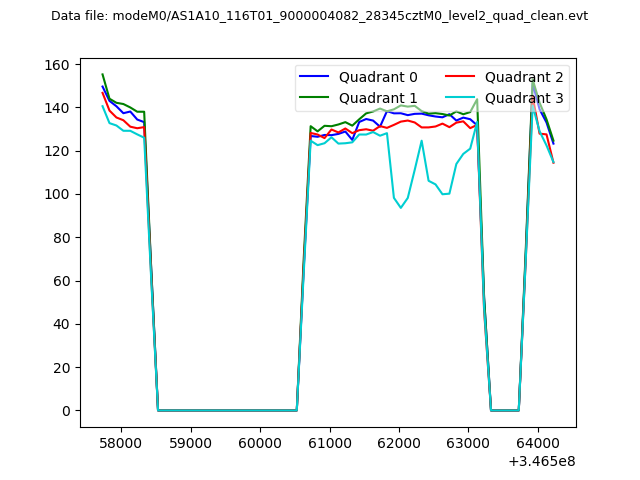
| Quadrant-wise count rates Data is divided into 100 sec bins |
 |
|
| Module-wise count rates for Quadrant A Data is divided into 100 sec bins |
 |
 |
| Module-wise count rates for Quadrant B Data is divided into 100 sec bins |
 |
 |
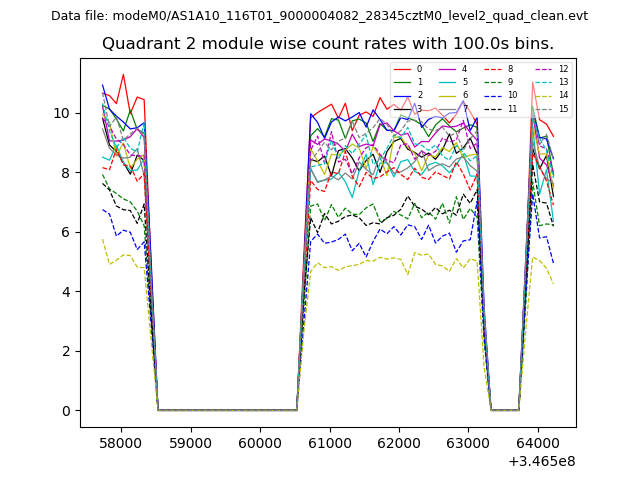
| Module-wise count rates for Quadrant C Data is divided into 100 sec bins |
 |
 |
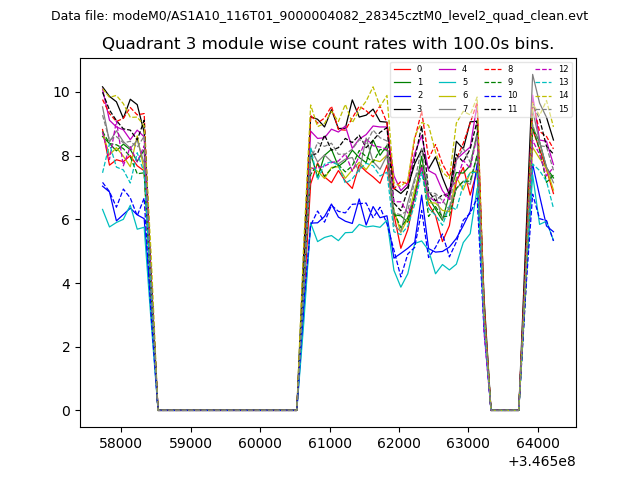
| Module-wise count rates for Quadrant D Data is divided into 100 sec bins |
 |
 |
| Parameter | Plot |
|---|---|
| CZT HV Monitor |  |
| D_VDD | 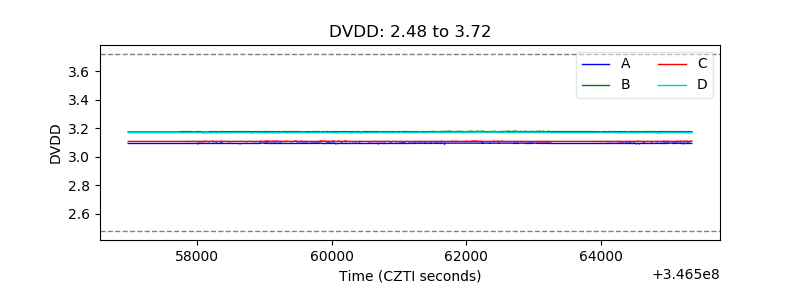 |
| Temperature 1 | 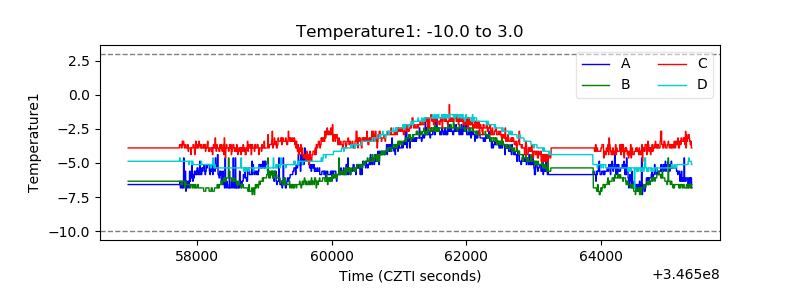 |
| Veto HV Monitor | 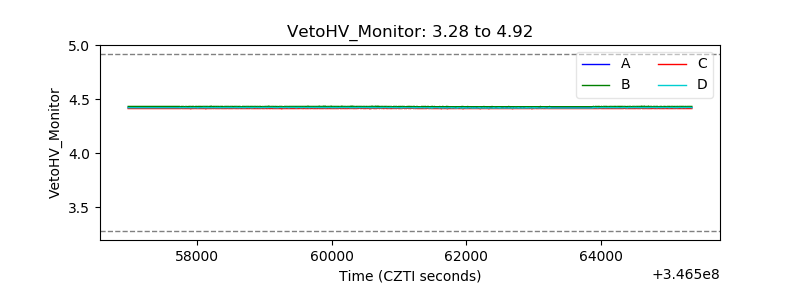 |
| Veto LLD | 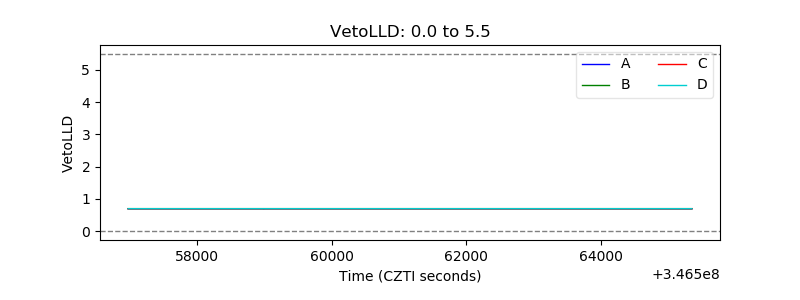 |
| Alpha Counter | 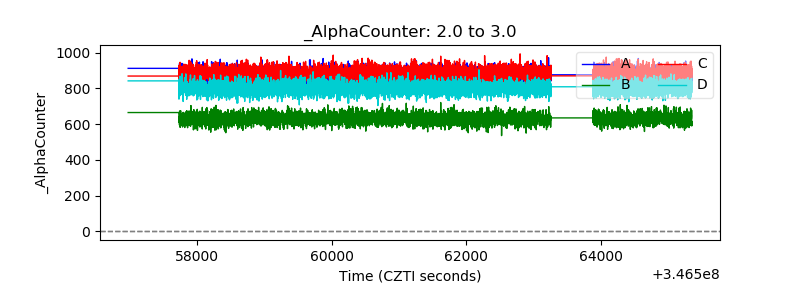 |
| _CPM_Rate | 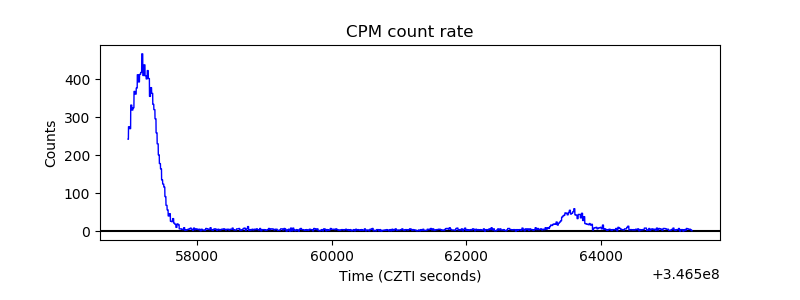 |
| CZT Counter | 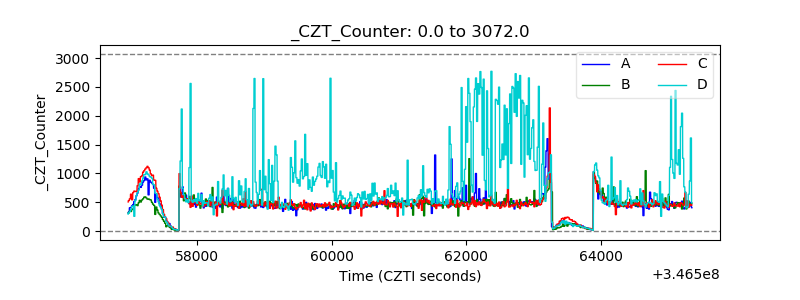 |
| +2.5 Volts monitor |  |
| +5 Volts monitor | 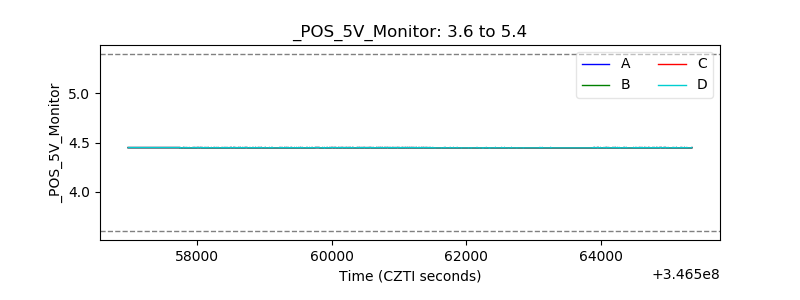 |
| _ROLL_ROT | 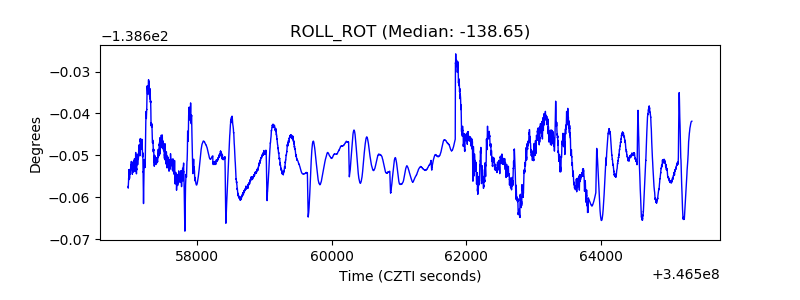 |
| _Roll_DEC | 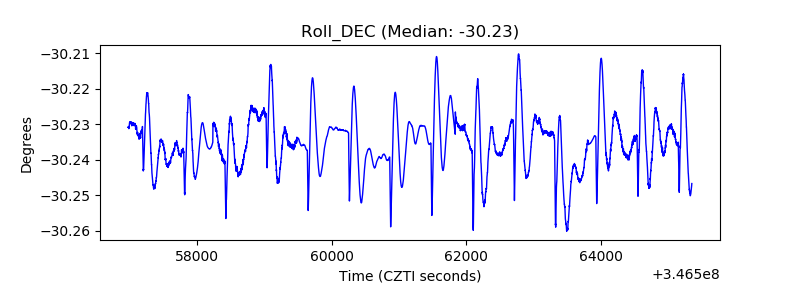 |
| _Roll_RA | 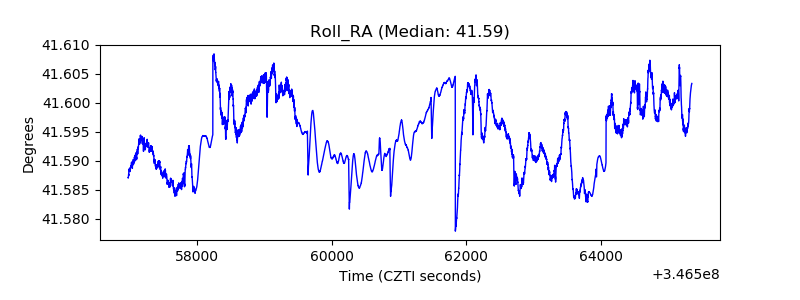 |
| Veto Counter | 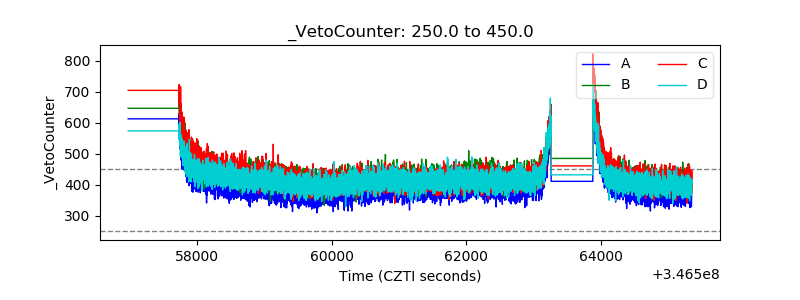 |