| Param | Original file | Final file |
|---|---|---|
| Filename | modeM0/AS1A10_116T01_9000004082_28347cztM0_level2.evt | modeM0/AS1A10_116T01_9000004082_28347cztM0_level2_quad_clean.evt |
| Size (bytes) | 686,413,440 | 96,143,040 |
| Size | 654.6 MB | 91.7 MB |
| Events in quadrant A | 4,440,172 | 591,681 |
| Events in quadrant B | 4,435,864 | 596,917 |
| Events in quadrant C | 4,443,741 | 569,310 |
| Events in quadrant D | 6,875,371 | 545,974 |
| Mode M0 | |||
|---|---|---|---|
| Quadrant | BADHDUFLAG | Total packets | Discarded packets |
| A | 0 | 18998 | 0 |
| B | 0 | 18751 | 0 |
| C | 0 | 18811 | 0 |
| D | 0 | 26069 | 0 |
| Quadrant | Total seconds | Saturated seconds | Saturation percentage |
|---|---|---|---|
| A | 8742 | 445 | 5.090368% |
| B | 8742 | 548 | 6.268588% |
| C | 8742 | 531 | 6.074125% |
| D | 8742 | 879 | 10.054907% |
Noise dominated data is calculated using 1-second bins in cleaned event files. If a bin has >2000 counts, and if more than 50% of those come from <1% of pixels, then it is considered to be noise-dominated and hence unusable.
| Quadrant | # 1 sec bins | Bins with >0 counts | Bins with >2000 counts | High rate bins dominated by noise | Noise dominated (total time) | Noise dominated (detector-on time) | Marked lightcurve |
|---|---|---|---|---|---|---|---|
| A | 8802 | 8745 | 4 | 4 | 0.05% | 0.05% | 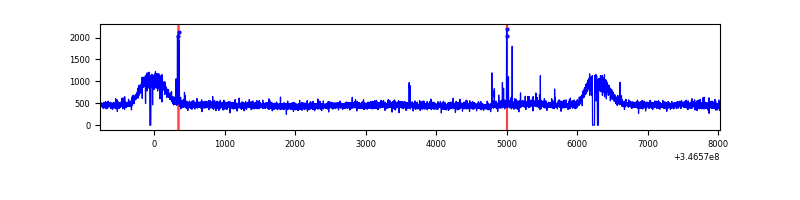 |
| B | 8802 | 8745 | 0 | 0 | 0.00% | 0.00% | 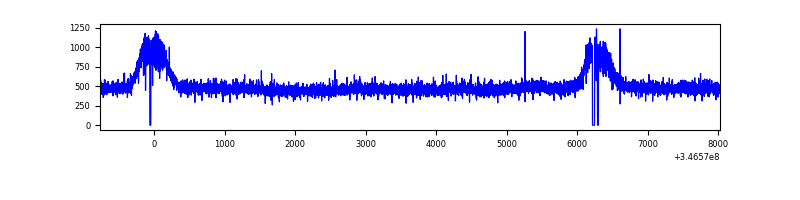 |
| C | 8802 | 8745 | 0 | 0 | 0.00% | 0.00% | 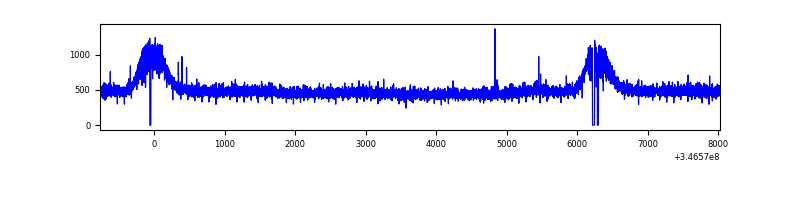 |
| D | 8802 | 8745 | 487 | 487 | 5.53% | 5.57% | 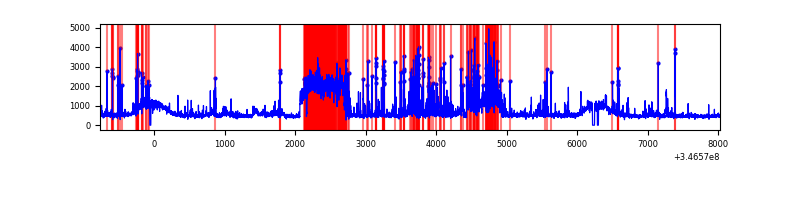 |
Top three noisy pixels from each quadrant. If the there are fewer than three noisy pixels in the level2.evt file, extra rows are filled as -1
| Pixel properties | Quadrant properties | ||||||
|---|---|---|---|---|---|---|---|
| Quadrant | DetID | PixID | Counts | Sigma | Mean | Median | Sigma |
| A | 12 | 96 | 31612 | 131.88 | 1135 | 1107 | 231.3 |
| A | 15 | 174 | 31274 | 130.42 | 1135 | 1107 | 231.3 |
| A | 13 | 254 | 13025 | 51.53 | 1135 | 1107 | 231.3 |
| B | 12 | 111 | 28968 | 124.66 | 1123 | 1090 | 223.6 |
| B | 11 | 111 | 25858 | 110.75 | 1123 | 1090 | 223.6 |
| B | 14 | 111 | 24775 | 105.91 | 1123 | 1090 | 223.6 |
| C | 14 | 238 | 166917 | 632.2 | 1091 | 1098 | 262.3 |
| C | 8 | 128 | 14110 | 49.61 | 1091 | 1098 | 262.3 |
| C | 13 | 61 | 7375 | 23.93 | 1091 | 1098 | 262.3 |
| D | 7 | 238 | 1045512 | 3890.03 | 1098 | 1066 | 268.5 |
| D | 1 | 52 | 930022 | 3459.89 | 1098 | 1066 | 268.5 |
| D | 8 | 195 | 509636 | 1894.17 | 1098 | 1066 | 268.5 |
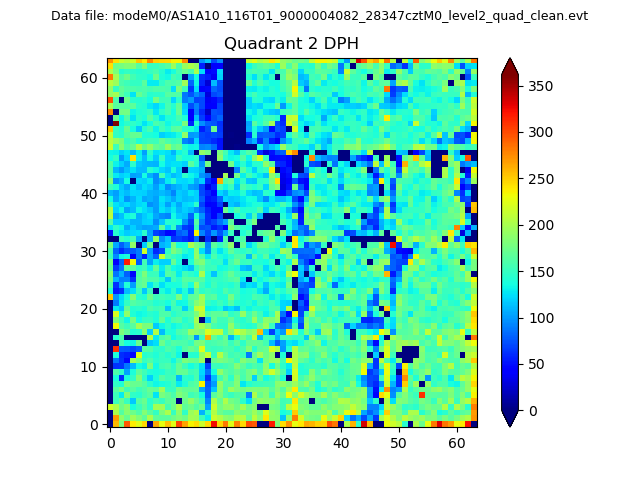
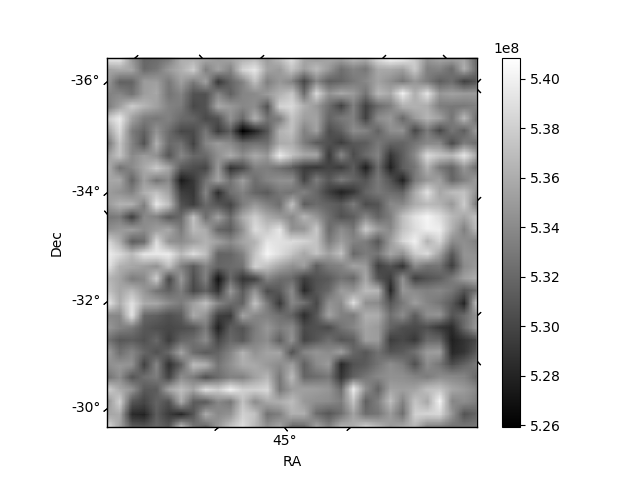
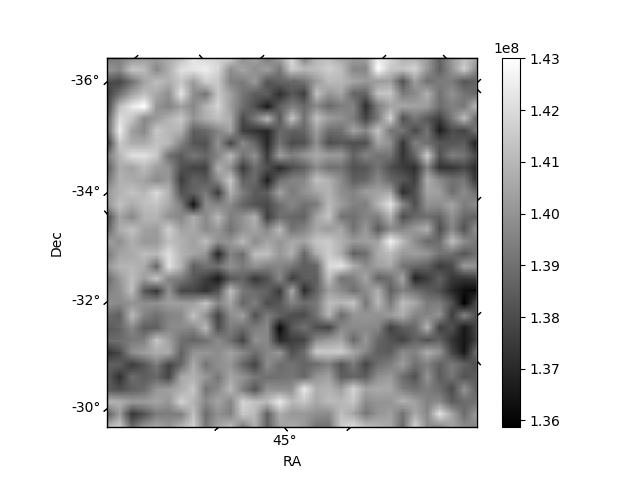
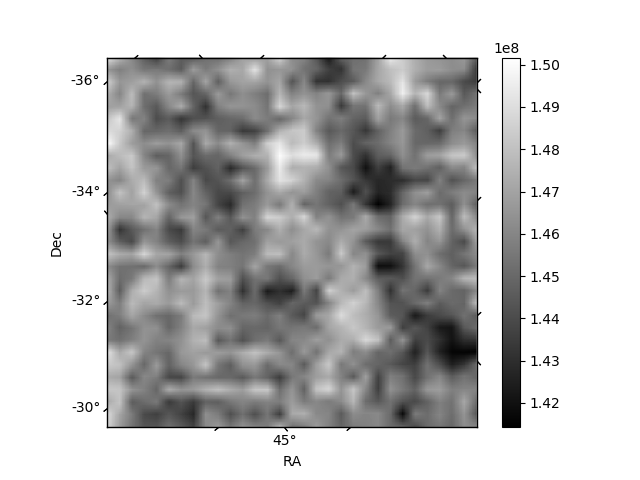
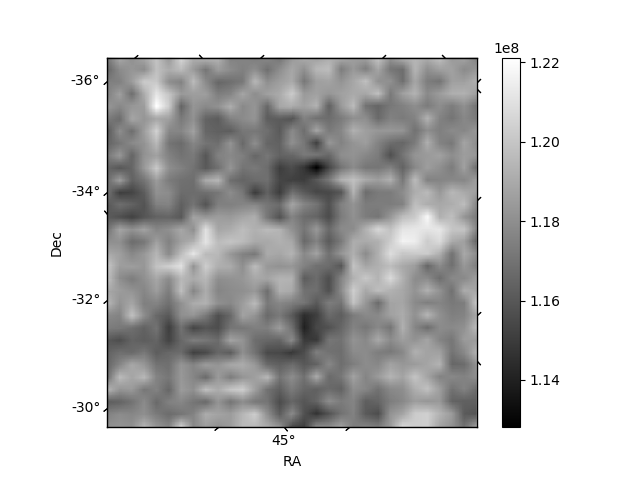
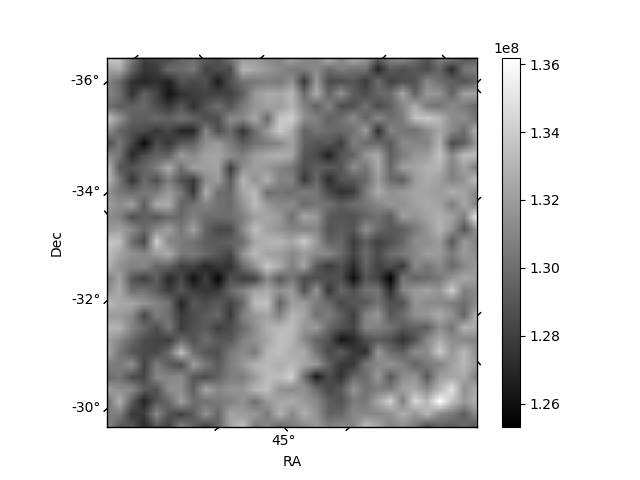
Histogram calculated using DETX and DETY for each event in the final _common_clean file
| Quadrant A | 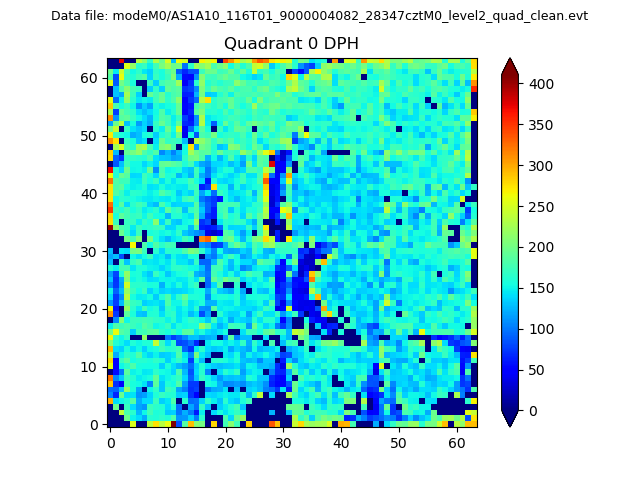 |
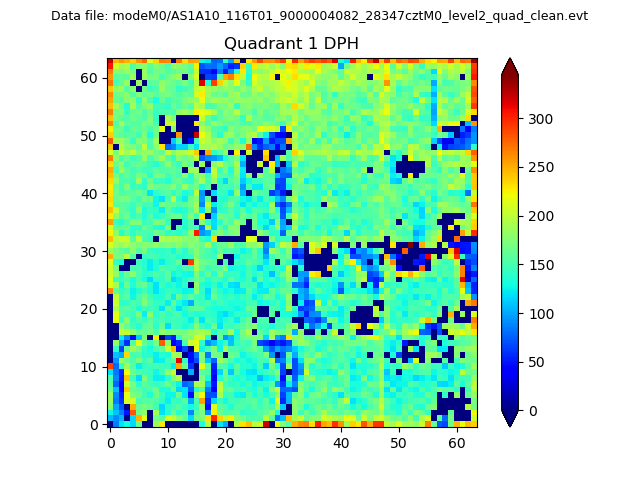 |
Quadrant B |
|---|---|---|---|
| Quadrant D | 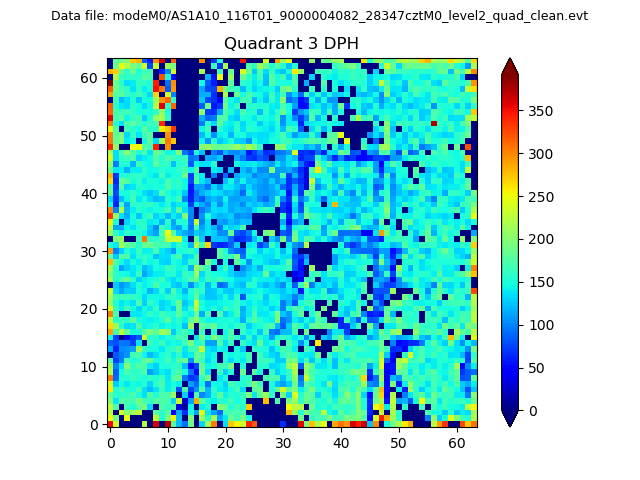 |
 |
Quadrant C |
| Plot type | Count rate plots | Images |
|---|---|---|
| Comparison with Poisson distribution Blue bars denote a histogram of data divided into 1 sec bins. Red curve is a Poisson curve with rate = median count rate of data. |
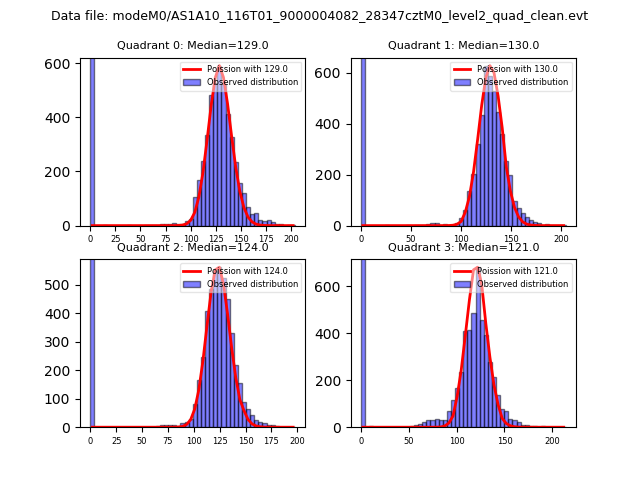 |
 |
| Quadrant-wise count rates Data is divided into 100 sec bins |
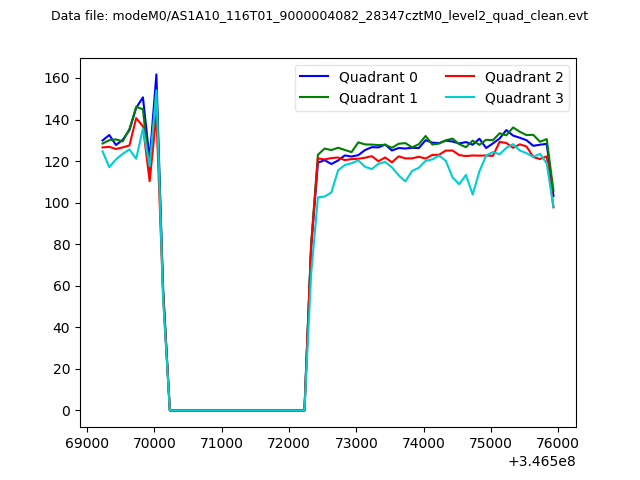 |
|
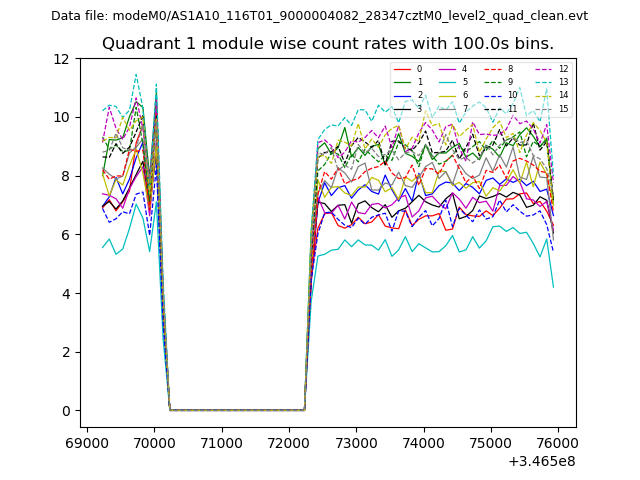
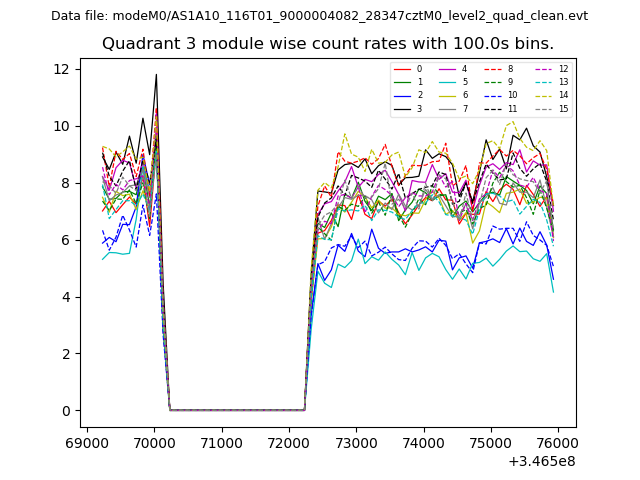
| Module-wise count rates for Quadrant A Data is divided into 100 sec bins |
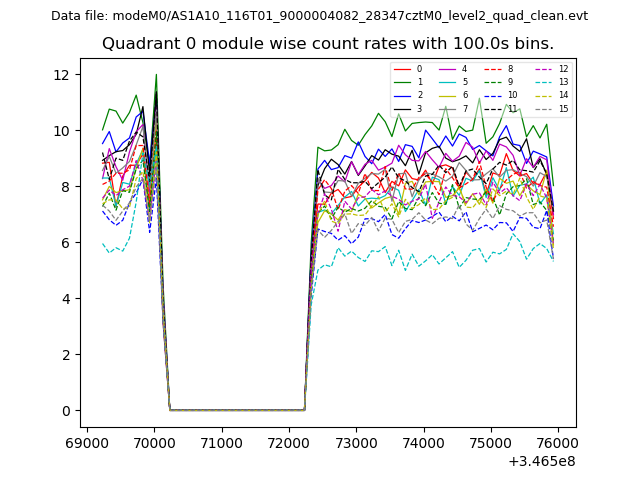 |
 |
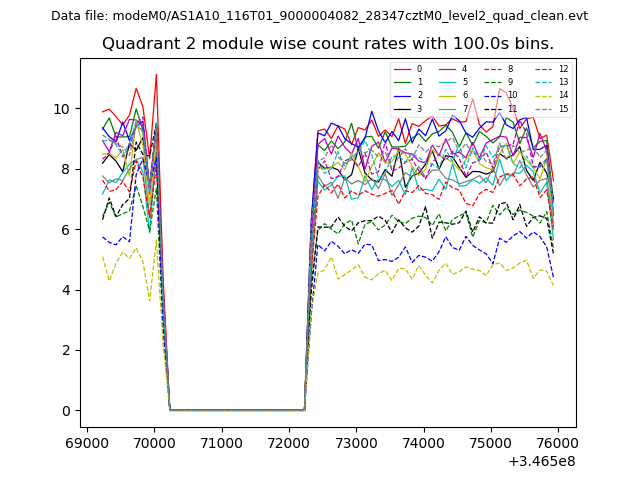
| Module-wise count rates for Quadrant B Data is divided into 100 sec bins |
 |
 |
| Module-wise count rates for Quadrant C Data is divided into 100 sec bins |
 |
 |
| Module-wise count rates for Quadrant D Data is divided into 100 sec bins |
 |
 |
| Parameter | Plot |
|---|---|
| CZT HV Monitor | 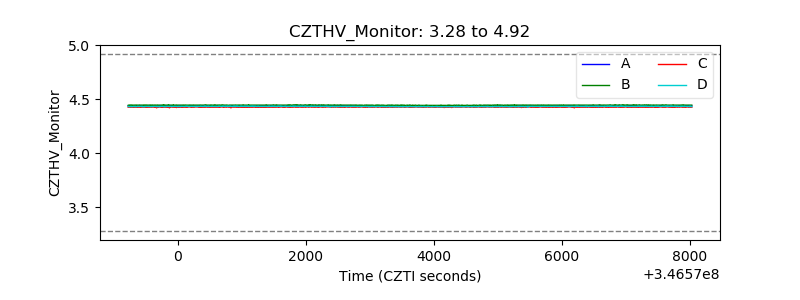 |
| D_VDD | 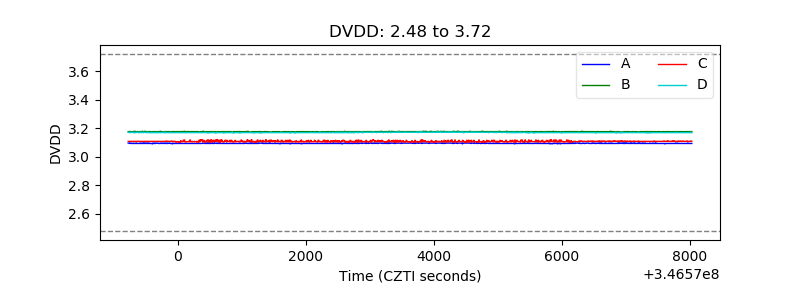 |
| Temperature 1 | 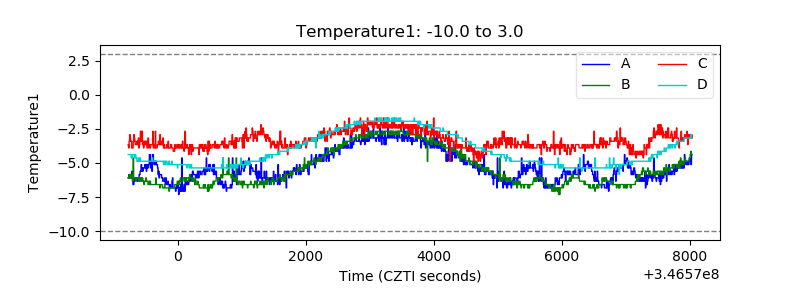 |
| Veto HV Monitor | 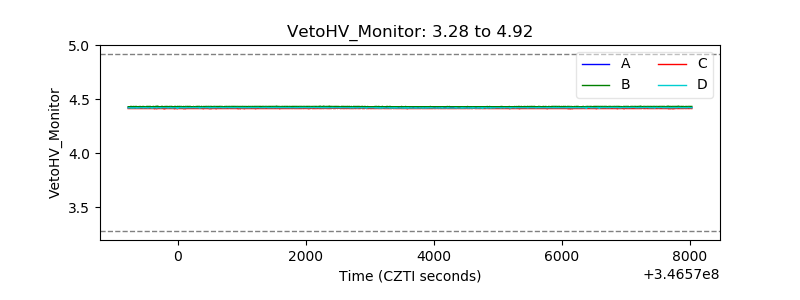 |
| Veto LLD | 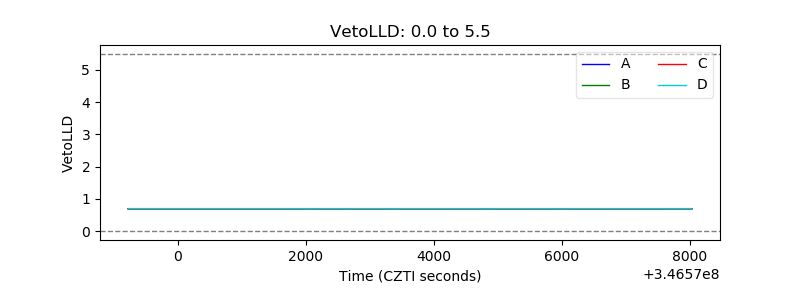 |
| Alpha Counter | 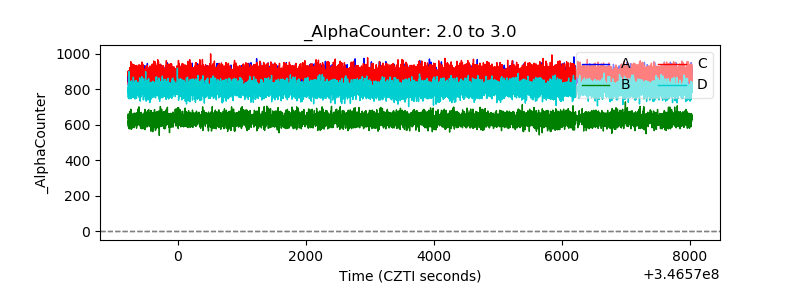 |
| _CPM_Rate |  |
| CZT Counter | 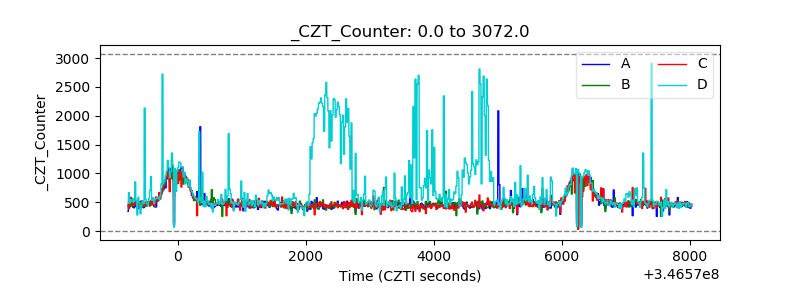 |
| +2.5 Volts monitor | 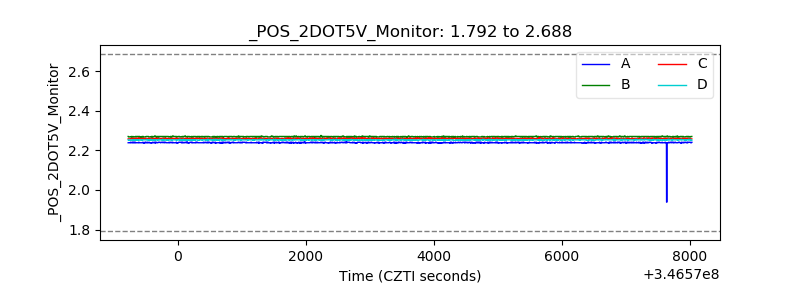 |
| +5 Volts monitor |  |
| _ROLL_ROT | 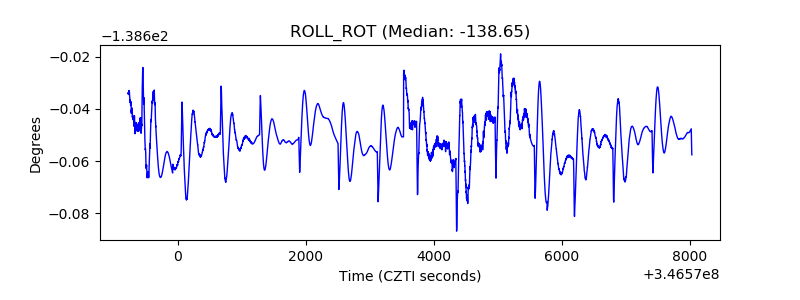 |
| _Roll_DEC | 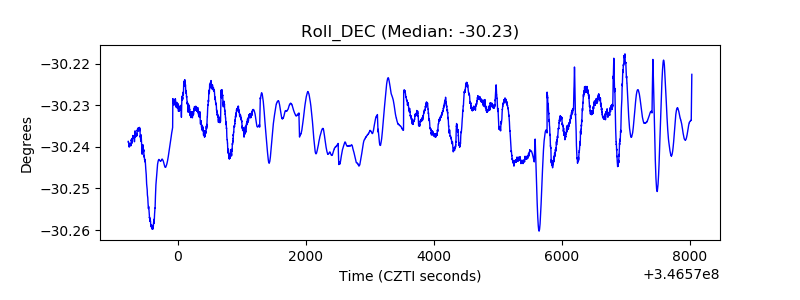 |
| _Roll_RA | 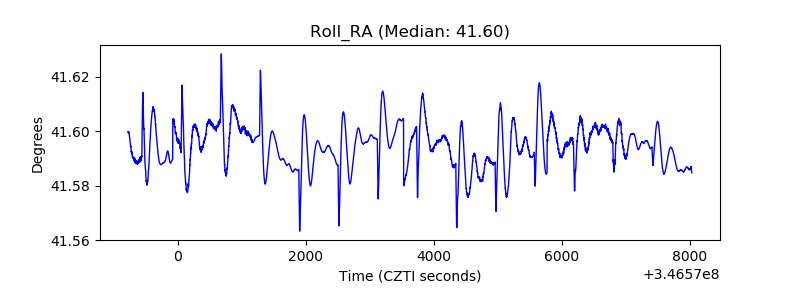 |
| Veto Counter | 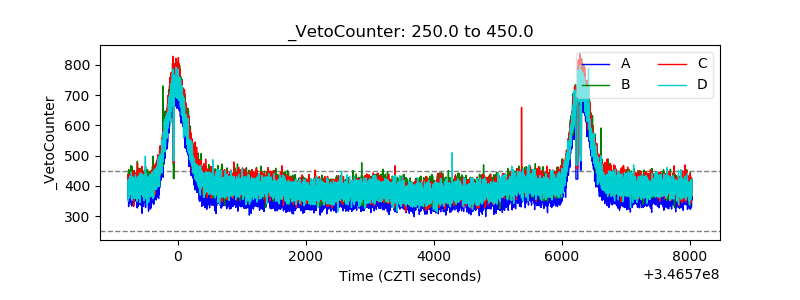 |