| Param | Original file | Final file |
|---|---|---|
| Filename | modeM0/AS1A10_116T01_9000004082_28348cztM0_level2.evt | modeM0/AS1A10_116T01_9000004082_28348cztM0_level2_quad_clean.evt |
| Size (bytes) | 312,511,680 | 43,960,320 |
| Size | 298.0 MB | 41.9 MB |
| Events in quadrant A | 2,163,905 | 260,433 |
| Events in quadrant B | 2,151,612 | 264,964 |
| Events in quadrant C | 2,120,068 | 254,677 |
| Events in quadrant D | 2,735,703 | 248,248 |
| Mode M0 | |||
|---|---|---|---|
| Quadrant | BADHDUFLAG | Total packets | Discarded packets |
| A | 0 | 9248 | 0 |
| B | 0 | 9146 | 0 |
| C | 0 | 9149 | 0 |
| D | 0 | 10973 | 0 |
| Quadrant | Total seconds | Saturated seconds | Saturation percentage |
|---|---|---|---|
| A | 4285 | 217 | 5.064177% |
| B | 4285 | 260 | 6.067678% |
| C | 4285 | 257 | 5.997666% |
| D | 4285 | 232 | 5.414236% |
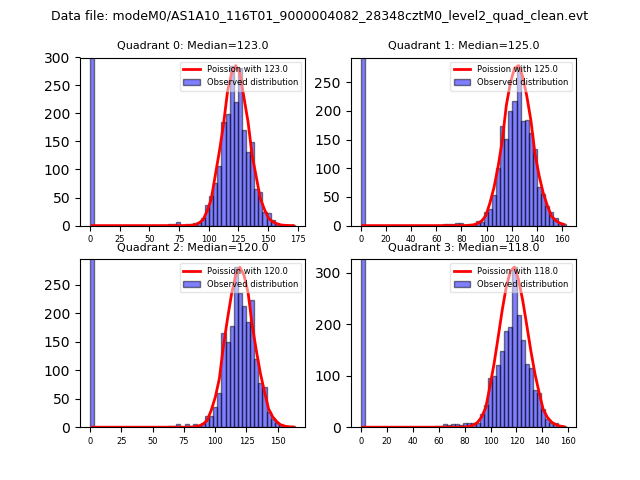
Noise dominated data is calculated using 1-second bins in cleaned event files. If a bin has >2000 counts, and if more than 50% of those come from <1% of pixels, then it is considered to be noise-dominated and hence unusable.
| Quadrant | # 1 sec bins | Bins with >0 counts | Bins with >2000 counts | High rate bins dominated by noise | Noise dominated (total time) | Noise dominated (detector-on time) | Marked lightcurve |
|---|---|---|---|---|---|---|---|
| A | 4330 | 4287 | 0 | 0 | 0.00% | 0.00% | 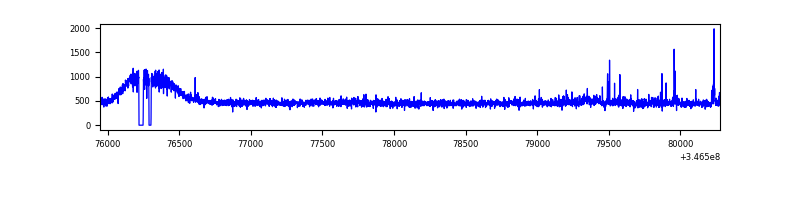 |
| B | 4330 | 4287 | 0 | 0 | 0.00% | 0.00% | 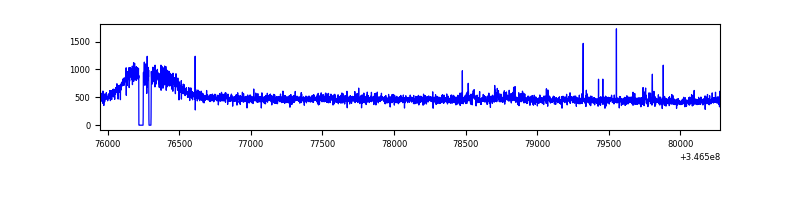 |
| C | 4330 | 4287 | 0 | 0 | 0.00% | 0.00% | 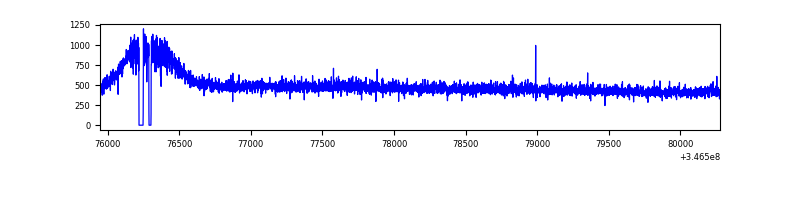 |
| D | 4330 | 4287 | 44 | 44 | 1.02% | 1.03% | 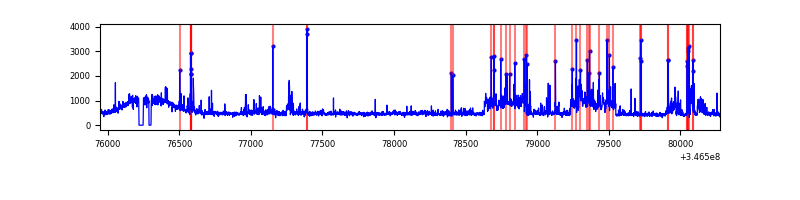 |
Top three noisy pixels from each quadrant. If the there are fewer than three noisy pixels in the level2.evt file, extra rows are filled as -1
| Pixel properties | Quadrant properties | ||||||
|---|---|---|---|---|---|---|---|
| Quadrant | DetID | PixID | Counts | Sigma | Mean | Median | Sigma |
| A | 15 | 174 | 26592 | 229.13 | 548 | 534 | 113.7 |
| A | 12 | 96 | 24255 | 208.58 | 548 | 534 | 113.7 |
| A | 13 | 254 | 6359 | 51.22 | 548 | 534 | 113.7 |
| B | 0 | 230 | 16707 | 149.9 | 539 | 523 | 108.0 |
| B | 12 | 111 | 13895 | 123.85 | 539 | 523 | 108.0 |
| B | 11 | 111 | 12540 | 111.3 | 539 | 523 | 108.0 |
| C | 14 | 238 | 81155 | 639.3 | 523 | 526 | 126.1 |
| C | 13 | 61 | 3528 | 23.8 | 523 | 526 | 126.1 |
| C | 3 | 233 | 2484 | 15.52 | 523 | 526 | 126.1 |
| D | 8 | 195 | 396797 | 3010.47 | 535 | 519 | 131.6 |
| D | 1 | 52 | 236136 | 1789.95 | 535 | 519 | 131.6 |
| D | 2 | 250 | 45306 | 340.24 | 535 | 519 | 131.6 |
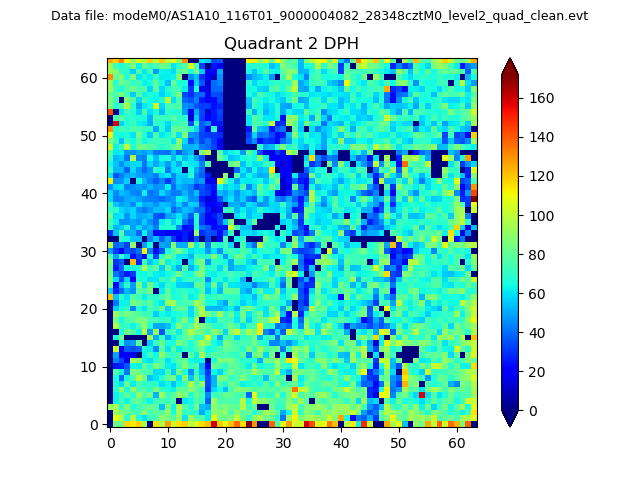
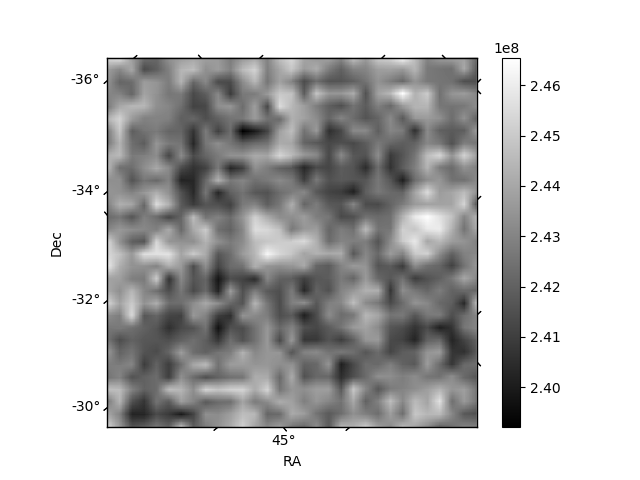
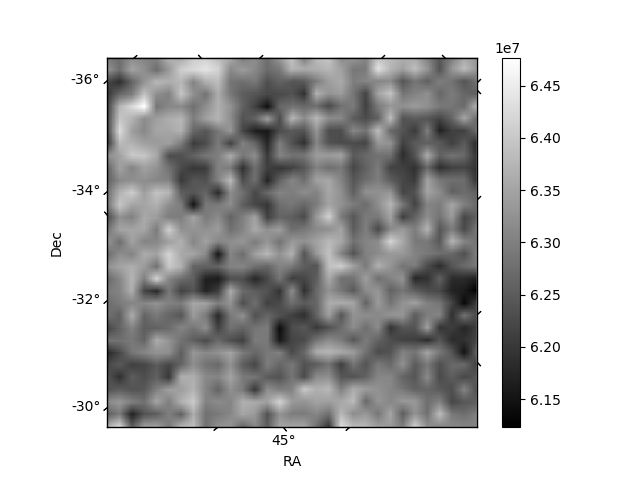
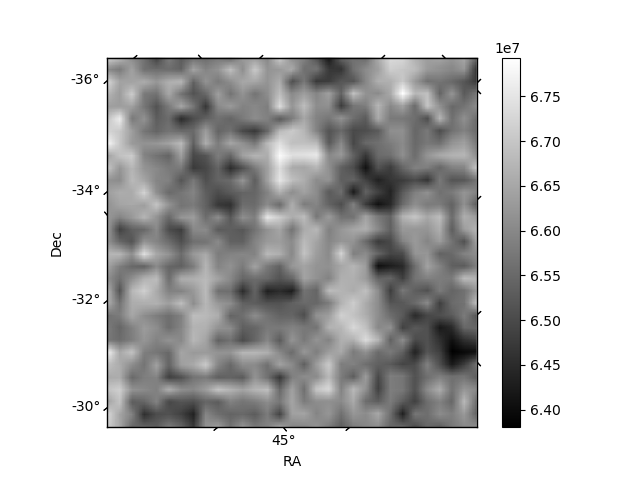
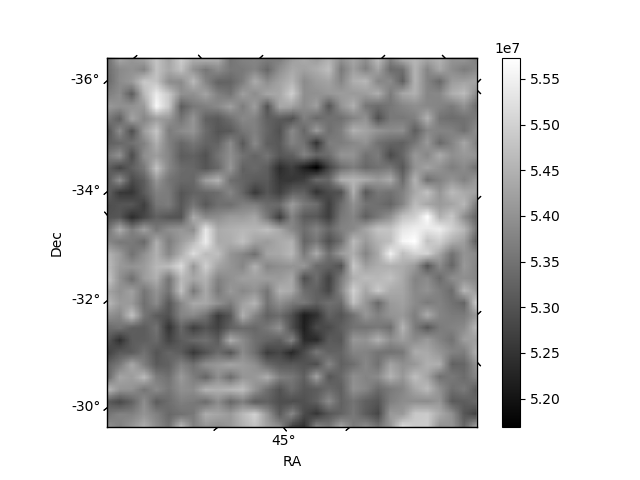
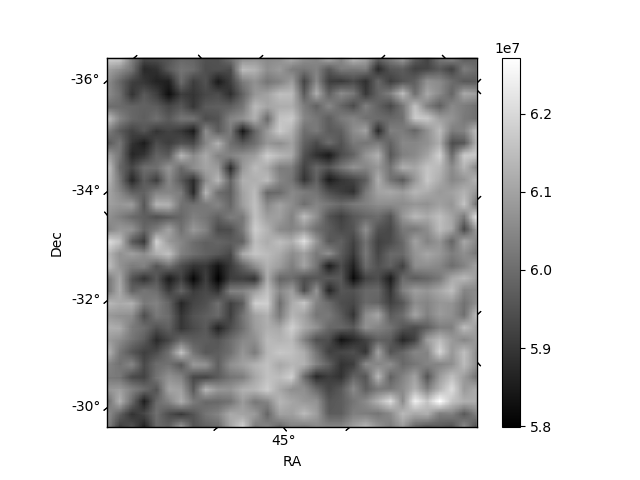
Histogram calculated using DETX and DETY for each event in the final _common_clean file
| Quadrant A | 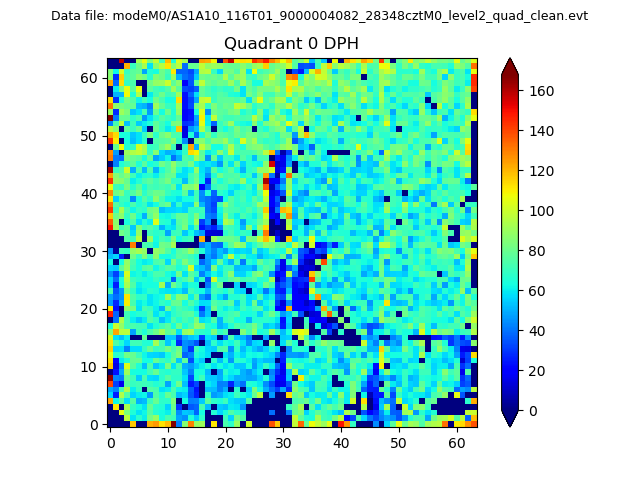 |
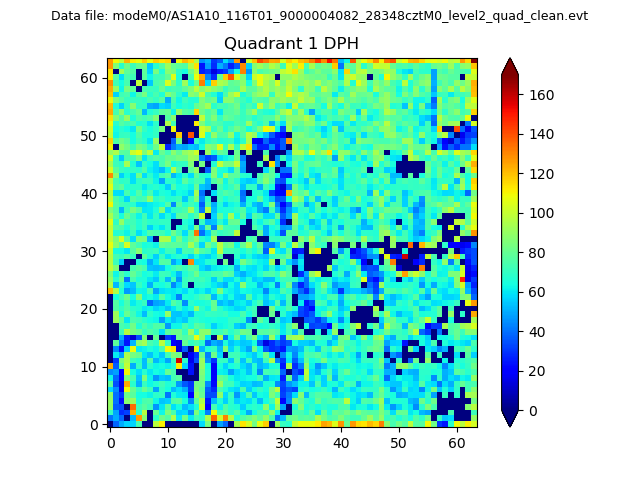 |
Quadrant B |
|---|---|---|---|
| Quadrant D | 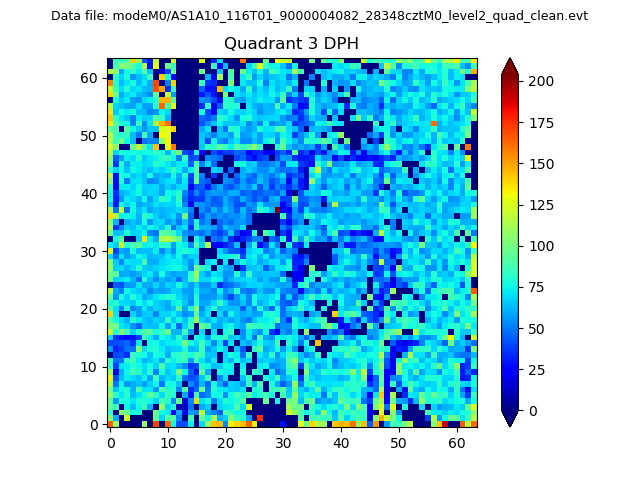 |
 |
Quadrant C |
| Plot type | Count rate plots | Images |
|---|---|---|
| Comparison with Poisson distribution Blue bars denote a histogram of data divided into 1 sec bins. Red curve is a Poisson curve with rate = median count rate of data. |
 |
 |
| Quadrant-wise count rates Data is divided into 100 sec bins |
 |
|
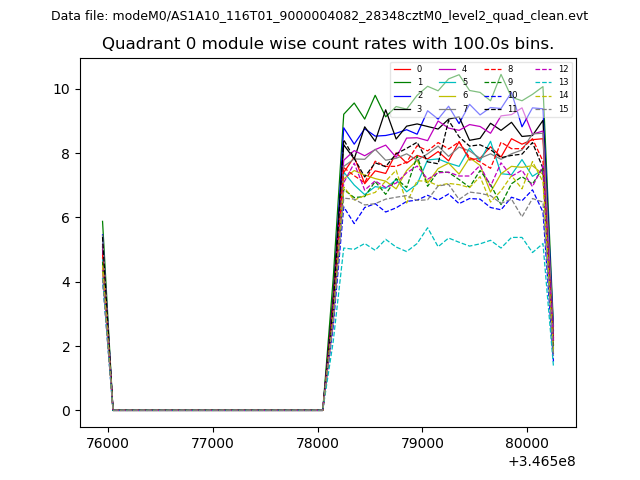
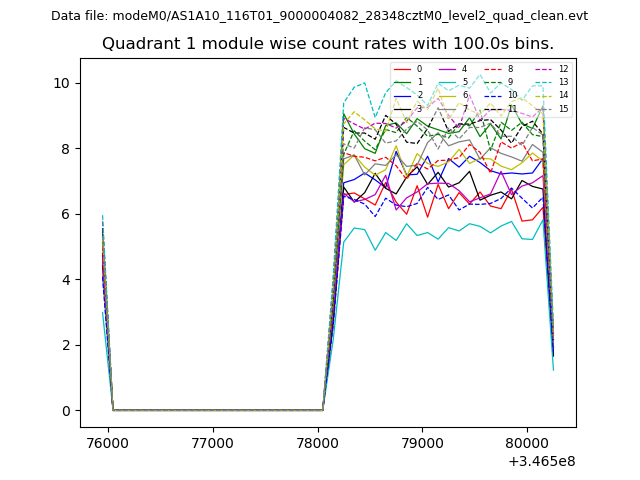
| Module-wise count rates for Quadrant A Data is divided into 100 sec bins |
 |
 |
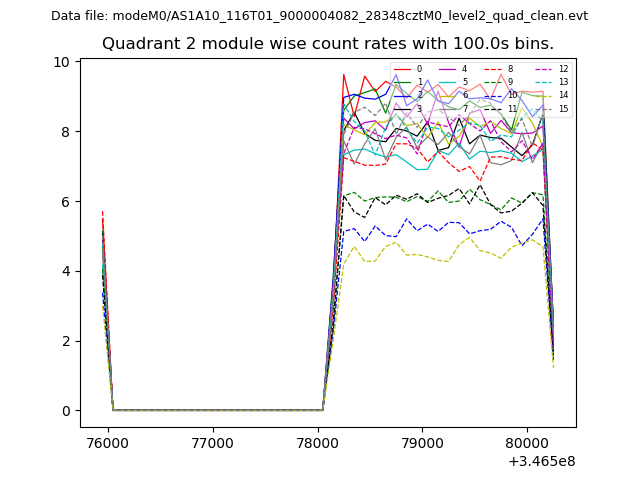
| Module-wise count rates for Quadrant B Data is divided into 100 sec bins |
 |
 |
| Module-wise count rates for Quadrant C Data is divided into 100 sec bins |
 |
 |
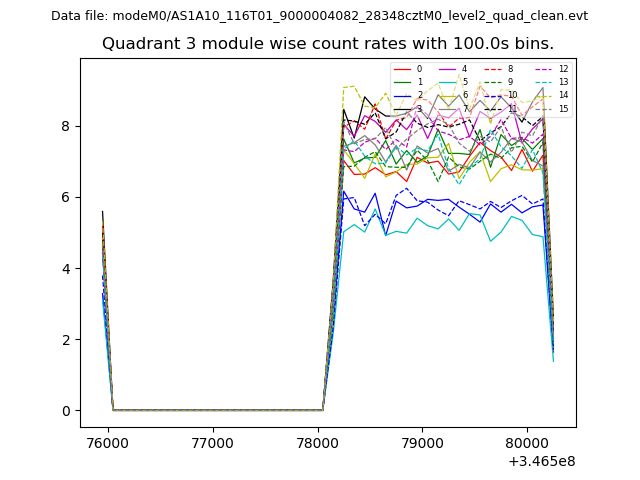
| Module-wise count rates for Quadrant D Data is divided into 100 sec bins |
 |
 |
| Parameter | Plot |
|---|---|
| CZT HV Monitor | 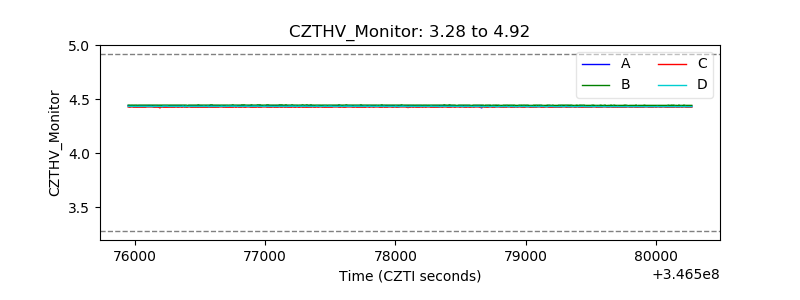 |
| D_VDD | 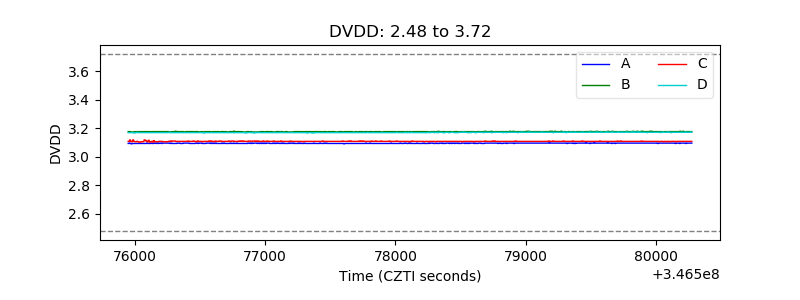 |
| Temperature 1 | 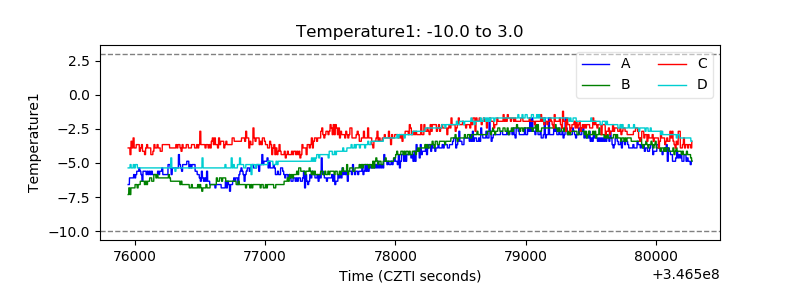 |
| Veto HV Monitor | 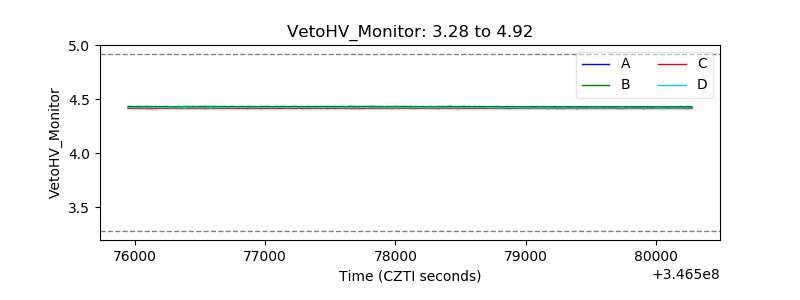 |
| Veto LLD | 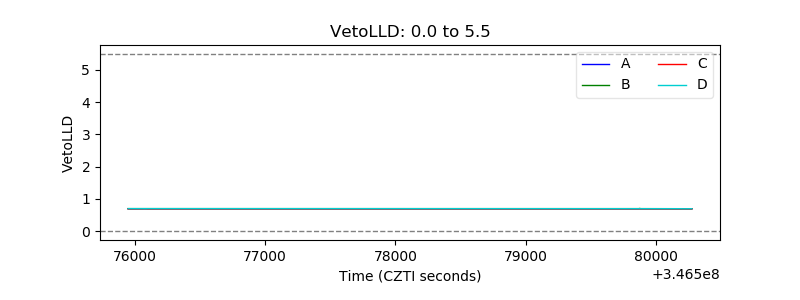 |
| Alpha Counter |  |
| _CPM_Rate | 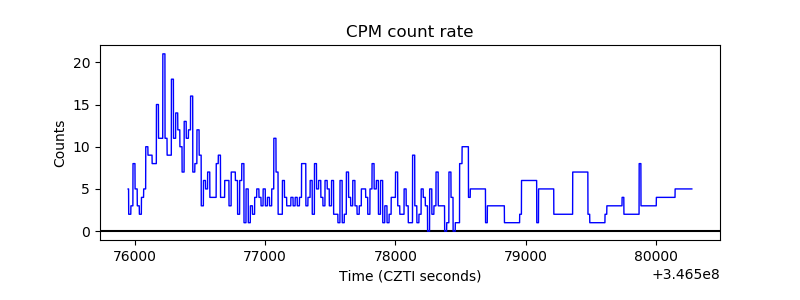 |
| CZT Counter | 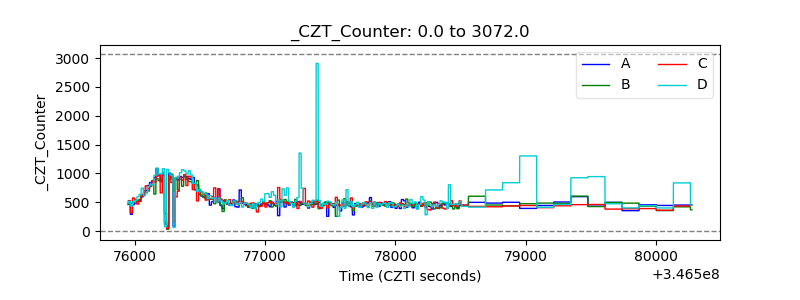 |
| +2.5 Volts monitor |  |
| +5 Volts monitor |  |
| _ROLL_ROT | 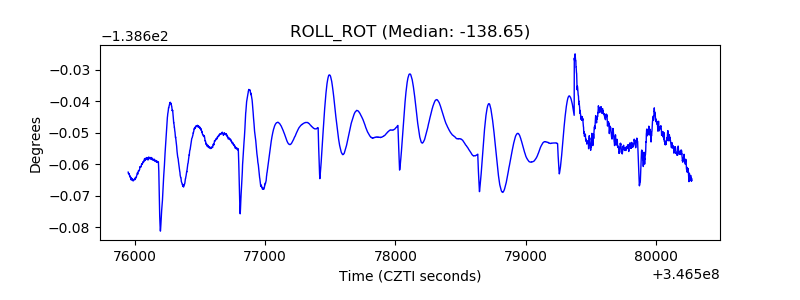 |
| _Roll_DEC | 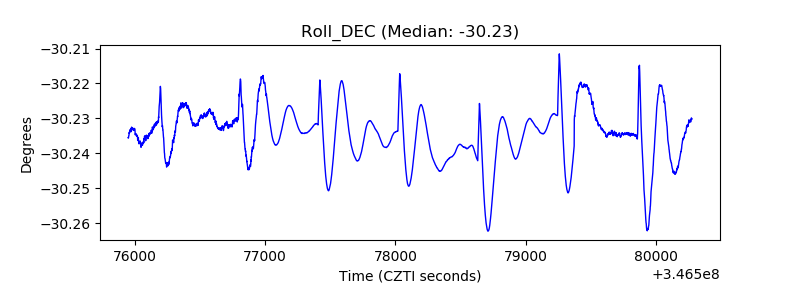 |
| _Roll_RA | 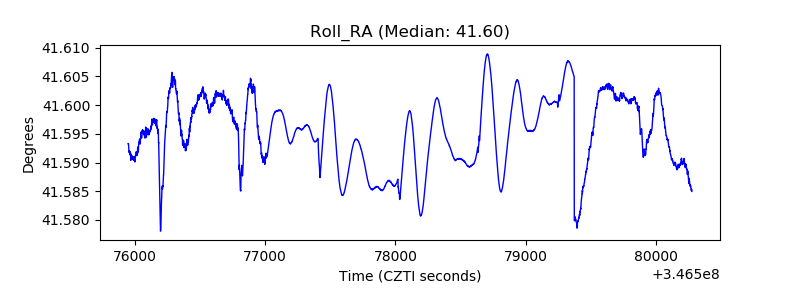 |
| Veto Counter | 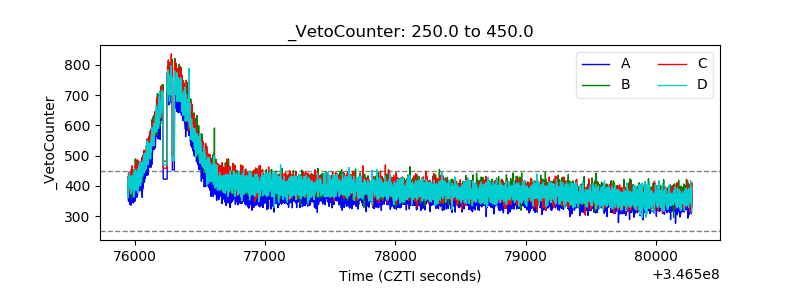 |