| Param | Original file | Final file |
|---|---|---|
| Filename | modeM0/AS1A10_116T01_9000004082_28350cztM0_level2.evt | modeM0/AS1A10_116T01_9000004082_28350cztM0_level2_quad_clean.evt |
| Size (bytes) | 1,152,861,120 | 210,769,920 |
| Size | 1.1 GB | 201.0 MB |
| Events in quadrant A | 8,413,855 | 1,345,636 |
| Events in quadrant B | 7,576,701 | 1,373,189 |
| Events in quadrant C | 7,416,232 | 1,310,151 |
| Events in quadrant D | 10,444,882 | 1,270,121 |
| Mode M9 | |||
|---|---|---|---|
| Quadrant | BADHDUFLAG | Total packets | Discarded packets |
| A | 0 | 17 | 0 |
| B | 0 | 17 | 0 |
| C | 0 | 17 | 0 |
| D | 0 | 17 | 0 |
| Mode M0 | |||
|---|---|---|---|
| Quadrant | BADHDUFLAG | Total packets | Discarded packets |
| A | 0 | 34998 | 0 |
| B | 0 | 32440 | 0 |
| C | 0 | 32246 | 0 |
| D | 0 | 41387 | 0 |
| Quadrant | Total seconds | Saturated seconds | Saturation percentage |
|---|---|---|---|
| A | 15723 | 387 | 2.461362% |
| B | 15724 | 236 | 1.500890% |
| C | 15724 | 283 | 1.799796% |
| D | 15723 | 551 | 3.504420% |
Noise dominated data is calculated using 1-second bins in cleaned event files. If a bin has >2000 counts, and if more than 50% of those come from <1% of pixels, then it is considered to be noise-dominated and hence unusable.
| Quadrant | # 1 sec bins | Bins with >0 counts | Bins with >2000 counts | High rate bins dominated by noise | Noise dominated (total time) | Noise dominated (detector-on time) | Marked lightcurve |
|---|---|---|---|---|---|---|---|
| A | 17413 | 15725 | 170 | 170 | 0.98% | 1.08% | 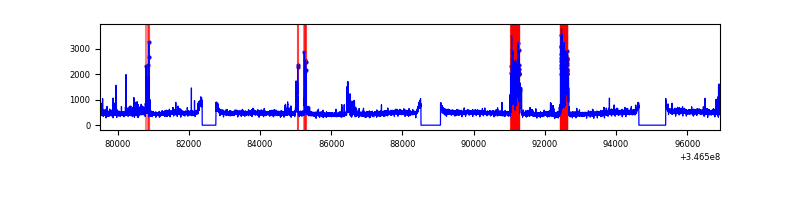 |
| B | 17414 | 15724 | 3 | 3 | 0.02% | 0.02% | 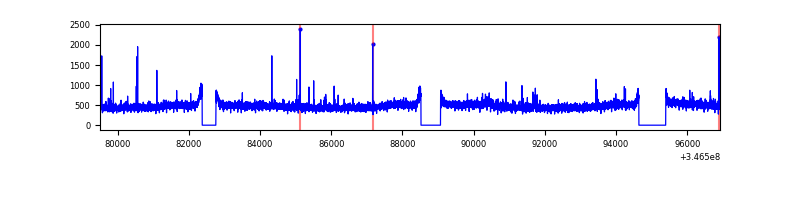 |
| C | 17414 | 15727 | 0 | 0 | 0.00% | 0.00% | 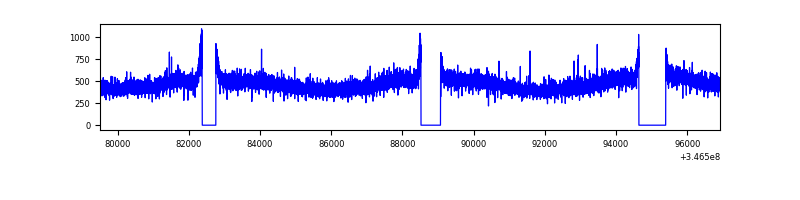 |
| D | 17413 | 15726 | 303 | 303 | 1.74% | 1.93% | 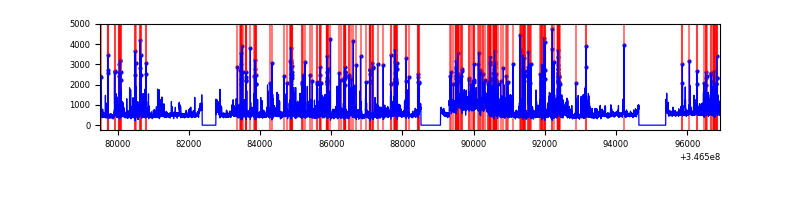 |
Top three noisy pixels from each quadrant. If the there are fewer than three noisy pixels in the level2.evt file, extra rows are filled as -1
| Pixel properties | Quadrant properties | ||||||
|---|---|---|---|---|---|---|---|
| Quadrant | DetID | PixID | Counts | Sigma | Mean | Median | Sigma |
| A | 15 | 174 | 1037744 | 2673.45 | 1903 | 1859 | 387.5 |
| A | 12 | 96 | 40519 | 99.78 | 1903 | 1859 | 387.5 |
| A | 13 | 254 | 24174 | 57.59 | 1903 | 1859 | 387.5 |
| B | 0 | 230 | 63034 | 166.84 | 1898 | 1850 | 366.7 |
| B | 12 | 111 | 46605 | 122.04 | 1898 | 1850 | 366.7 |
| B | 11 | 111 | 42372 | 110.5 | 1898 | 1850 | 366.7 |
| C | 14 | 238 | 293743 | 684.42 | 1825 | 1832 | 426.5 |
| C | 3 | 233 | 14164 | 28.91 | 1825 | 1832 | 426.5 |
| C | 13 | 61 | 12571 | 25.18 | 1825 | 1832 | 426.5 |
| D | 1 | 52 | 2093836 | 4815.87 | 1821 | 1774 | 434.4 |
| D | 8 | 195 | 919137 | 2111.74 | 1821 | 1774 | 434.4 |
| D | 2 | 250 | 235021 | 536.93 | 1821 | 1774 | 434.4 |
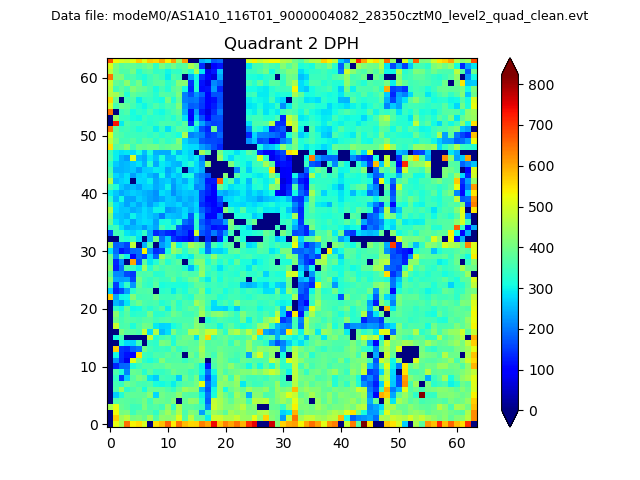
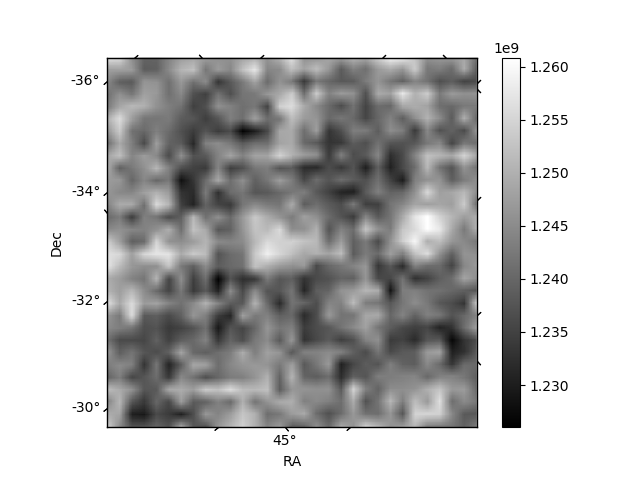
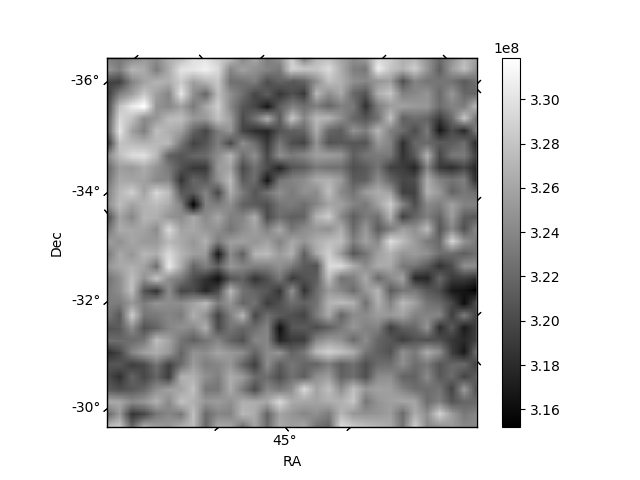
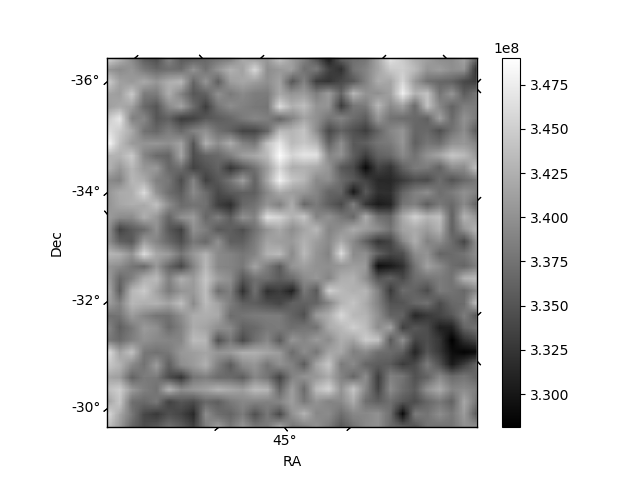
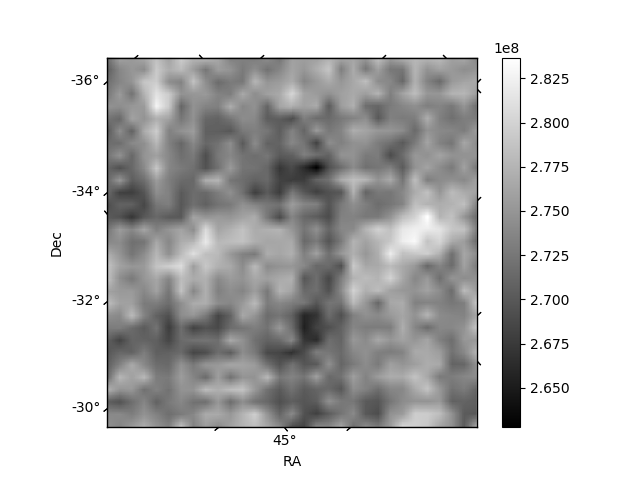
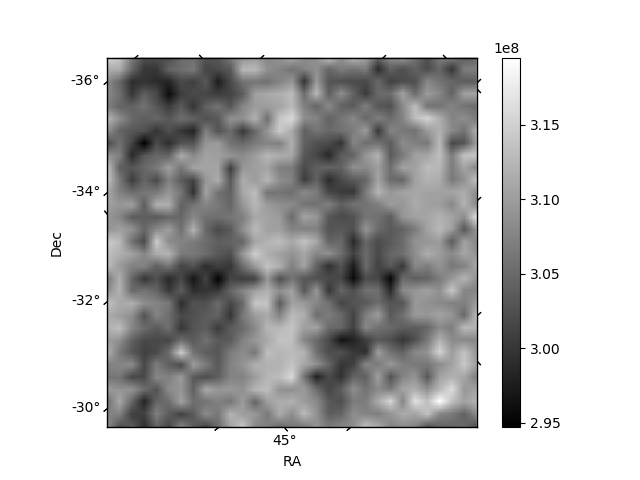
Histogram calculated using DETX and DETY for each event in the final _common_clean file
| Quadrant A | 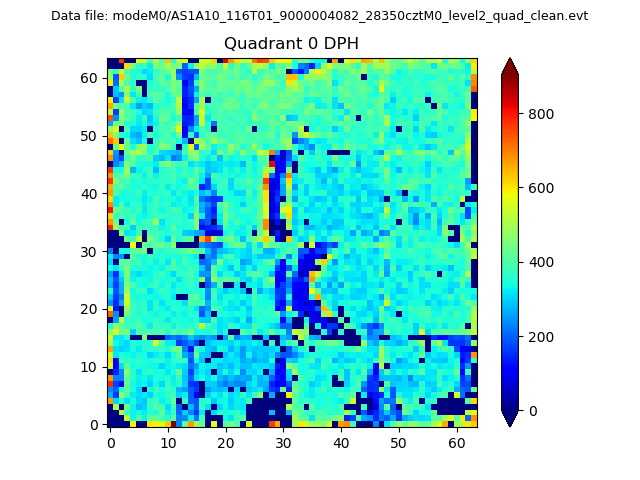 |
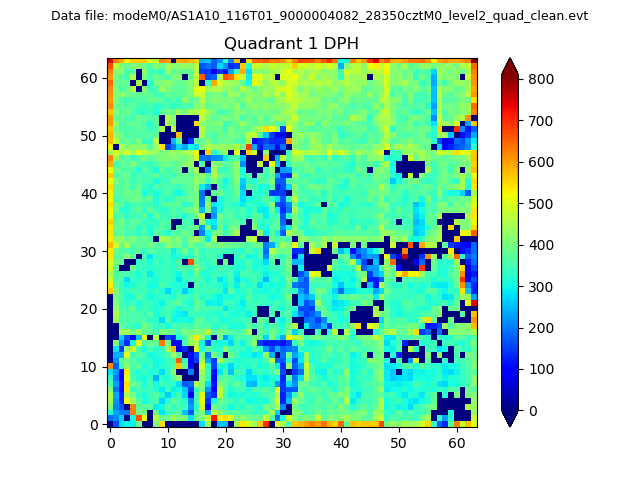 |
Quadrant B |
|---|---|---|---|
| Quadrant D | 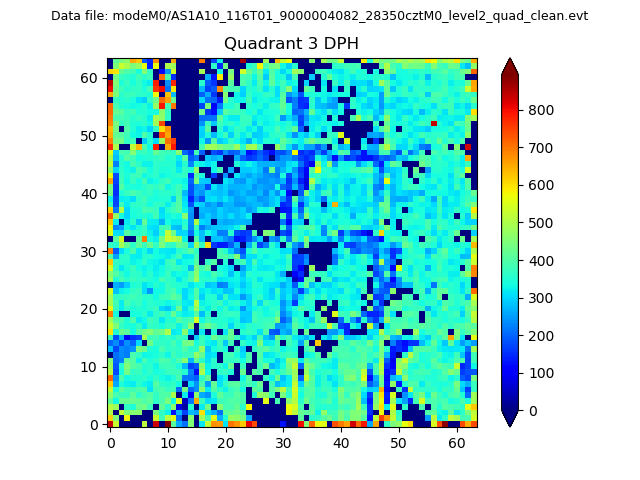 |
 |
Quadrant C |
| Plot type | Count rate plots | Images |
|---|---|---|
| Comparison with Poisson distribution Blue bars denote a histogram of data divided into 1 sec bins. Red curve is a Poisson curve with rate = median count rate of data. |
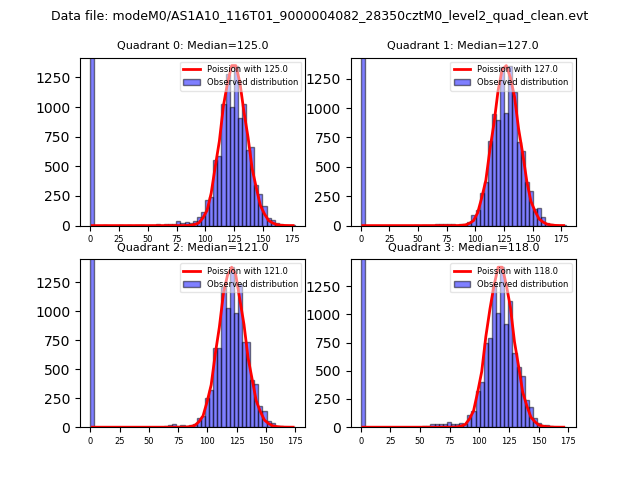 |
 |
| Quadrant-wise count rates Data is divided into 100 sec bins |
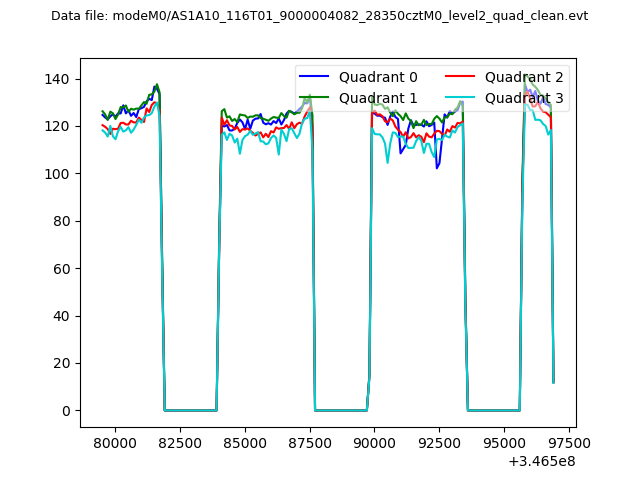 |
|
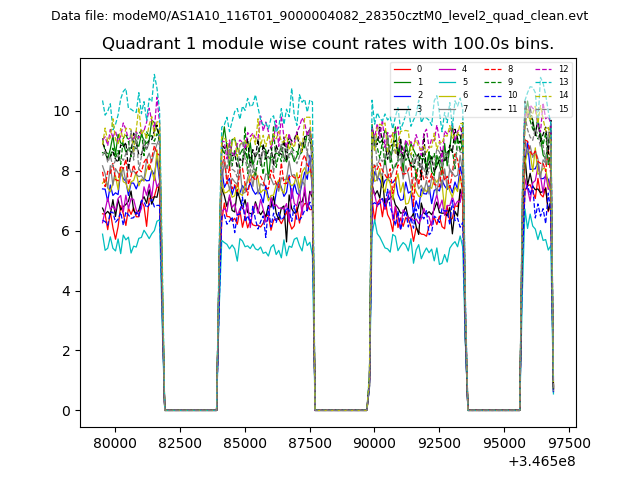
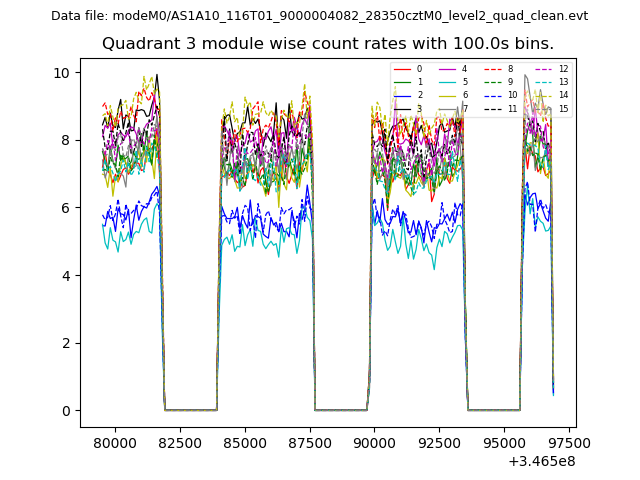
| Module-wise count rates for Quadrant A Data is divided into 100 sec bins |
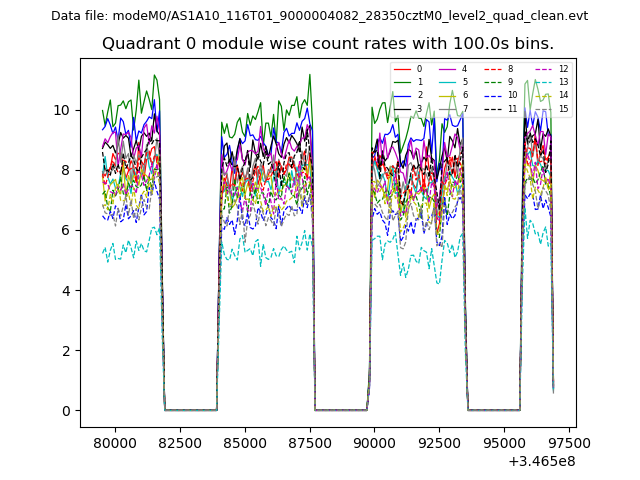 |
 |
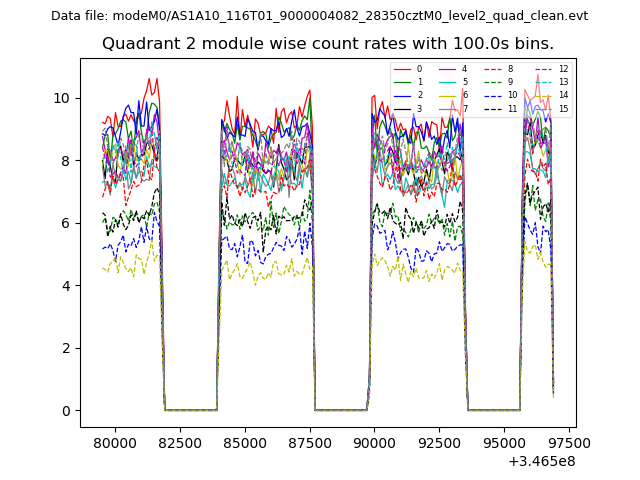
| Module-wise count rates for Quadrant B Data is divided into 100 sec bins |
 |
 |
| Module-wise count rates for Quadrant C Data is divided into 100 sec bins |
 |
 |
| Module-wise count rates for Quadrant D Data is divided into 100 sec bins |
 |
 |
| Parameter | Plot |
|---|---|
| CZT HV Monitor | 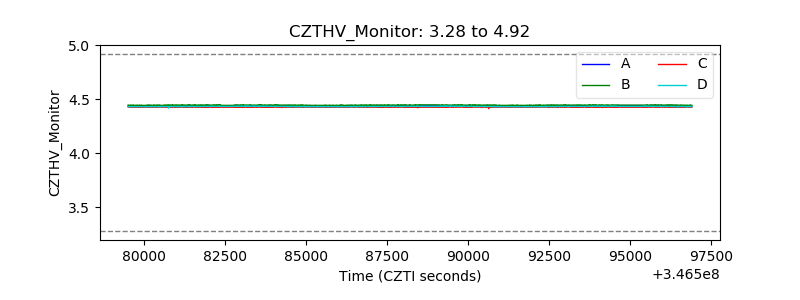 |
| D_VDD | 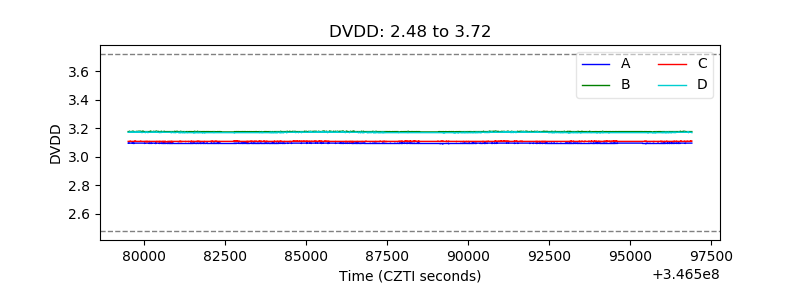 |
| Temperature 1 | 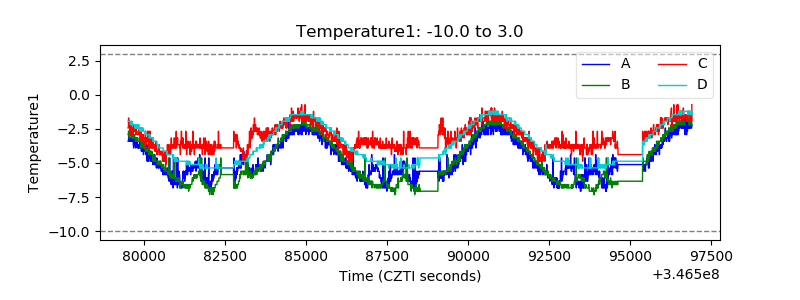 |
| Veto HV Monitor | 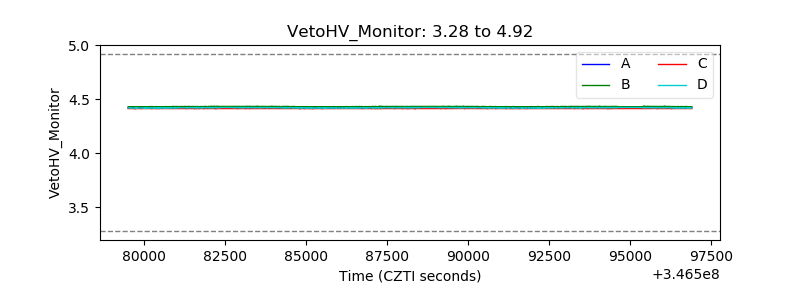 |
| Veto LLD | 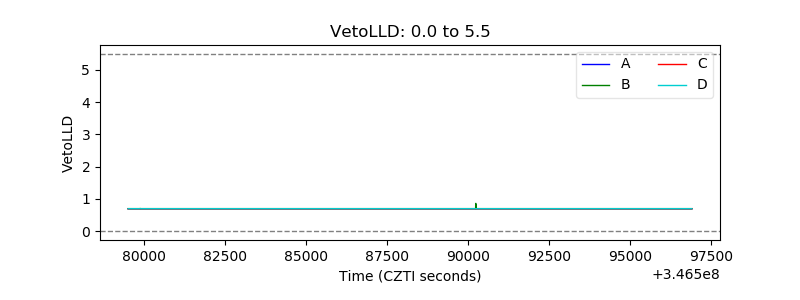 |
| Alpha Counter | 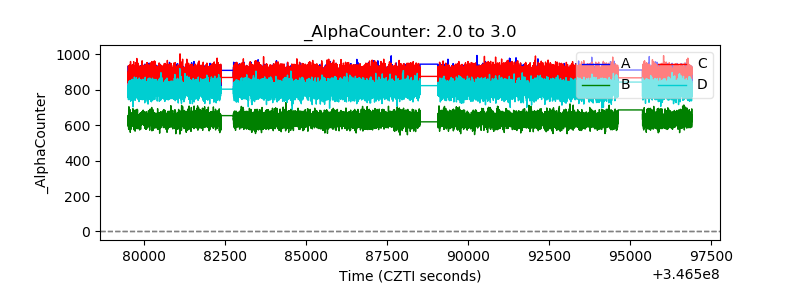 |
| _CPM_Rate | 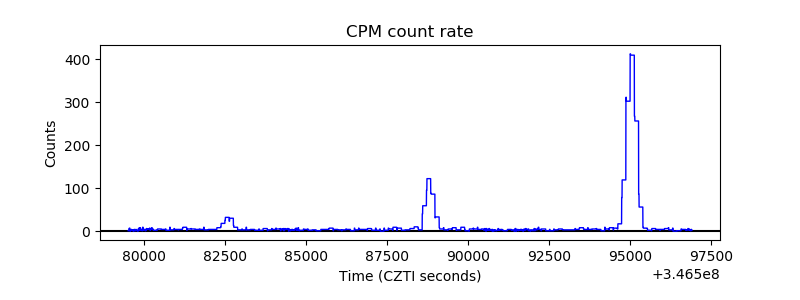 |
| CZT Counter | 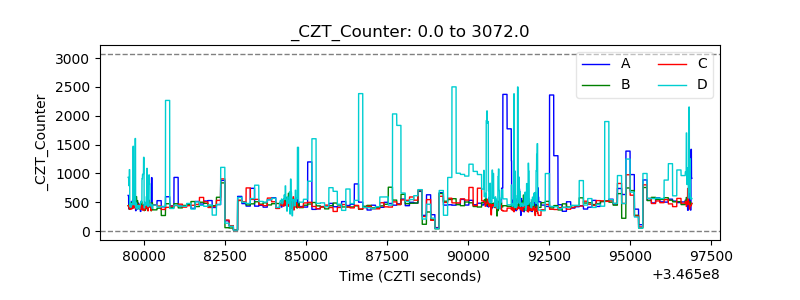 |
| +2.5 Volts monitor |  |
| +5 Volts monitor |  |
| _ROLL_ROT | 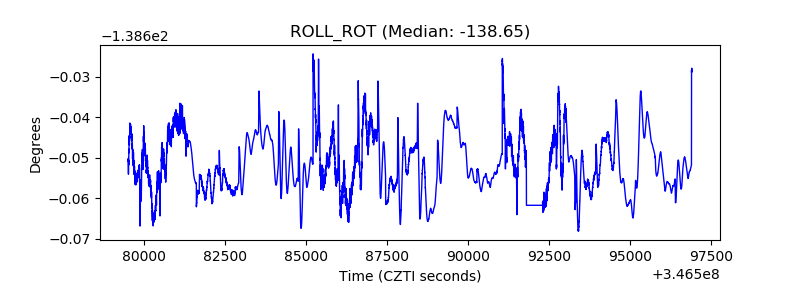 |
| _Roll_DEC | 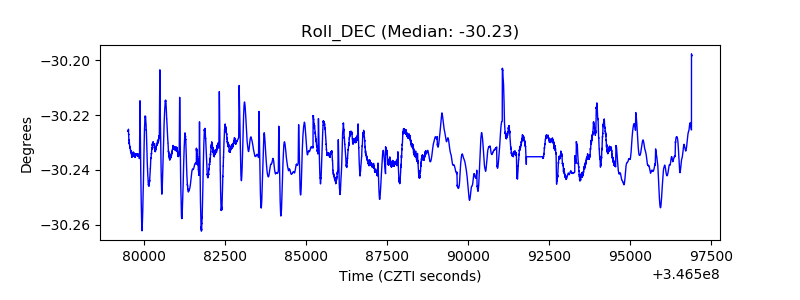 |
| _Roll_RA | 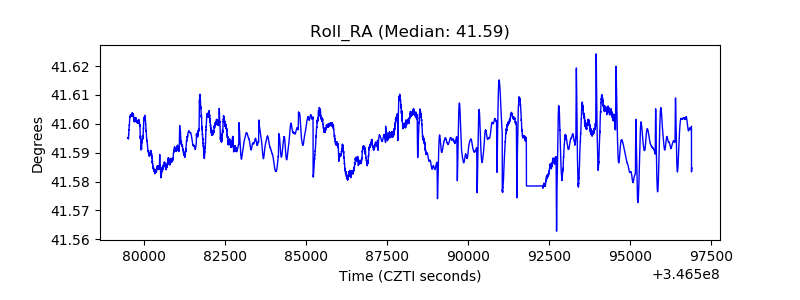 |
| Veto Counter | 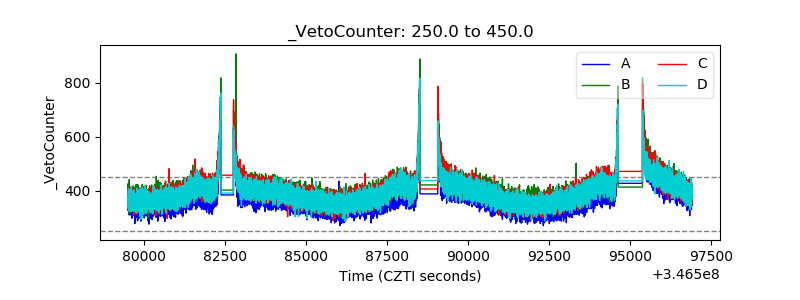 |