| Param | Original file | Final file |
|---|---|---|
| Filename | modeM0/AS1A10_116T01_9000004082_28351cztM0_level2.evt | modeM0/AS1A10_116T01_9000004082_28351cztM0_level2_quad_clean.evt |
| Size (bytes) | 487,457,280 | 95,855,040 |
| Size | 464.9 MB | 91.4 MB |
| Events in quadrant A | 3,707,085 | 625,048 |
| Events in quadrant B | 3,072,377 | 646,764 |
| Events in quadrant C | 2,957,807 | 610,103 |
| Events in quadrant D | 4,601,192 | 584,701 |
| Mode M9 | |||
|---|---|---|---|
| Quadrant | BADHDUFLAG | Total packets | Discarded packets |
| A | 0 | 10 | 0 |
| B | 0 | 10 | 0 |
| C | 0 | 10 | 0 |
| D | 0 | 10 | 0 |
| Mode M0 | |||
|---|---|---|---|
| Quadrant | BADHDUFLAG | Total packets | Discarded packets |
| A | 0 | 15176 | 0 |
| B | 0 | 13071 | 0 |
| C | 0 | 12879 | 0 |
| D | 0 | 17813 | 0 |
| Quadrant | Total seconds | Saturated seconds | Saturation percentage |
|---|---|---|---|
| A | 6252 | 239 | 3.822777% |
| B | 6253 | 49 | 0.783624% |
| C | 6253 | 69 | 1.103470% |
| D | 6253 | 225 | 3.598273% |
Noise dominated data is calculated using 1-second bins in cleaned event files. If a bin has >2000 counts, and if more than 50% of those come from <1% of pixels, then it is considered to be noise-dominated and hence unusable.
| Quadrant | # 1 sec bins | Bins with >0 counts | Bins with >2000 counts | High rate bins dominated by noise | Noise dominated (total time) | Noise dominated (detector-on time) | Marked lightcurve |
|---|---|---|---|---|---|---|---|
| A | 7202 | 6253 | 171 | 171 | 2.37% | 2.73% | 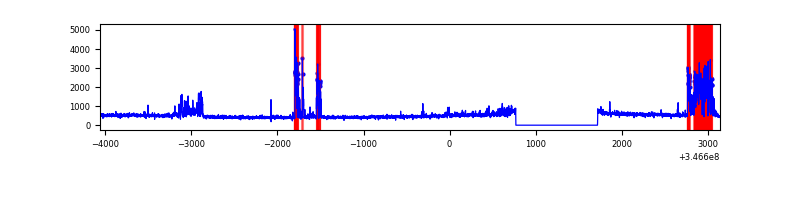 |
| B | 7203 | 6254 | 4 | 4 | 0.06% | 0.06% | 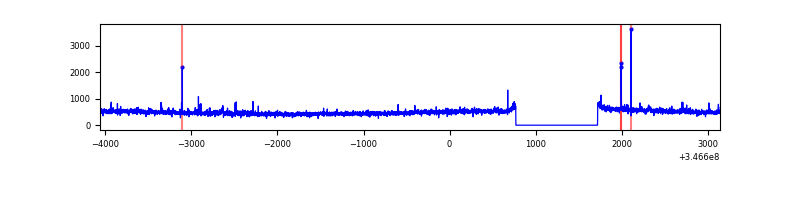 |
| C | 7203 | 6254 | 0 | 0 | 0.00% | 0.00% | 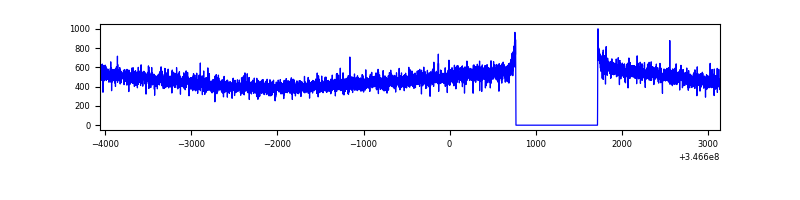 |
| D | 7203 | 6254 | 173 | 173 | 2.40% | 2.77% | 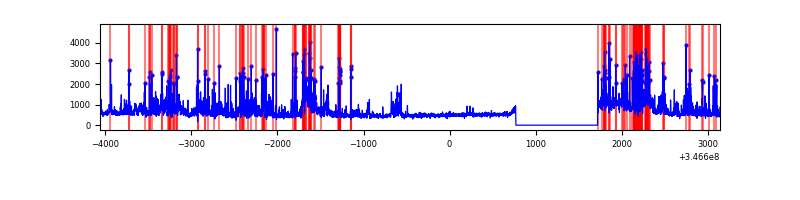 |
Top three noisy pixels from each quadrant. If the there are fewer than three noisy pixels in the level2.evt file, extra rows are filled as -1
| Pixel properties | Quadrant properties | ||||||
|---|---|---|---|---|---|---|---|
| Quadrant | DetID | PixID | Counts | Sigma | Mean | Median | Sigma |
| A | 15 | 174 | 764736 | 4917.27 | 762 | 745 | 155.4 |
| A | 13 | 254 | 10172 | 60.67 | 762 | 745 | 155.4 |
| A | 3 | 137 | 7633 | 44.33 | 762 | 745 | 155.4 |
| B | 10 | 245 | 26298 | 173.47 | 761 | 743 | 147.3 |
| B | 12 | 111 | 18434 | 120.09 | 761 | 743 | 147.3 |
| B | 0 | 230 | 18290 | 119.11 | 761 | 743 | 147.3 |
| C | 14 | 238 | 116836 | 678.63 | 728 | 730 | 171.1 |
| C | 13 | 61 | 5012 | 25.03 | 728 | 730 | 171.1 |
| C | 3 | 233 | 3055 | 13.59 | 728 | 730 | 171.1 |
| D | 1 | 52 | 1355924 | 7713.0 | 728 | 708 | 175.7 |
| D | 8 | 195 | 387180 | 2199.54 | 728 | 708 | 175.7 |
| D | 2 | 250 | 85181 | 480.76 | 728 | 708 | 175.7 |
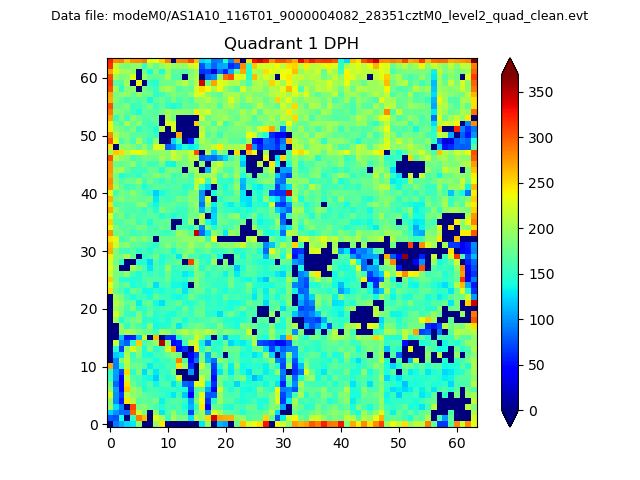
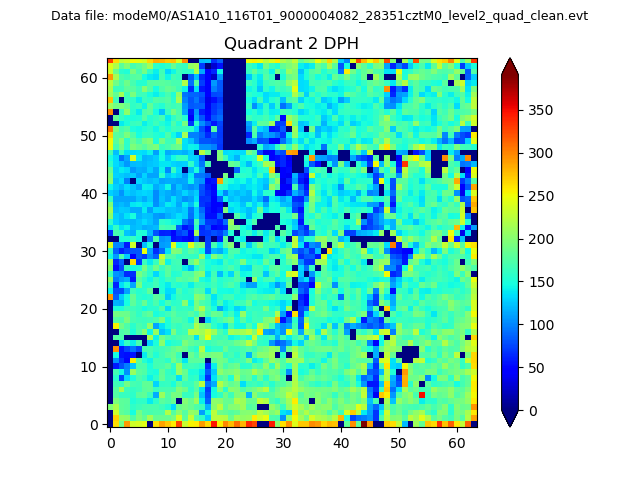
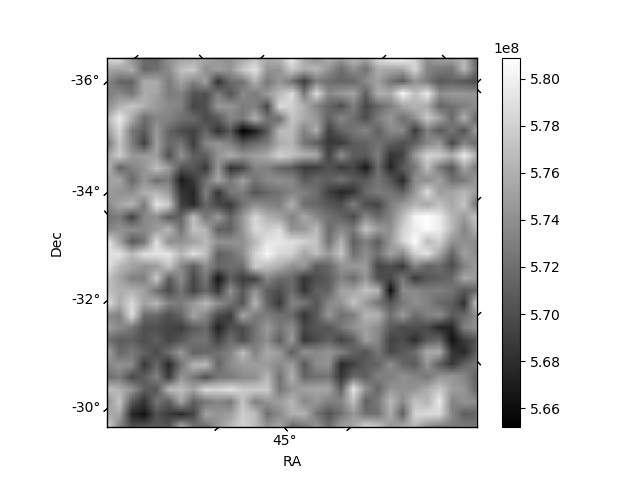
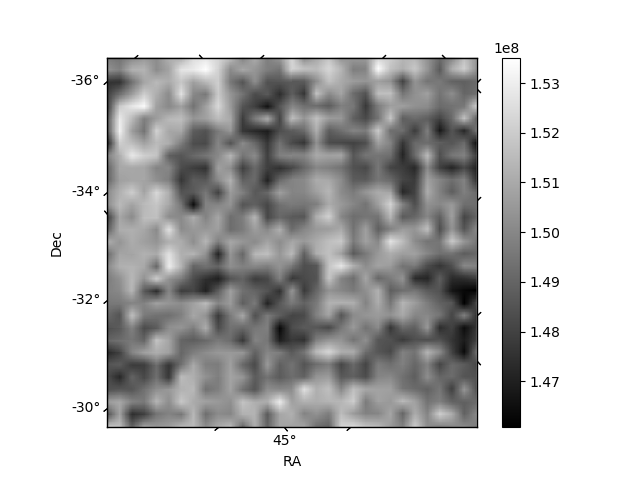
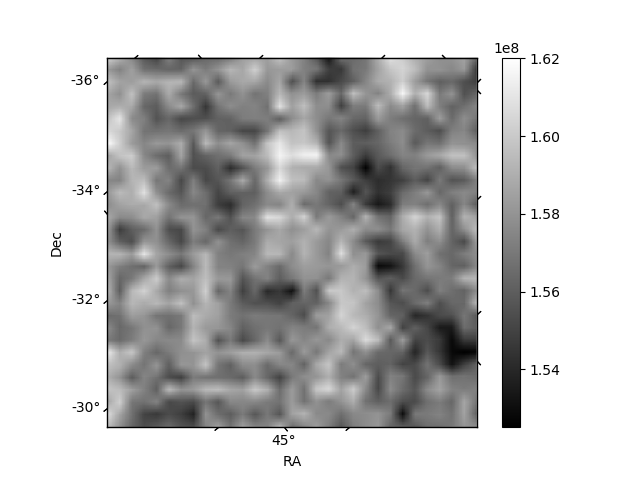
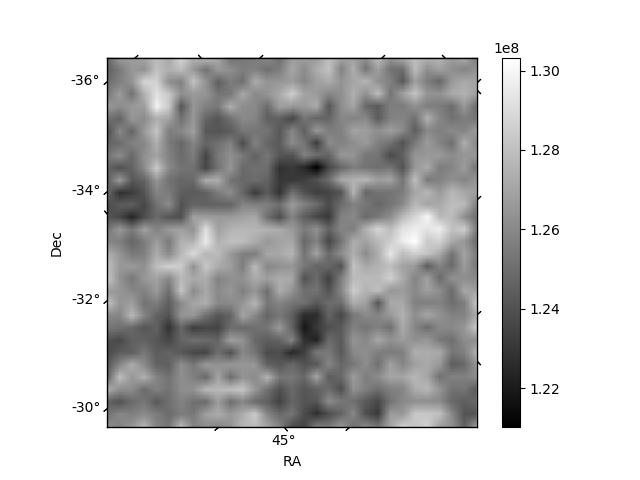
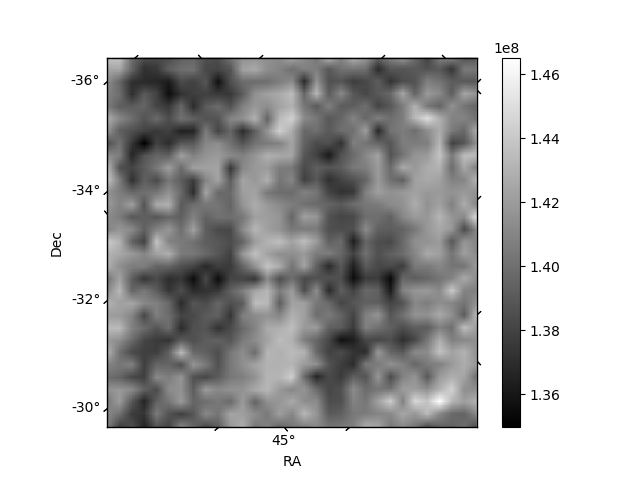
Histogram calculated using DETX and DETY for each event in the final _common_clean file
| Quadrant A |  |
 |
Quadrant B |
|---|---|---|---|
| Quadrant D | 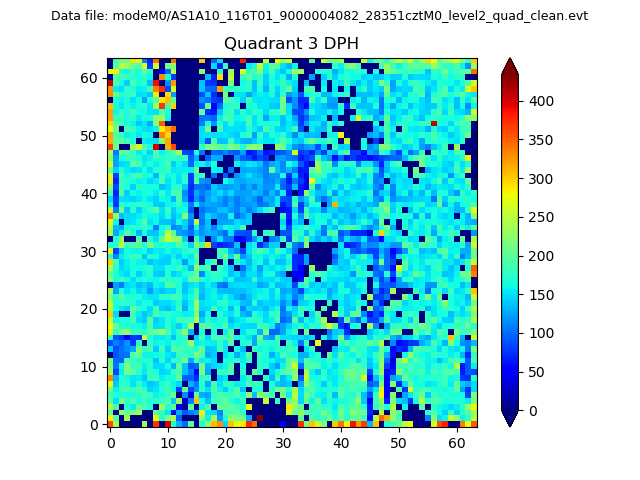 |
 |
Quadrant C |
| Plot type | Count rate plots | Images |
|---|---|---|
| Comparison with Poisson distribution Blue bars denote a histogram of data divided into 1 sec bins. Red curve is a Poisson curve with rate = median count rate of data. |
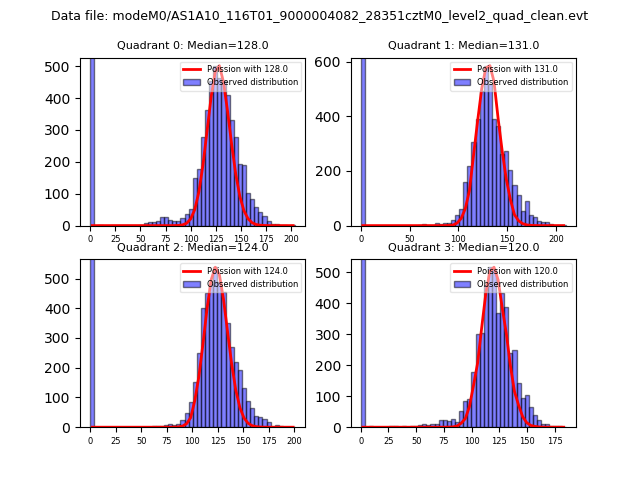 |
 |
| Quadrant-wise count rates Data is divided into 100 sec bins |
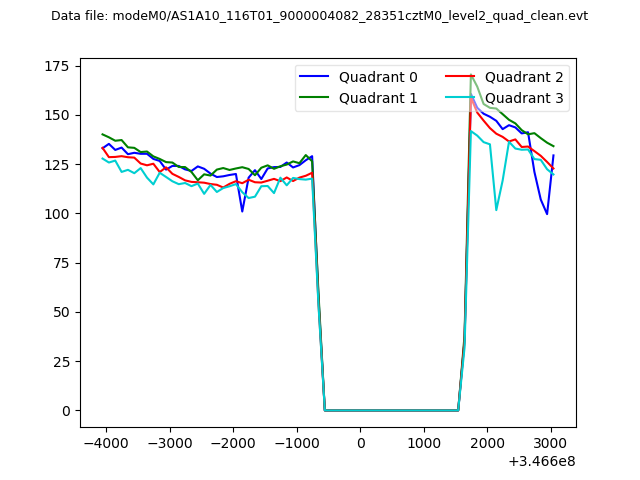 |
|
| Module-wise count rates for Quadrant A Data is divided into 100 sec bins |
 |
 |
| Module-wise count rates for Quadrant B Data is divided into 100 sec bins |
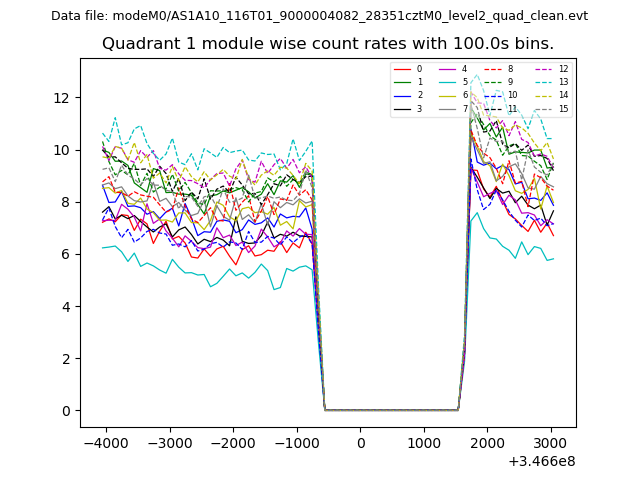 |
 |
| Module-wise count rates for Quadrant C Data is divided into 100 sec bins |
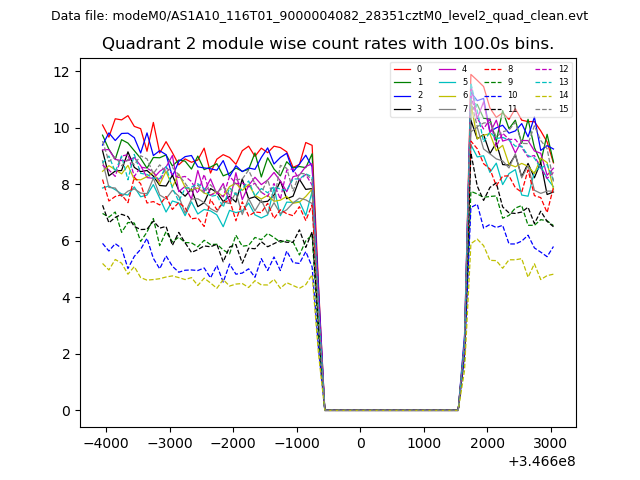 |
 |
| Module-wise count rates for Quadrant D Data is divided into 100 sec bins |
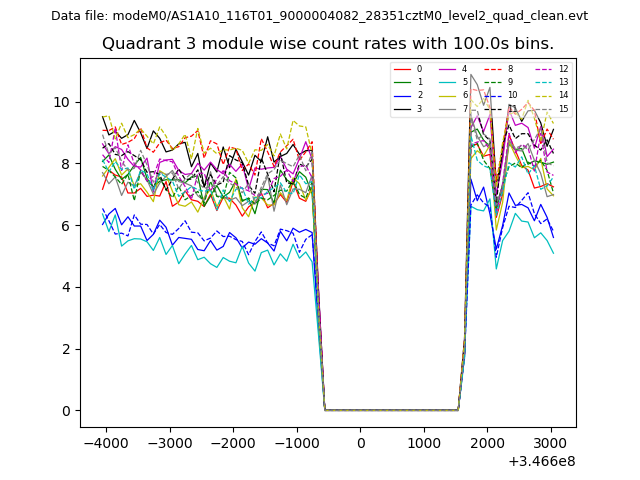 |
 |
| Parameter | Plot |
|---|---|
| CZT HV Monitor | 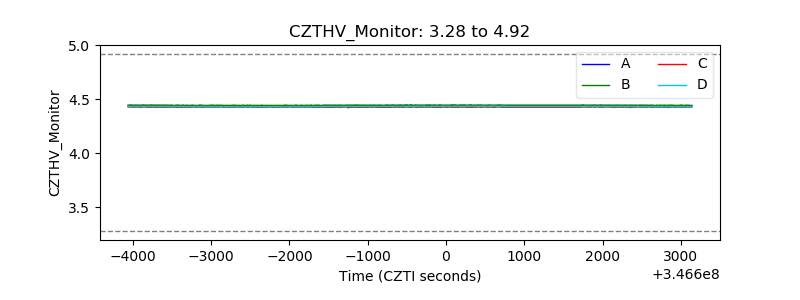 |
| D_VDD | 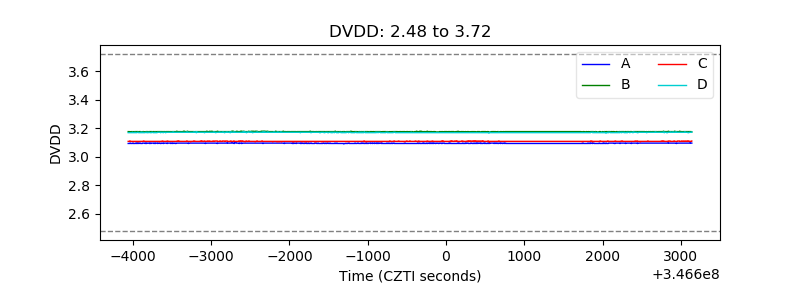 |
| Temperature 1 | 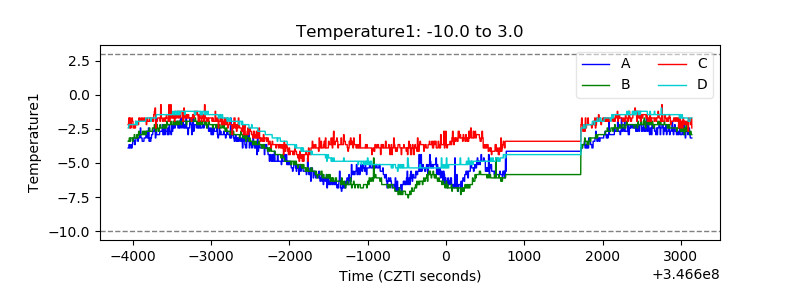 |
| Veto HV Monitor |  |
| Veto LLD | 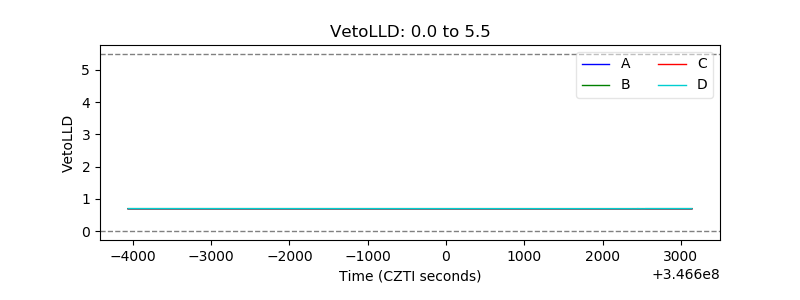 |
| Alpha Counter |  |
| _CPM_Rate | 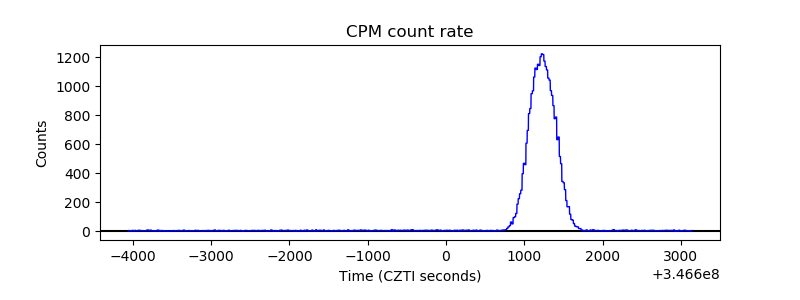 |
| CZT Counter | 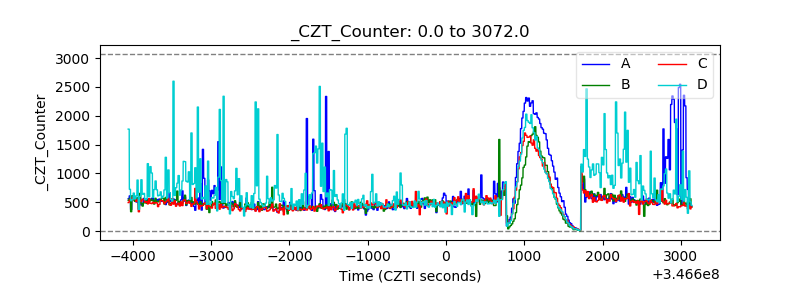 |
| +2.5 Volts monitor |  |
| +5 Volts monitor |  |
| _ROLL_ROT | 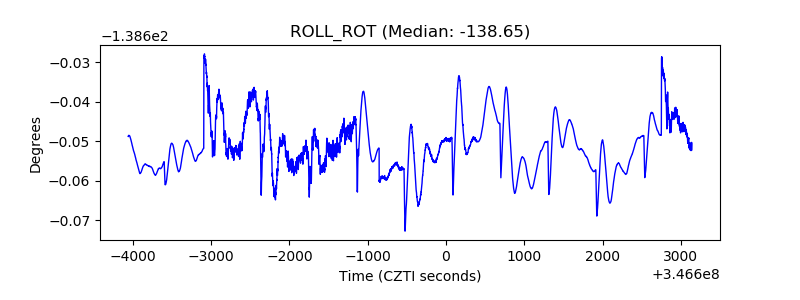 |
| _Roll_DEC |  |
| _Roll_RA | 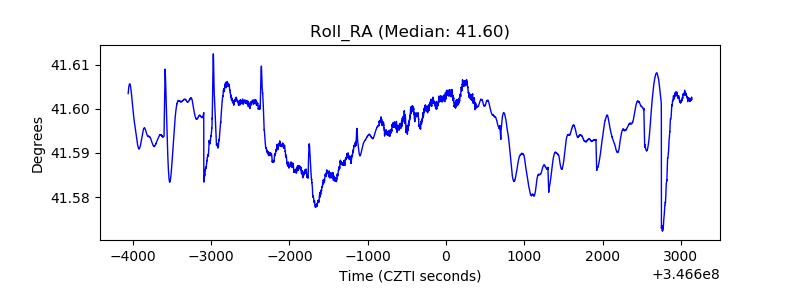 |
| Veto Counter | 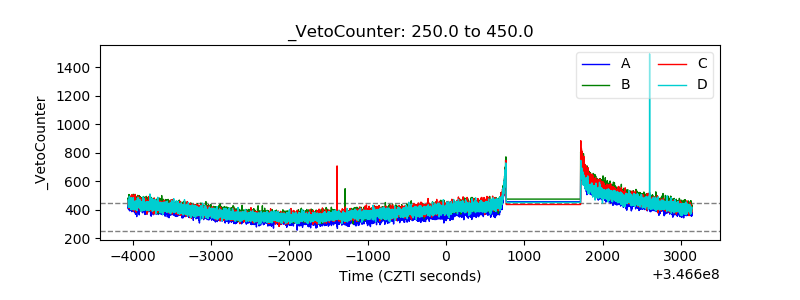 |