| Param | Original file | Final file |
|---|---|---|
| Filename | modeM0/AS1A10_116T01_9000004082_28353cztM0_level2.evt | modeM0/AS1A10_116T01_9000004082_28353cztM0_level2_quad_clean.evt |
| Size (bytes) | 488,698,560 | 92,894,400 |
| Size | 466.1 MB | 88.6 MB |
| Events in quadrant A | 3,596,964 | 610,410 |
| Events in quadrant B | 3,129,485 | 629,014 |
| Events in quadrant C | 2,954,268 | 585,426 |
| Events in quadrant D | 4,703,442 | 559,952 |
| Mode M9 | |||
|---|---|---|---|
| Quadrant | BADHDUFLAG | Total packets | Discarded packets |
| A | 0 | 11 | 0 |
| B | 0 | 11 | 0 |
| C | 0 | 11 | 0 |
| D | 0 | 11 | 0 |
| Mode M0 | |||
|---|---|---|---|
| Quadrant | BADHDUFLAG | Total packets | Discarded packets |
| A | 0 | 14687 | 0 |
| B | 0 | 13137 | 0 |
| C | 0 | 12782 | 0 |
| D | 0 | 18054 | 0 |
| Quadrant | Total seconds | Saturated seconds | Saturation percentage |
|---|---|---|---|
| A | 6134 | 230 | 3.749592% |
| B | 6135 | 68 | 1.108394% |
| C | 6135 | 85 | 1.385493% |
| D | 6135 | 293 | 4.775876% |
Noise dominated data is calculated using 1-second bins in cleaned event files. If a bin has >2000 counts, and if more than 50% of those come from <1% of pixels, then it is considered to be noise-dominated and hence unusable.
| Quadrant | # 1 sec bins | Bins with >0 counts | Bins with >2000 counts | High rate bins dominated by noise | Noise dominated (total time) | Noise dominated (detector-on time) | Marked lightcurve |
|---|---|---|---|---|---|---|---|
| A | 7209 | 6134 | 160 | 160 | 2.22% | 2.61% | 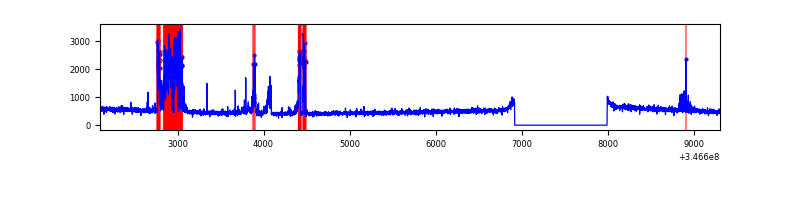 |
| B | 7210 | 6135 | 2 | 2 | 0.03% | 0.03% | 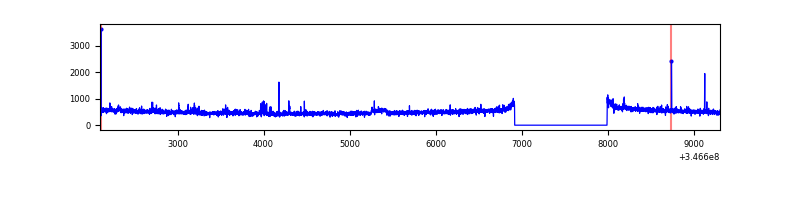 |
| C | 7210 | 6136 | 0 | 0 | 0.00% | 0.00% | 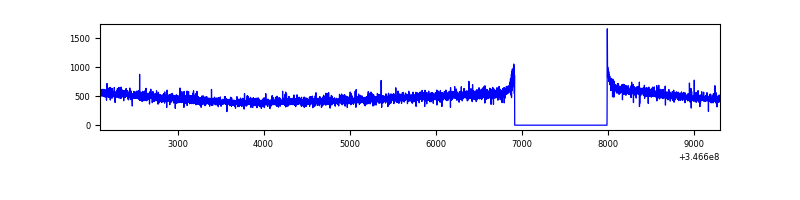 |
| D | 7210 | 6135 | 198 | 198 | 2.75% | 3.23% | 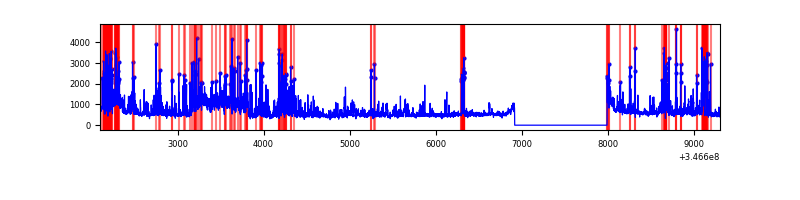 |
Top three noisy pixels from each quadrant. If the there are fewer than three noisy pixels in the level2.evt file, extra rows are filled as -1
| Pixel properties | Quadrant properties | ||||||
|---|---|---|---|---|---|---|---|
| Quadrant | DetID | PixID | Counts | Sigma | Mean | Median | Sigma |
| A | 15 | 174 | 639415 | 4135.65 | 766 | 751 | 154.4 |
| A | 13 | 254 | 10391 | 62.42 | 766 | 751 | 154.4 |
| A | 3 | 137 | 7516 | 43.81 | 766 | 751 | 154.4 |
| B | 10 | 245 | 82228 | 549.96 | 765 | 744 | 148.2 |
| B | 0 | 230 | 27293 | 179.18 | 765 | 744 | 148.2 |
| B | 12 | 111 | 18422 | 119.31 | 765 | 744 | 148.2 |
| C | 14 | 238 | 119205 | 694.34 | 726 | 729 | 170.6 |
| C | 13 | 61 | 5010 | 25.09 | 726 | 729 | 170.6 |
| C | 0 | 10 | 3125 | 14.04 | 726 | 729 | 170.6 |
| D | 1 | 52 | 1299912 | 7444.39 | 724 | 704 | 174.5 |
| D | 8 | 195 | 511355 | 2926.0 | 724 | 704 | 174.5 |
| D | 2 | 250 | 94540 | 537.67 | 724 | 704 | 174.5 |
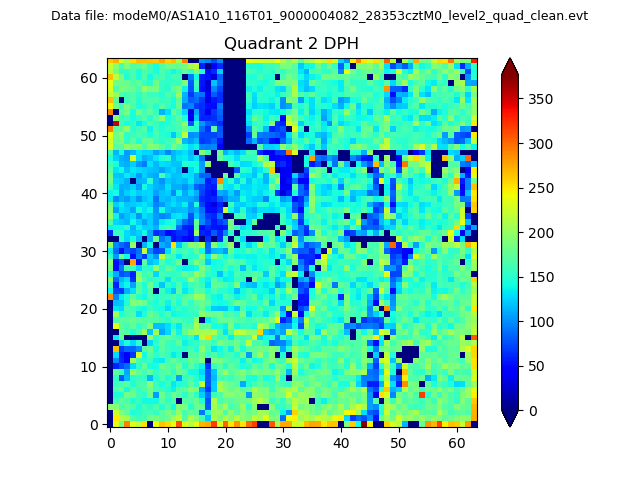
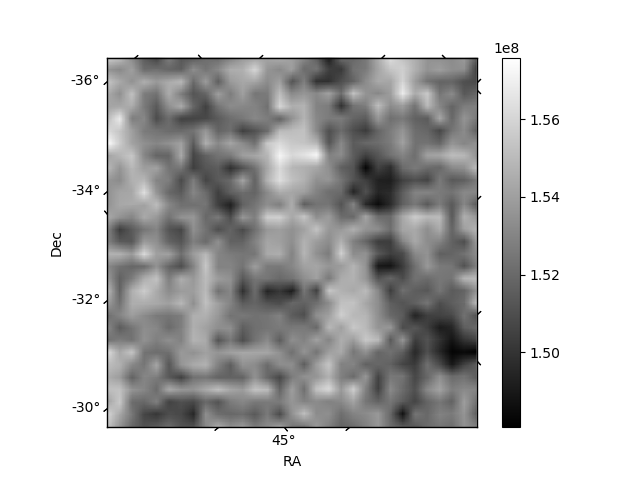
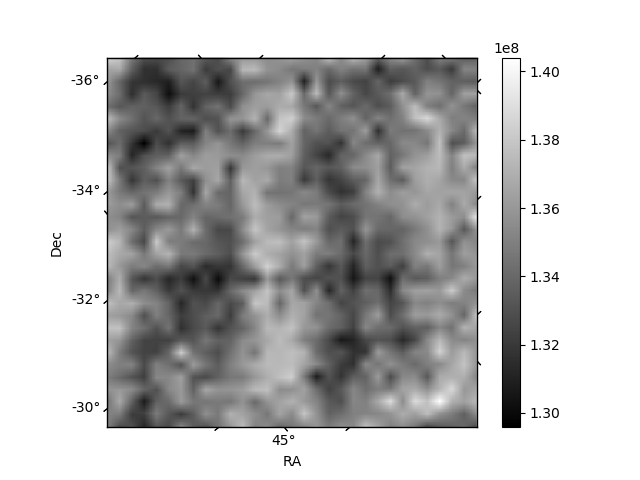
Histogram calculated using DETX and DETY for each event in the final _common_clean file
| Quadrant A | 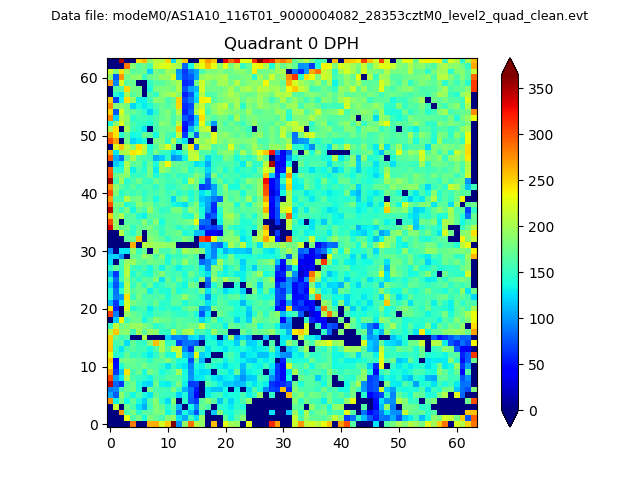 |
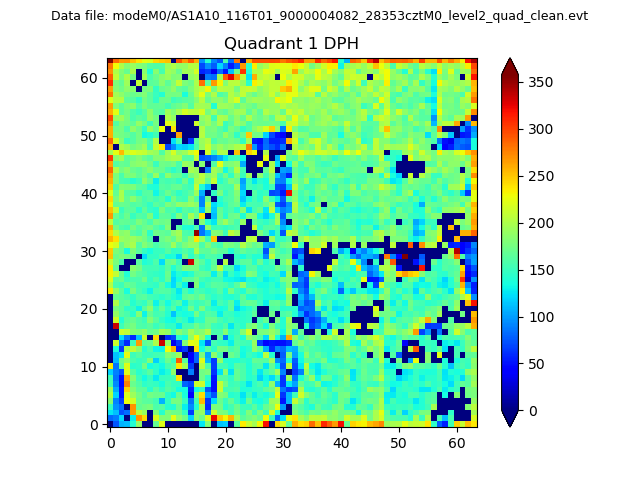 |
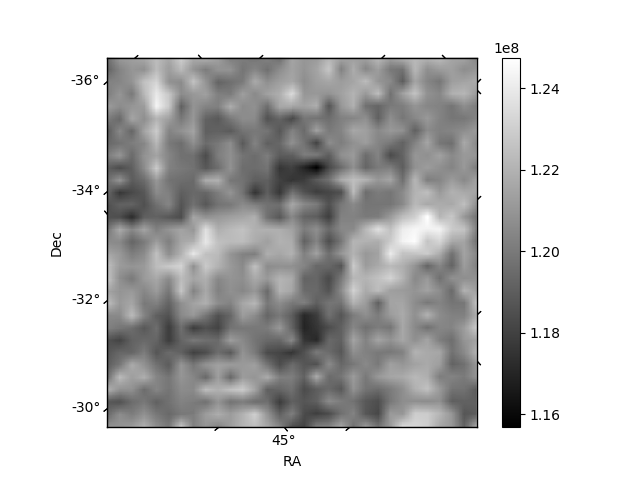
Quadrant B |
|---|---|---|---|
| Quadrant D | 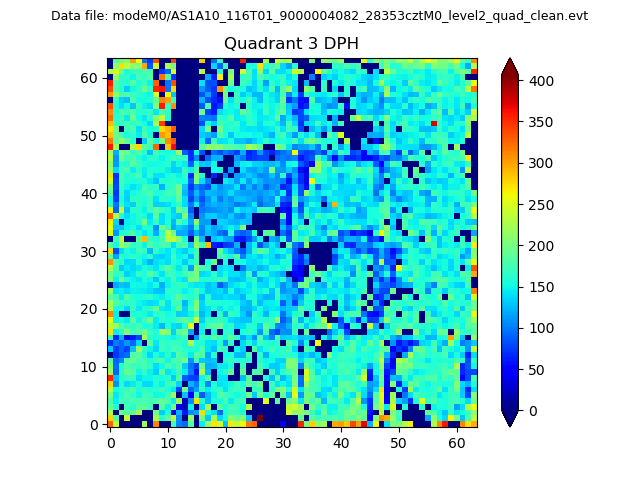 |
 |
Quadrant C |
| Plot type | Count rate plots | Images |
|---|---|---|
| Comparison with Poisson distribution Blue bars denote a histogram of data divided into 1 sec bins. Red curve is a Poisson curve with rate = median count rate of data. |
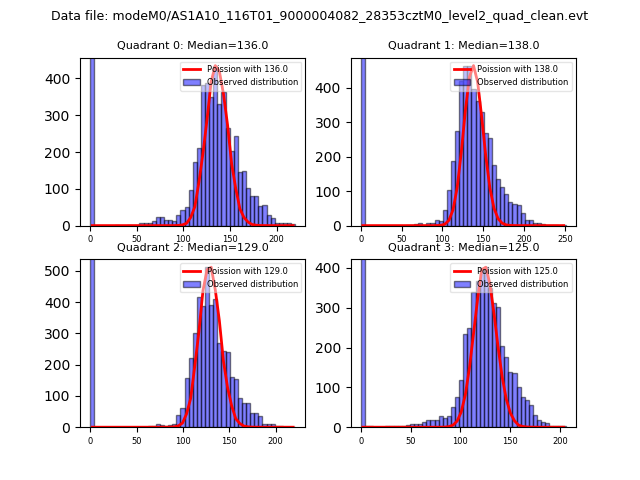 |
 |
| Quadrant-wise count rates Data is divided into 100 sec bins |
 |
|
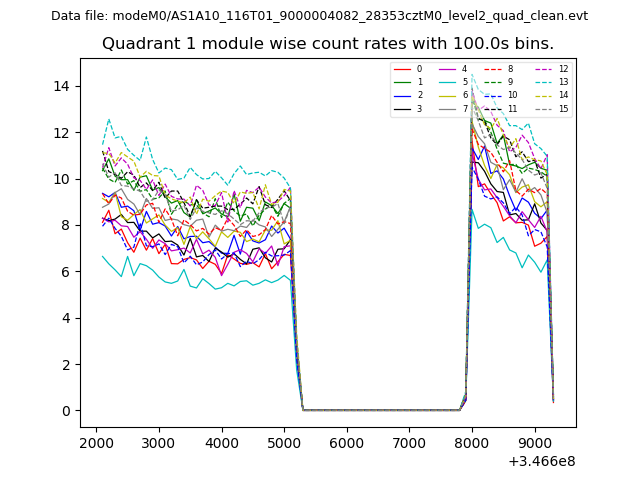
| Module-wise count rates for Quadrant A Data is divided into 100 sec bins |
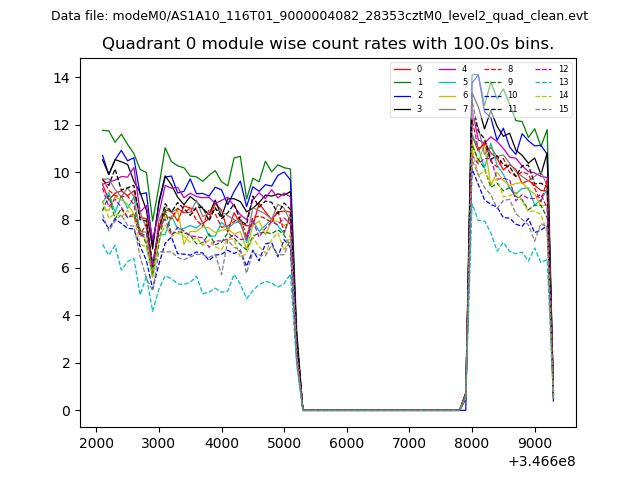 |
 |
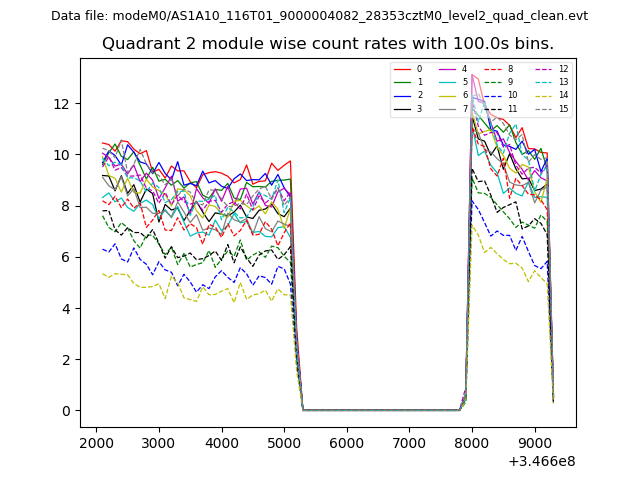
| Module-wise count rates for Quadrant B Data is divided into 100 sec bins |
 |
 |
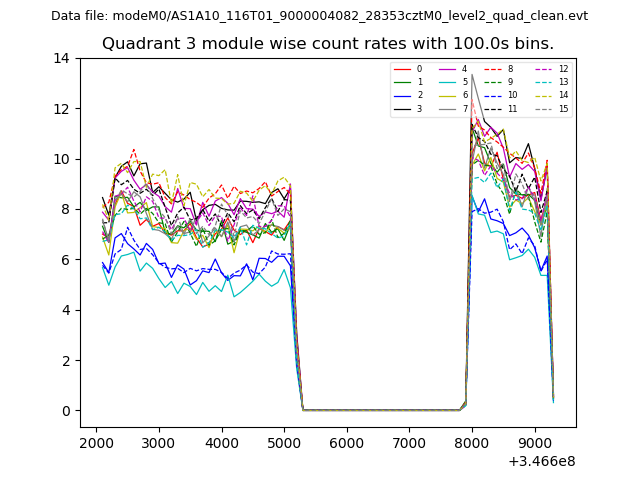
| Module-wise count rates for Quadrant C Data is divided into 100 sec bins |
 |
 |
| Module-wise count rates for Quadrant D Data is divided into 100 sec bins |
 |
 |
| Parameter | Plot |
|---|---|
| CZT HV Monitor | 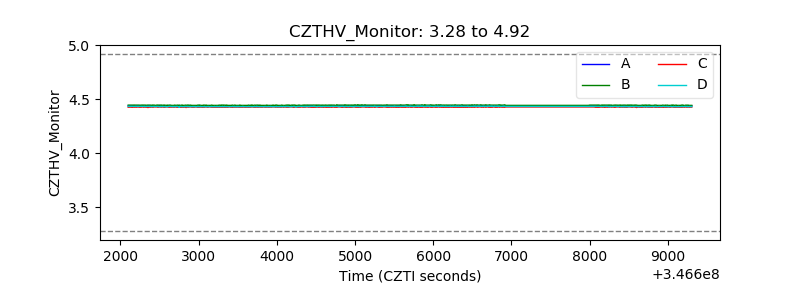 |
| D_VDD | 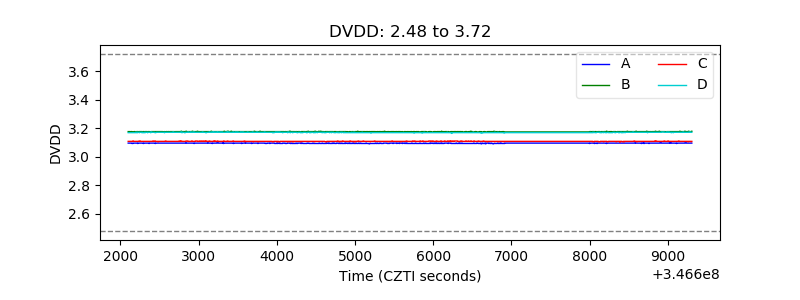 |
| Temperature 1 | 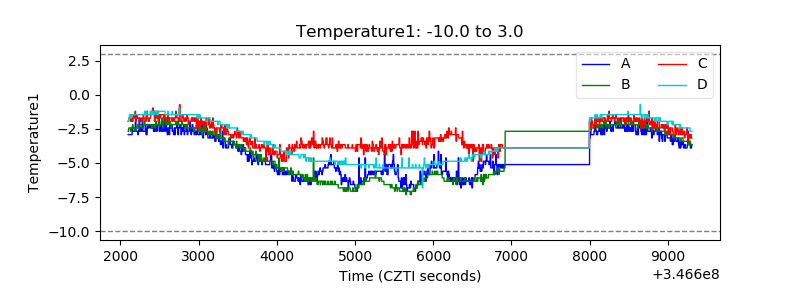 |
| Veto HV Monitor | 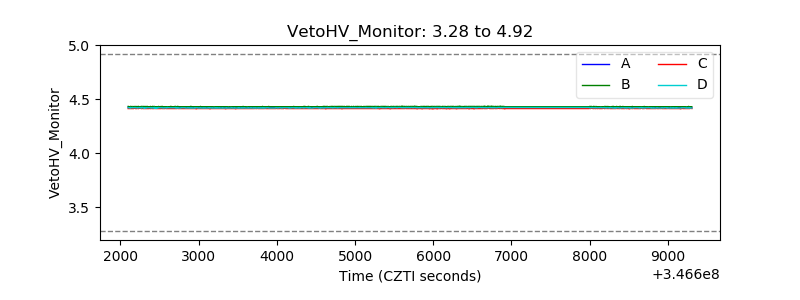 |
| Veto LLD | 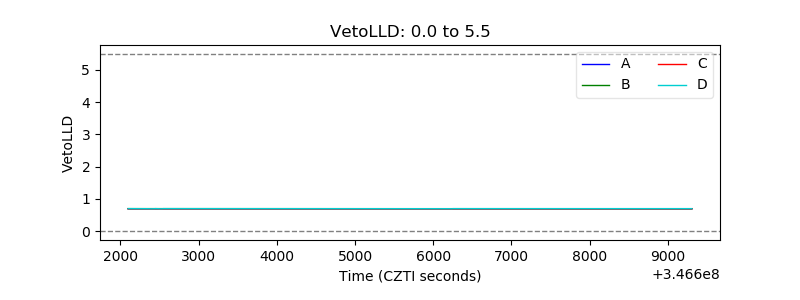 |
| Alpha Counter |  |
| _CPM_Rate | 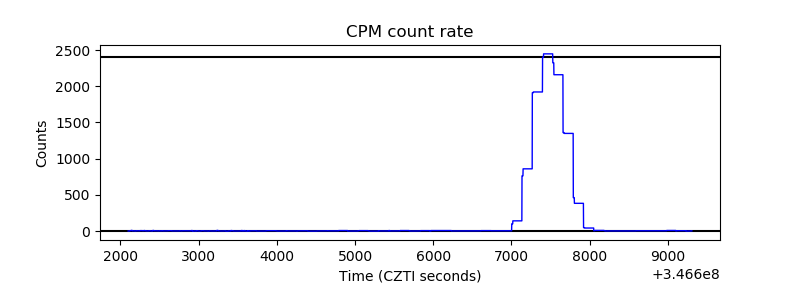 |
| CZT Counter | 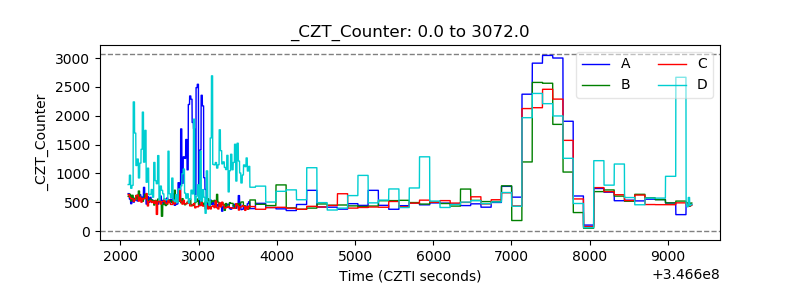 |
| +2.5 Volts monitor |  |
| +5 Volts monitor |  |
| _ROLL_ROT | 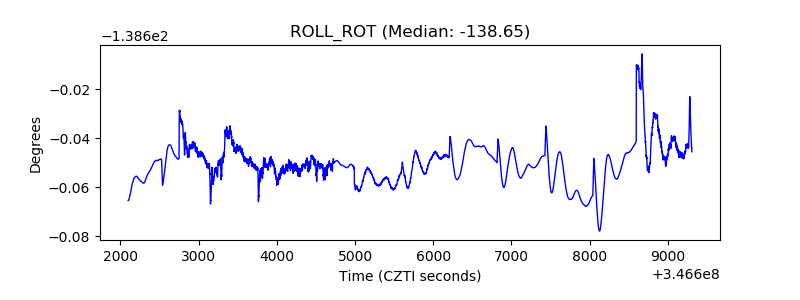 |
| _Roll_DEC | 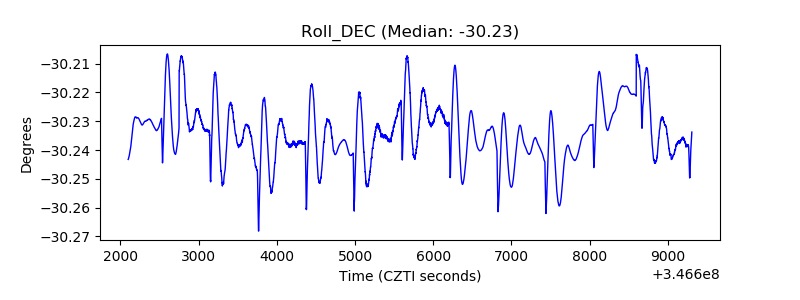 |
| _Roll_RA | 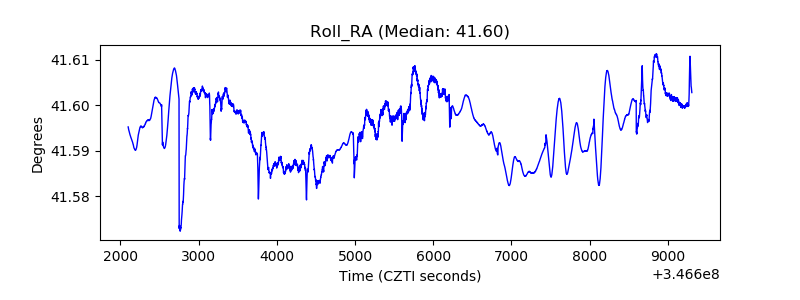 |
| Veto Counter | 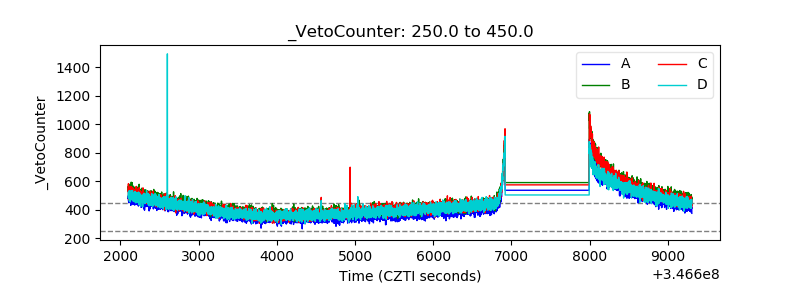 |