| Param | Original file | Final file |
|---|---|---|
| Filename | modeM0/AS1A10_116T01_9000004082_28354cztM0_level2.evt | modeM0/AS1A10_116T01_9000004082_28354cztM0_level2_quad_clean.evt |
| Size (bytes) | 523,880,640 | 101,525,760 |
| Size | 499.6 MB | 96.8 MB |
| Events in quadrant A | 3,518,532 | 678,096 |
| Events in quadrant B | 3,333,921 | 696,183 |
| Events in quadrant C | 3,205,813 | 640,313 |
| Events in quadrant D | 5,368,462 | 608,463 |
| Mode M9 | |||
|---|---|---|---|
| Quadrant | BADHDUFLAG | Total packets | Discarded packets |
| A | 0 | 12 | 0 |
| B | 0 | 12 | 0 |
| C | 0 | 12 | 0 |
| D | 0 | 12 | 0 |
| Mode M0 | |||
|---|---|---|---|
| Quadrant | BADHDUFLAG | Total packets | Discarded packets |
| A | 0 | 14678 | 0 |
| B | 0 | 14058 | 0 |
| C | 0 | 13659 | 0 |
| D | 0 | 20337 | 0 |
| Quadrant | Total seconds | Saturated seconds | Saturation percentage |
|---|---|---|---|
| A | 6473 | 36 | 0.556156% |
| B | 6474 | 42 | 0.648749% |
| C | 6474 | 64 | 0.988570% |
| D | 6473 | 352 | 5.437973% |
Noise dominated data is calculated using 1-second bins in cleaned event files. If a bin has >2000 counts, and if more than 50% of those come from <1% of pixels, then it is considered to be noise-dominated and hence unusable.
| Quadrant | # 1 sec bins | Bins with >0 counts | Bins with >2000 counts | High rate bins dominated by noise | Noise dominated (total time) | Noise dominated (detector-on time) | Marked lightcurve |
|---|---|---|---|---|---|---|---|
| A | 7703 | 6474 | 29 | 29 | 0.38% | 0.45% | 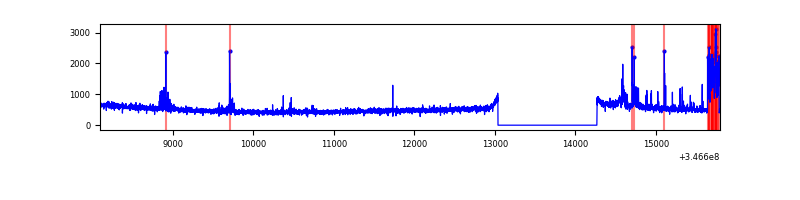 |
| B | 7704 | 6475 | 3 | 3 | 0.04% | 0.05% | 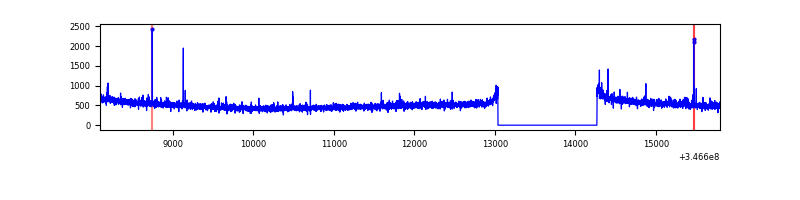 |
| C | 7704 | 6475 | 0 | 0 | 0.00% | 0.00% | 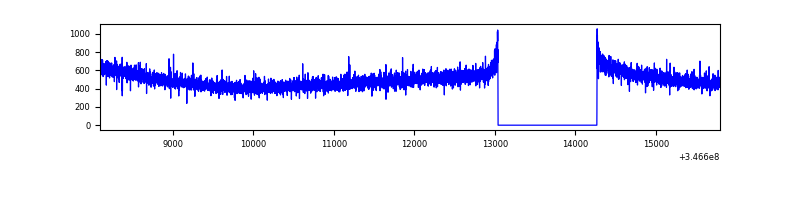 |
| D | 7702 | 6472 | 259 | 259 | 3.36% | 4.00% | 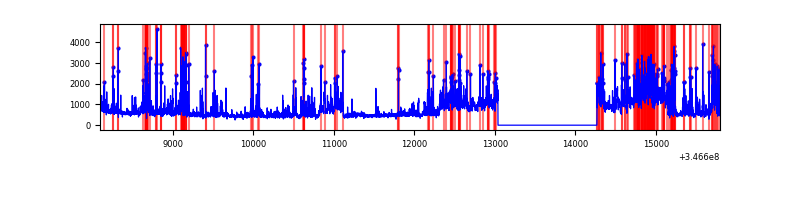 |
Top three noisy pixels from each quadrant. If the there are fewer than three noisy pixels in the level2.evt file, extra rows are filled as -1
| Pixel properties | Quadrant properties | ||||||
|---|---|---|---|---|---|---|---|
| Quadrant | DetID | PixID | Counts | Sigma | Mean | Median | Sigma |
| A | 15 | 174 | 266862 | 1602.17 | 836 | 821 | 166.1 |
| A | 12 | 96 | 29831 | 174.71 | 836 | 821 | 166.1 |
| A | 13 | 254 | 11474 | 64.16 | 836 | 821 | 166.1 |
| B | 0 | 230 | 28681 | 177.24 | 834 | 815 | 157.2 |
| B | 12 | 111 | 18992 | 115.62 | 834 | 815 | 157.2 |
| B | 11 | 111 | 17304 | 104.88 | 834 | 815 | 157.2 |
| C | 14 | 238 | 131351 | 707.59 | 788 | 793 | 184.5 |
| C | 13 | 61 | 5329 | 24.58 | 788 | 793 | 184.5 |
| C | 3 | 233 | 3595 | 15.19 | 788 | 793 | 184.5 |
| D | 1 | 52 | 1264250 | 6887.63 | 779 | 758 | 183.4 |
| D | 8 | 195 | 1059318 | 5770.49 | 779 | 758 | 183.4 |
| D | 2 | 250 | 75588 | 407.92 | 779 | 758 | 183.4 |
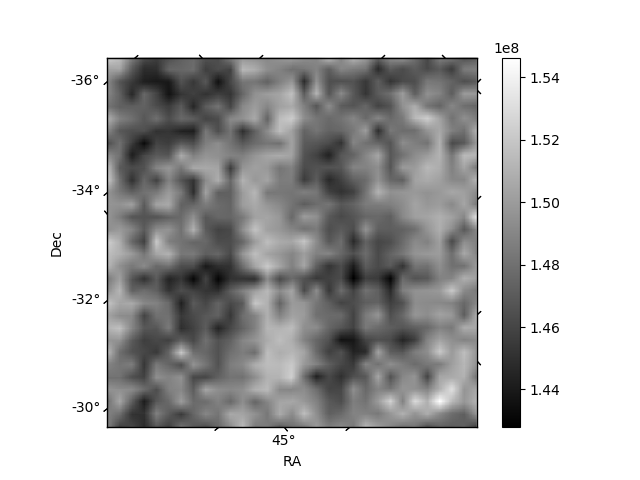
Histogram calculated using DETX and DETY for each event in the final _common_clean file
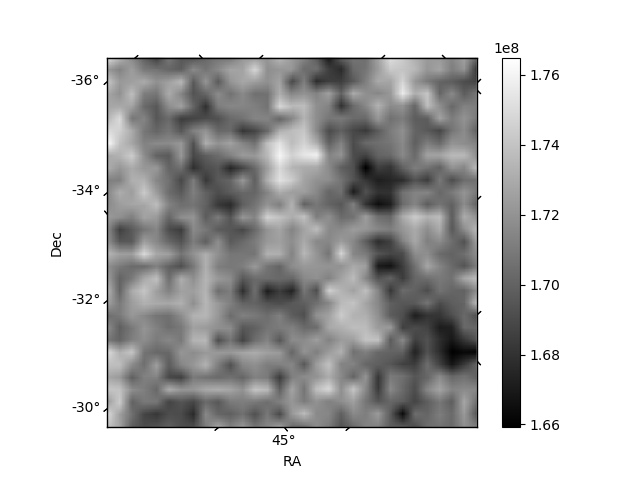
| Quadrant A | 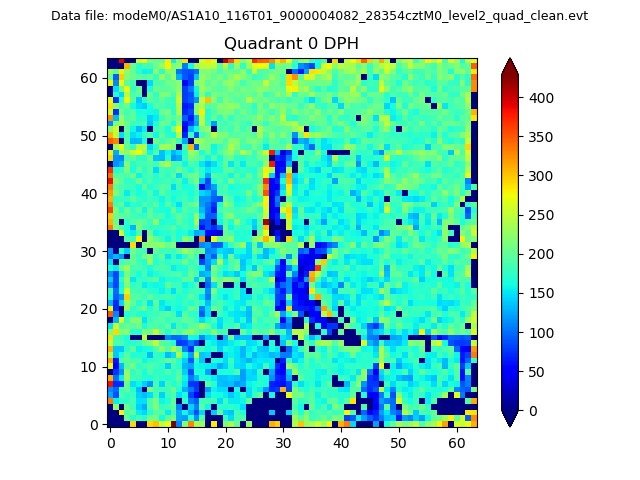 |
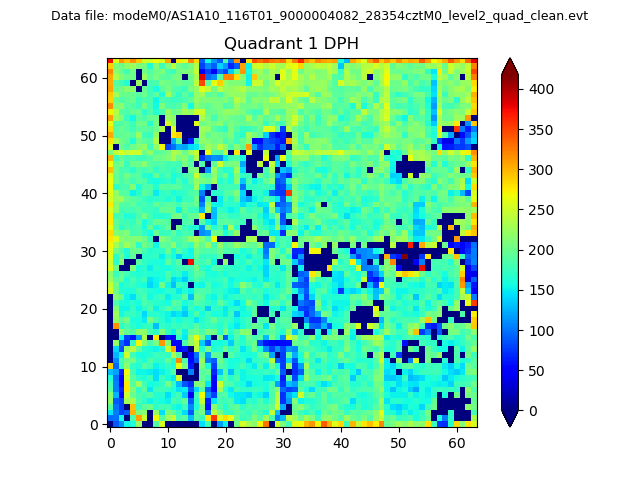 |
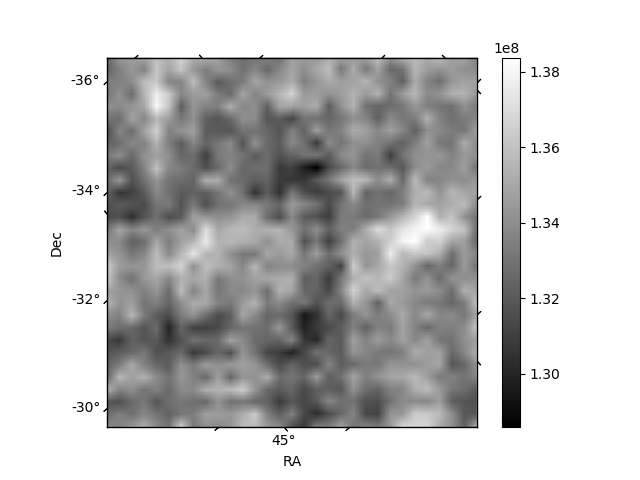
Quadrant B |
|---|---|---|---|
| Quadrant D | 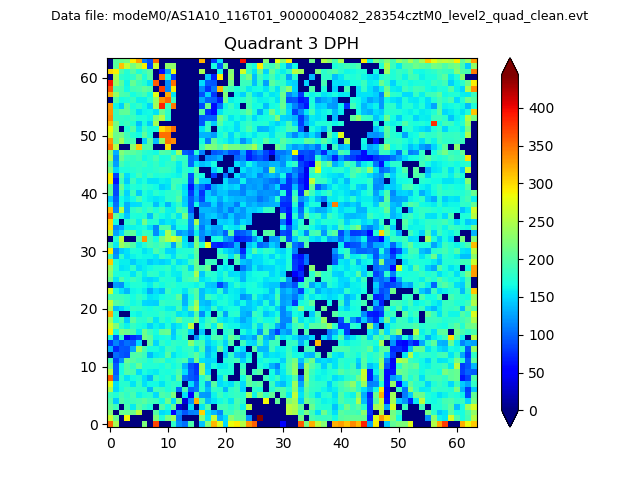 |
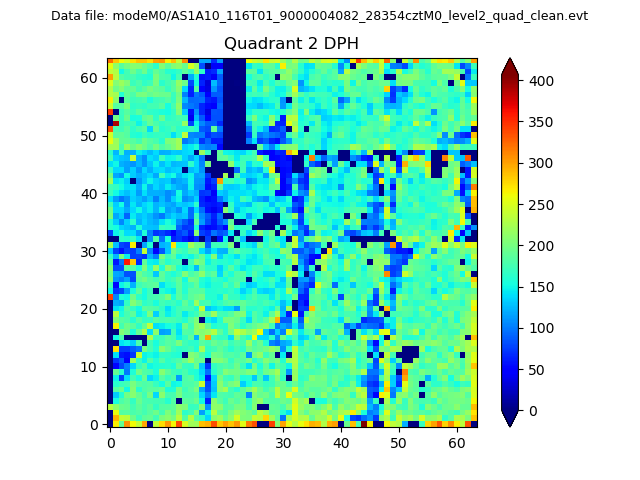 |
Quadrant C |
| Plot type | Count rate plots | Images |
|---|---|---|
| Comparison with Poisson distribution Blue bars denote a histogram of data divided into 1 sec bins. Red curve is a Poisson curve with rate = median count rate of data. |
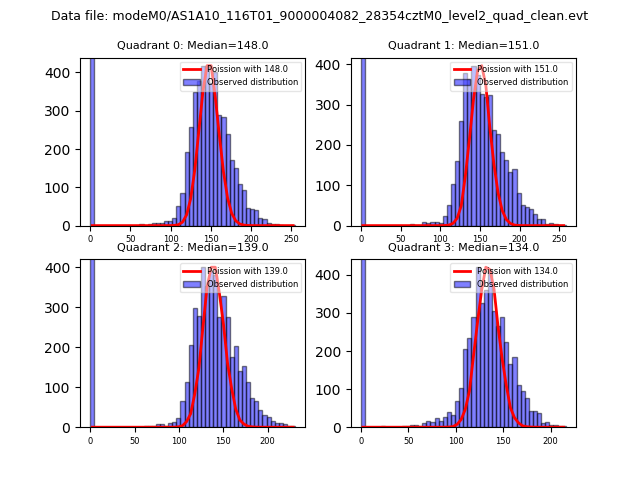 |
 |
| Quadrant-wise count rates Data is divided into 100 sec bins |
 |
|
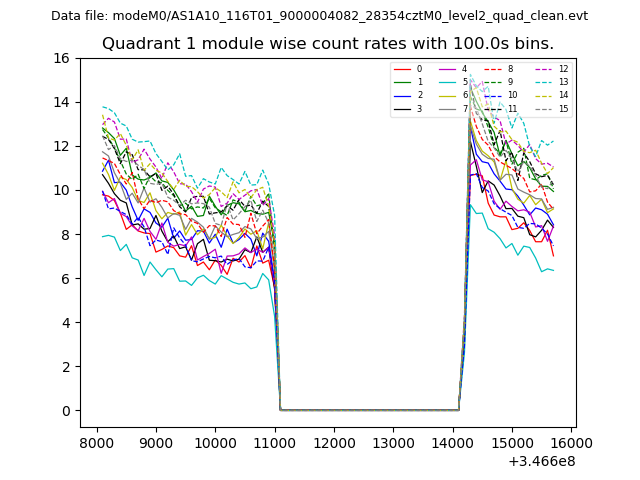
| Module-wise count rates for Quadrant A Data is divided into 100 sec bins |
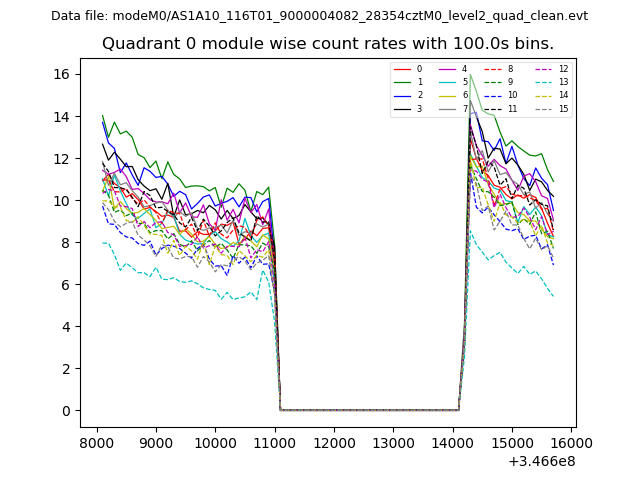 |
 |
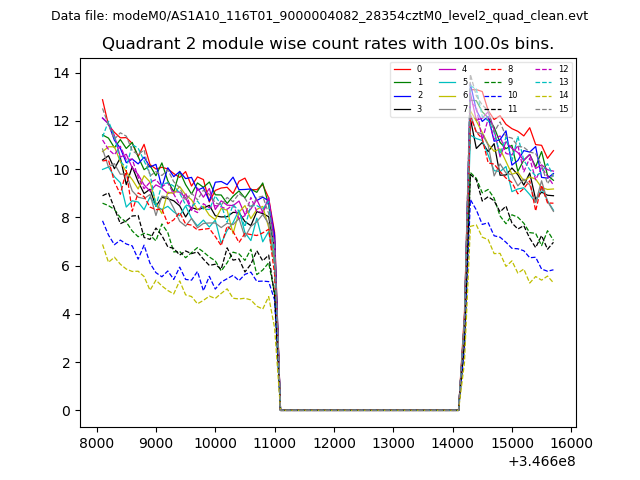
| Module-wise count rates for Quadrant B Data is divided into 100 sec bins |
 |
 |
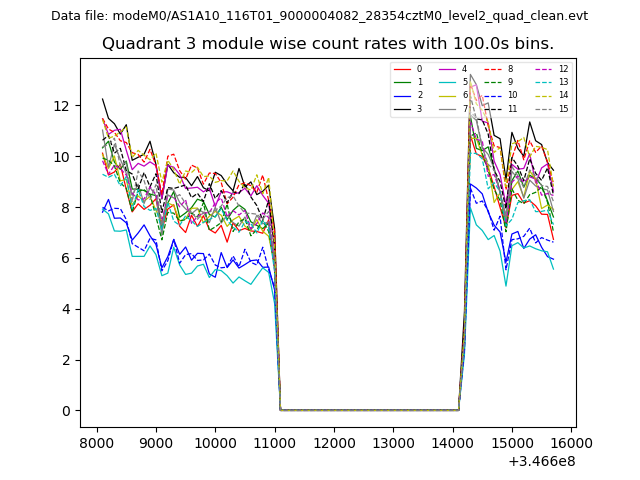
| Module-wise count rates for Quadrant C Data is divided into 100 sec bins |
 |
 |
| Module-wise count rates for Quadrant D Data is divided into 100 sec bins |
 |
 |
| Parameter | Plot |
|---|---|
| CZT HV Monitor | 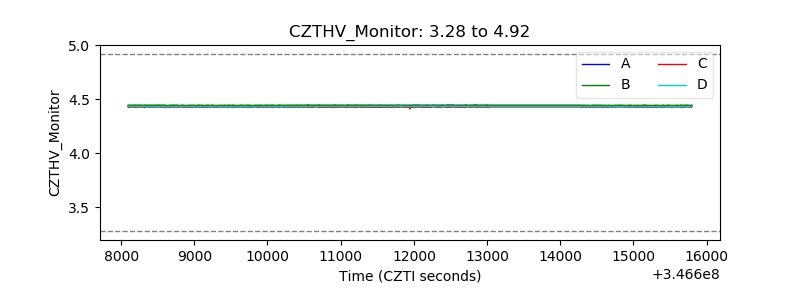 |
| D_VDD | 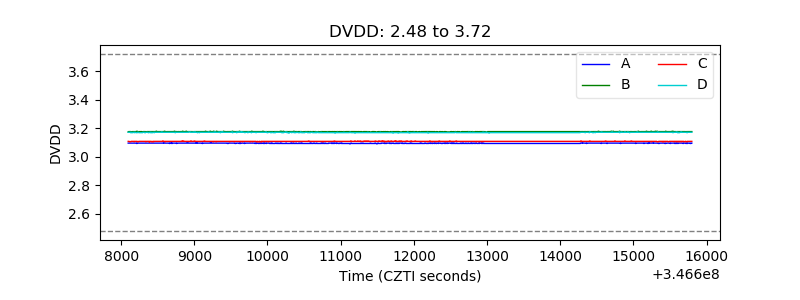 |
| Temperature 1 | 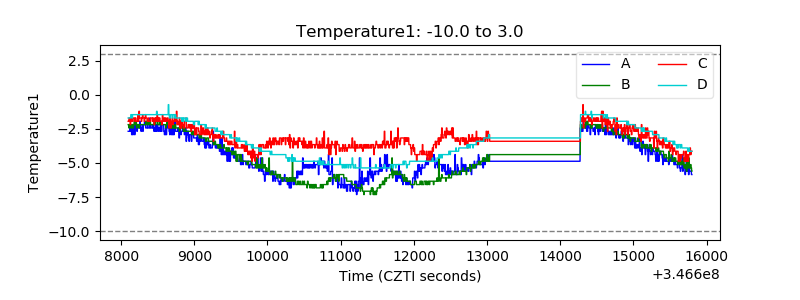 |
| Veto HV Monitor | 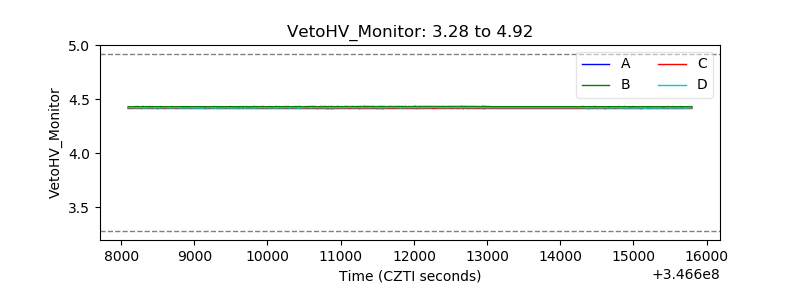 |
| Veto LLD | 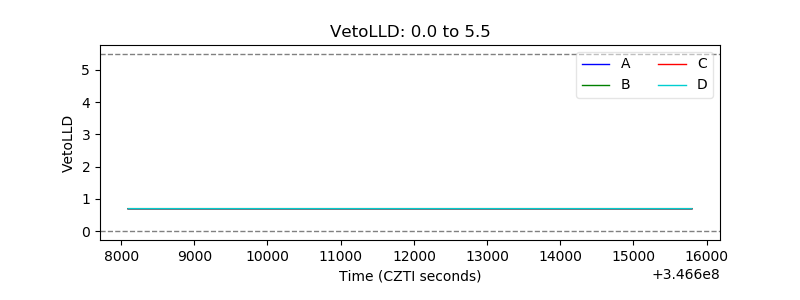 |
| Alpha Counter | 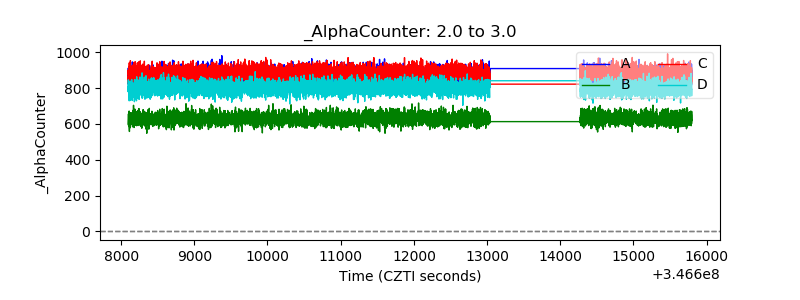 |
| _CPM_Rate |  |
| CZT Counter | 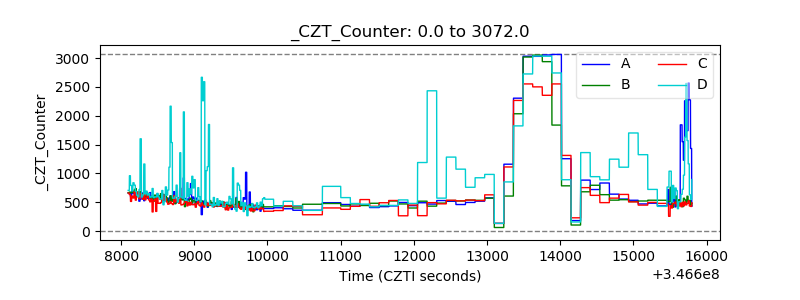 |
| +2.5 Volts monitor |  |
| +5 Volts monitor |  |
| _ROLL_ROT | 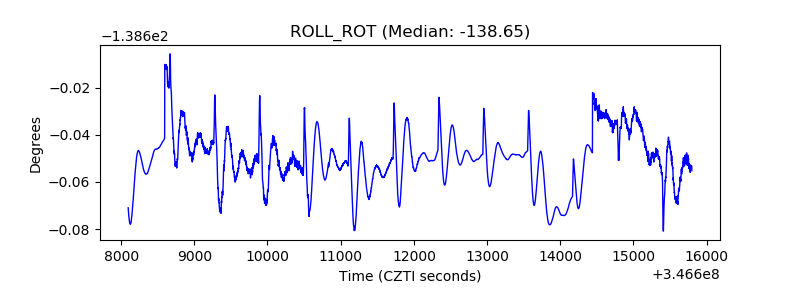 |
| _Roll_DEC | 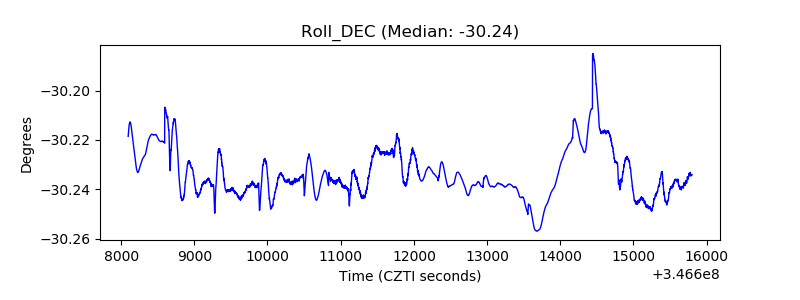 |
| _Roll_RA | 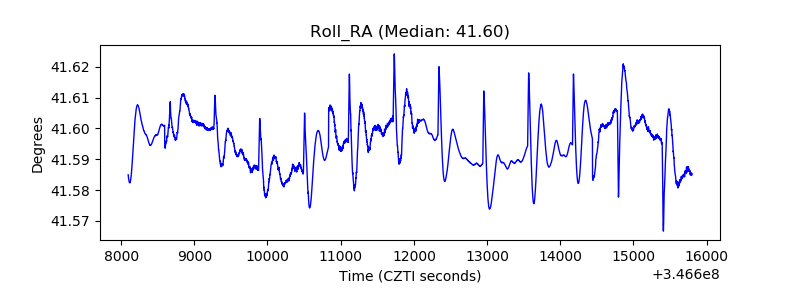 |
| Veto Counter | 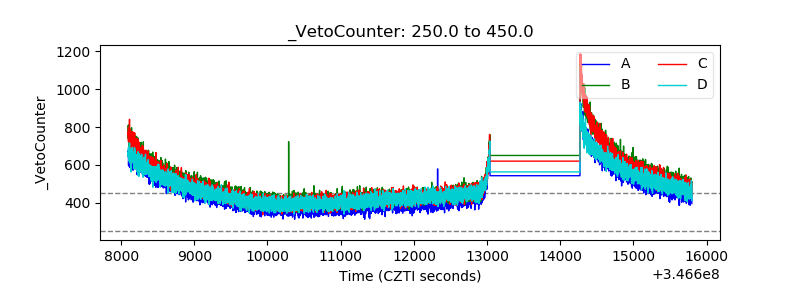 |